February 16, 2024
(press release)
–
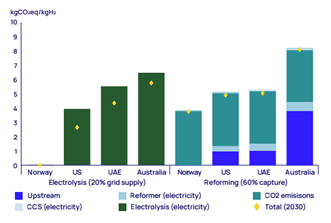
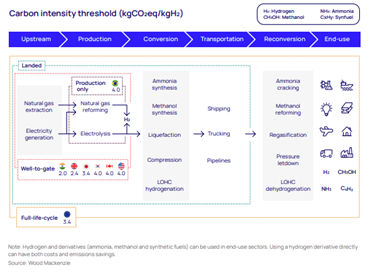
The future of low-carbon hydrogen hinges on global policymakers introducing regulations and subsidies that focus on the carbon intensity of the hydrogen produced rather than its colour, according to Wood Mackenzie’s Horizons report ‘Over the rainbow: Why understanding full value-chain carbon intensity is trumping the colour of hydrogen.’ “The push for better measurement of efforts to cut emissions globally is shining a spotlight on the precise carbon intensity of different sources of hydrogen supply. Because of its potential to deliver almost carbon-free hydrogen, green hydrogen is generating the most industry interest, but it is important exporters and developers look more closely at the full value chain as more regulation is put in place,” Flor De La Cruz, Principal Analyst, author of the report, said. Carbon intensity of blue and green hydrogen For green (electrolytic) hydrogen, nearly all emissions are attributable to the electricity used by the electrolyser. In principle, it should only be called ‘green’ if it uses 100% renewable power. However, the variability of renewables means that multiple electrolytic hydrogen projects are planning grid connection to maximise the utilisation of electrolysers and lower hydrogen unit costs. However, if the availability of renewable power is limited, there is a high risk that green hydrogen projects will need to connect to grids with very high carbon intensity, stated the report. According to Wood Mackenzie’s hydrogen value chain emissions model, emissions from green hydrogen produced from 100% grid power could be as high as 50 kilograms of CO2 equivalent per kilogram of hydrogen (kgCO2e/kgH2) – worse than brown hydrogen* – if the electrolyser is connected to a grid powered by fossil fuels. Currently, at least 30% of the 565-gigawatt electrolysis (Gwe) of announced or operational green hydrogen projects are expected to be grid connected, as shown in Wood Mackenzie’s Lens Hydrogen project tracker. In the case of blue hydrogen, emissions can come from upstream natural gas production, transportation, reforming, and energy use. In principle, almost all these emissions can be captured and stored. However, capturing more than 60% of the carbon dioxide from hydrogen production is costly and has yet to be proven at scale. Blue and green emissions, 2023: Source: Wood Mackenzie Lens Hydrogen and Ammonia Service (please see assumptions in Notes to Editors). A spotlight on life-cycle emissions Hydrogen's carbon intensity isn’t just limited to its production, stated the report. With more than 40% of announced project capacity targeting exports, it is important to understand its full life-cycle emissions, including processing ammonia and transportation. “If transport is required, production emissions for hydrogen only tell part of the story, as unaccounted, often substantial, emissions occur through the rest of the value chain. For example, any future trade in hydrogen between Australia and Northeast Asia or the Middle East and Europe requires hydrogen to be shipped across significant distances,” De La Cruz said. Many countries have already established carbon-intensity thresholds for low-carbon hydrogen. But most, including future importers such as Japan and South Korea, only count production or well-to-gate emissions. For future developers and buyers of blue and green hydrogen, it is critical to consider emissions abatement strategies across each step of the value chain. Most developers of hydrogen export projects aim to use ammonia as the carrier. While it is the most promising carrier from a cost and a technology readiness perspective, ammonia’s total value chain emissions, including synthesis, transportation, and cracking, are significant, and could add 1-4.5 kgCO2e/kgH2 to the carbon intensity of the final product. Complying with regulatory requirements Emissions from transport and processing can make a critical difference to whether hydrogen sources can meet regulatory requirements, stated the report. Green hydrogen with 20% grid supply and blue hydrogen with 60% capture do not make the cut in the EU or Japan. But even US blue hydrogen, with 95% capture converted to ammonia and shipped to the EU, would be at the very limit of the European carbon intensity threshold. Cracking the ammonia back into hydrogen in the Netherlands, for example, would tip hydrogen over the edge. Green hydrogen made using 100% renewable power and converted into green ammonia would have an emissions intensity below the EU threshold, even if shipped from Australia. But if imported hydrogen is produced using even a small amount of grid power, it could struggle to stay below EU and Japanese threshold limits. Exporters will need to focus on technologies for reducing the emissions from ammonia, transportation, and processing, so they can comply with varying regulation. De La Cruz added: “Subsidies will be vital to support low-carbon hydrogen supply and demand for years to come and will make or break project economics. With carbon intensity thresholds and associated rules forming the basis of incentive frameworks in most markets, a key issue for the industry now is how far these rules will incorporate full-cycle emissions.” Only the EU defines carbon intensity as including emissions across the full life cycle through its Delegated Acts. In the US, guidance issued by the Treasury in December 2023 sets increasingly demanding requirements for projects to be eligible for the maximum US$3/kgH2 production tax credit available under the Inflation Reduction Act. However, under the current well-to-gate scope, US green hydrogen project developers need to source renewable electricity only for their production, not for any conversion to ammonia or another derivative. In Asia, Japan and South Korea have signalled they will gradually expand the emissions scope to ‘landed’ to include ammonia conversion and transportation emissions, though neither has yet implemented this. ENDS The global hydrogen market today is around 90 Mtpa) almost all of it carbon-intensive grey or brown hydrogen. Looking ahead project production is forecasted to triple to 270 Mtpa by 2050, with low-carbon green and blue hydrogen accounting for 200 Mtpa of this, according to Wood Mackenzie’s base case as outlined in the Energy Transition Outlook. *Brown hydrogen definition Brown hydrogen is made from coal or lignite via the gasification process. Graph 1: Blue and green emissions, 2023. Assumptions: Blue hydrogen: Assuming a retrofitted SMR unit with 60% capture. Reforming emissions will vary by technology (SMR vs ATR) and whether the asset is retrofit or newbuild. For upstream, we assume the average emissions for all gas-producing assets in each country, including methane fugitive emissions. Upstream emissions and methane fugitive emissions vary by asset. Electricity for reforming and CCS is sourced from the grid, assuming an average grid intensity in each country. The grid intensity will vary by region in larger markets such as Australia and the US and will decrease over time. Green hydrogen: assuming an average grid intensity in each market. Electricity consumption assumed is 55kWh/kgH2 for the electrolyser system. The electricity consumption will vary by electrolyser technology and can range from 40 kWh/kgH2 to 60 kWh/kgH2 for an electrolyser system. Electrolyser efficiency is expected to improve over time.

* All content is copyrighted by Industry Intelligence, or the original respective author or source. You may not recirculate, redistrubte or publish the analysis and presentation included in the service without Industry Intelligence's prior written consent. Please review our terms of use.


