SAN JOSE, California
,
April 20, 2022
(press release)
–
Adobe (Nasdaq:ADBE) announced the latest online inflation data from the Adobe Digital Price Index (DPI). In March 2022, online prices increased 3.6% year-over-year (YoY) and 0.3% month-over-month (MoM), matching the record YoY high in February 2022. This marks the 22nd consecutive month of YoY inflation online. In March, prices for apparel increased 16.3% YoY (up 0.3% MoM), more than any other category. Grocery prices continued to surge and rose 9.0% YoY (up 1.4% MoM), a new record. Prices for everyday staples including pet products increased 7.0% YoY (up 1.5% MoM), and personal care items increased 1.4% YoY (up 0.1% MoM). Despite higher prices and supply chain challenges that drove 3.1 billion out-of-stock messages in March, demand for e-commerce remained strong. Consumers spent $83.1 billion (up 7% YoY), a significant increase from $67 billion in February, as the digital economy continued to shift to more personalized customer experiences. The DPI provides the most comprehensive view into how much consumers pay for goods online. Powered by Adobe Analytics, it analyzes one trillion visits to retail sites and over 100 million SKUs across 18 product categories: electronics, apparel, appliances, books, toys, computers, groceries, furniture/bedding, tools/home improvement, home/garden, pet products, jewelry, medical equipment/supplies, sporting goods, personal care products, flowers/related gifts, non-prescription drug and office supplies. “Consumers are feeling a greater hit to their pocketbooks, with consistently high levels of online inflation in categories such as groceries and pet products,” said Patrick Brown, vice president of growth marketing and insights, Adobe. “But while e-commerce prices have risen more than years past, durable demand shows that consumers are embracing more personalized experiences in the digital economy as well as the conveniences of online shopping, particularly for growing categories like groceries.” Over the last 12 months, apparel has consistently outpaced the Consumer Price Index (CPI), which captures prices that consumers pay for goods offline. In February, apparel prices rose 11.0% in the DPI, compared to 3.1% in the CPI (indexed to 2014). Non-prescription drugs followed a similar trend, with the DPI up 7.9% and the CPI down 1.2% in February. For everyday staples like groceries and pet products, online prices now move in tandem with the CPI. In March, 14 of the 18 categories tracked by the DPI saw YoY price increases, with apparel rising the most. Price drops were observed in four categories: electronics, jewelry, toys and computers. On a MoM basis, 12 of the 18 categories saw March price increases, with price drops observed in categories including electronics, books, toys, flowers/related gifts, computers and sporting goods. Notable Categories in the Adobe Digital Price Index for March: Methodology The DPI is modeled after the Consumer Price Index (CPI), published by the U.S. Bureau of Labor Statistics, and uses the Fisher Price Index to track online prices. The Fisher Price Index uses quantities of matched products purchased in the current period (month) and a previous period (previous month) to calculate the price changes by category. Adobe’s analysis is weighted by the real quantities of the products purchased in the two adjacent months. Adobe uses a combination of Adobe Sensei, Adobe’s AI and machine learning framework, and manual effort to segment the products into the categories defined by the CPI manual. The methodology was first developed alongside renowned economists Austan Goolsbee and Pete Klenow.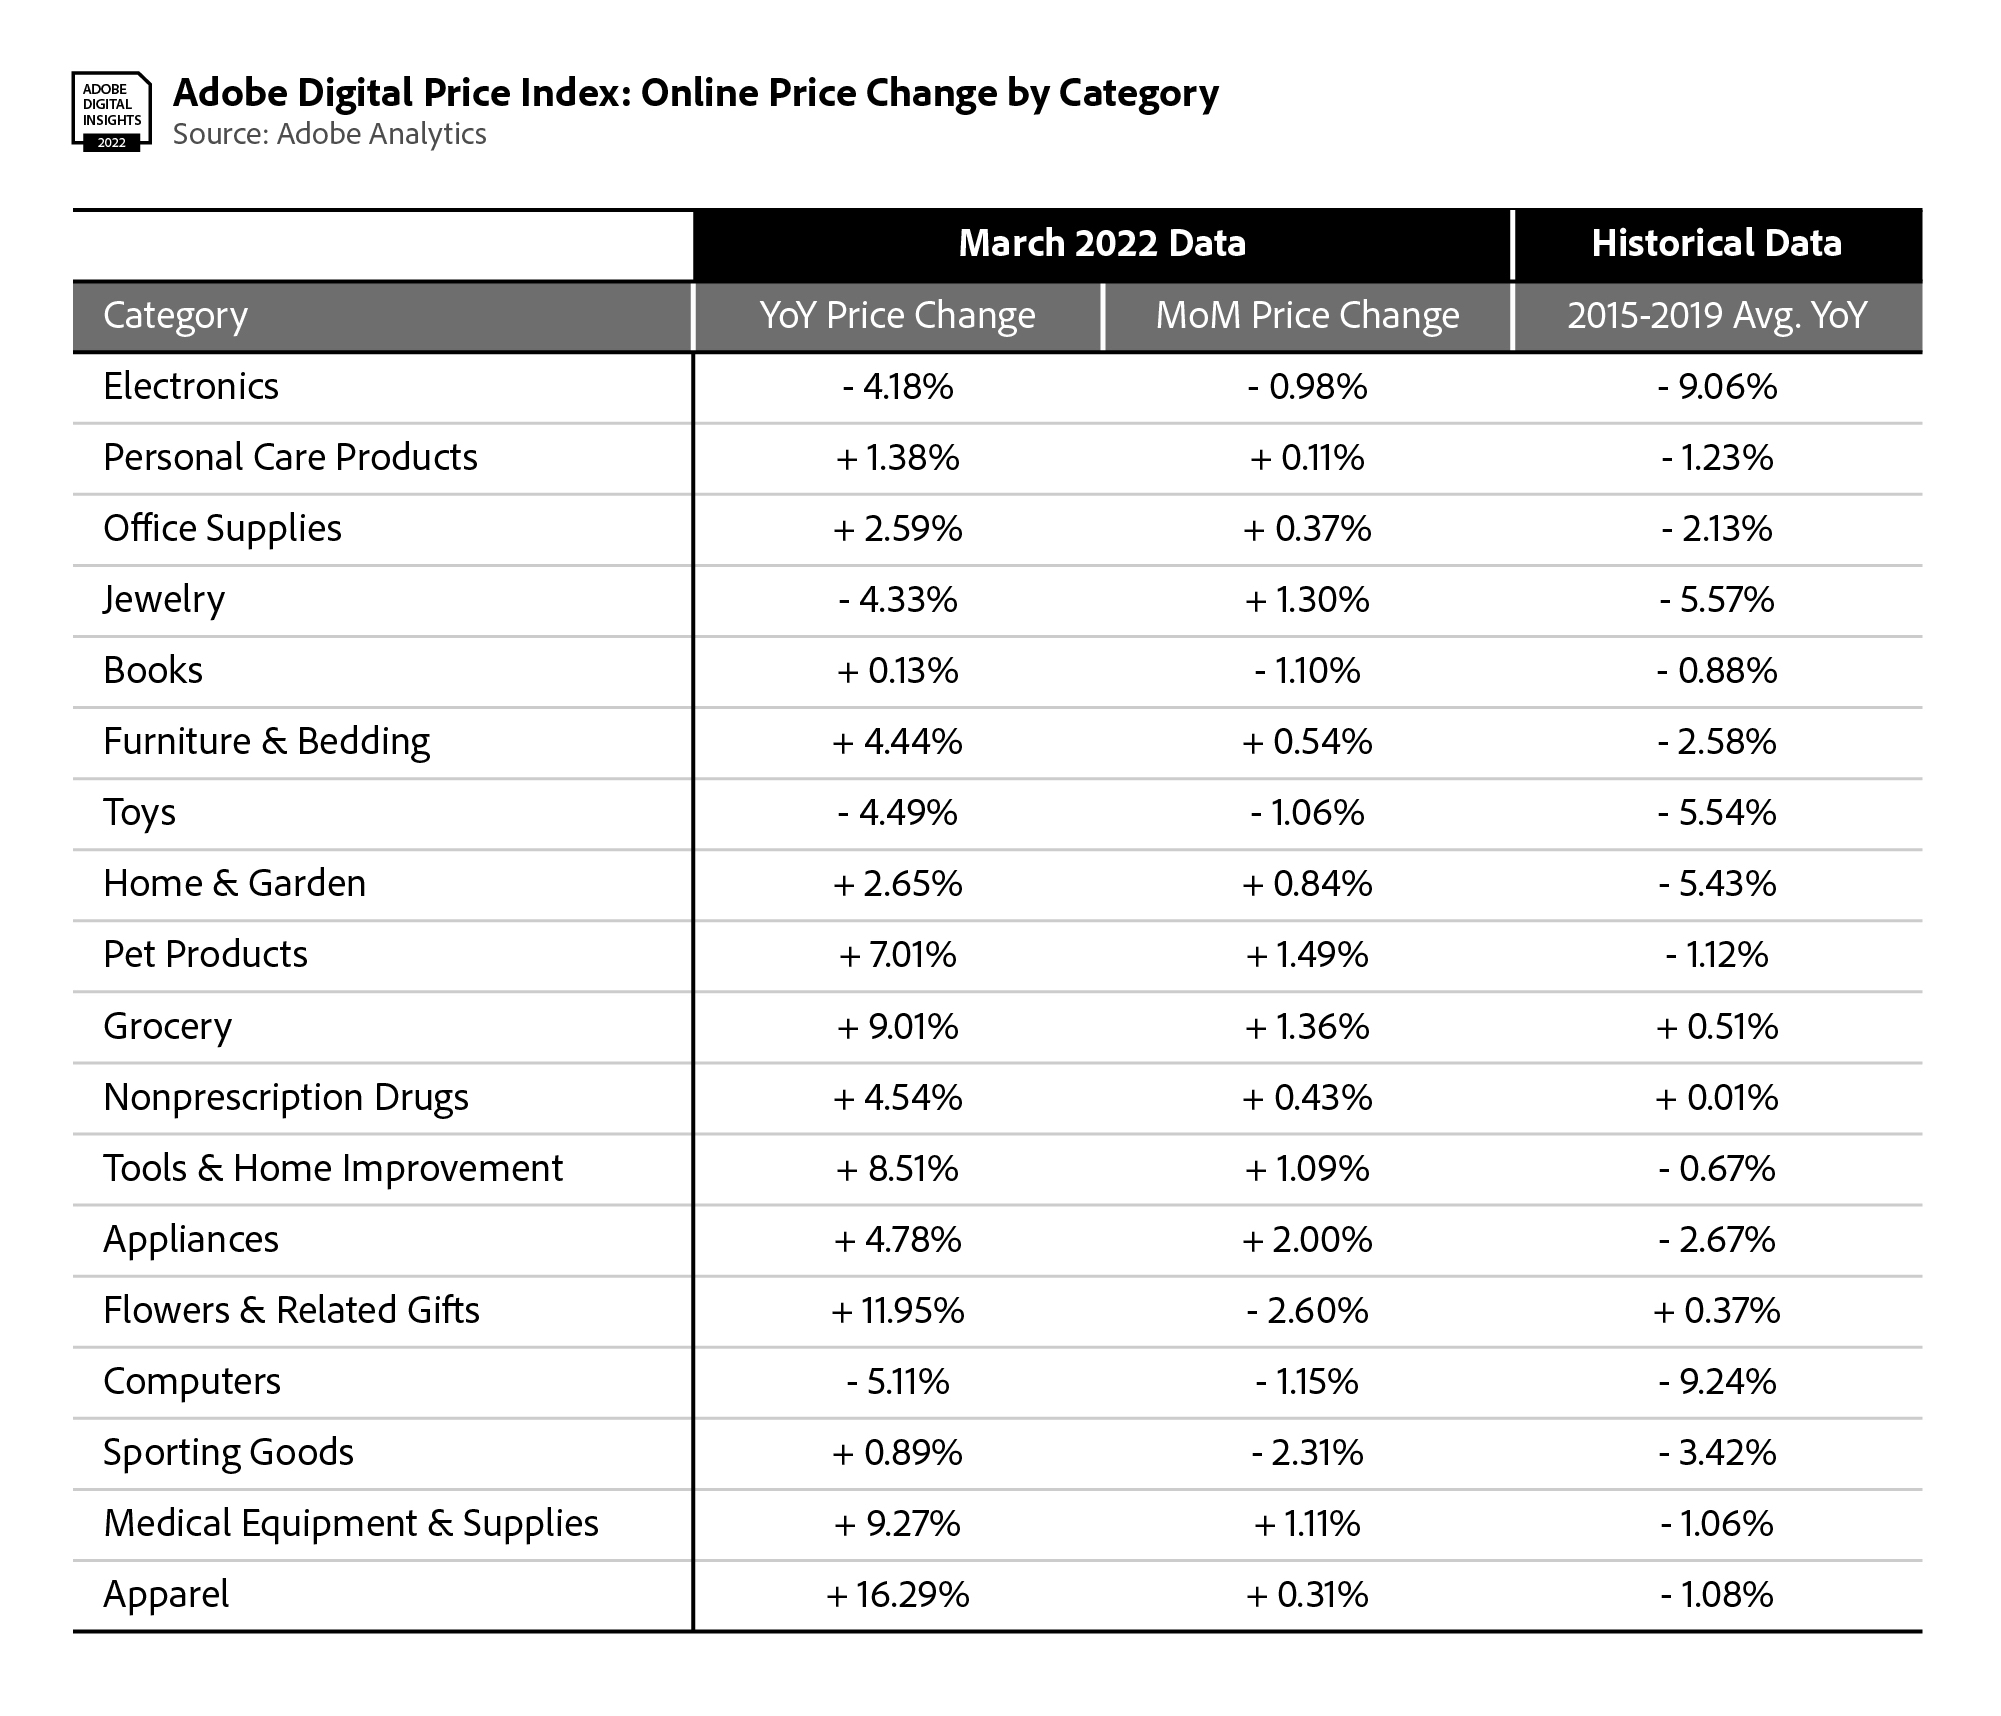
* All content is copyrighted by Industry Intelligence, or the original respective author or source. You may not recirculate, redistrubte or publish the analysis and presentation included in the service without Industry Intelligence's prior written consent. Please review our terms of use.


