MACROECONOMY & END-USE MARKETS
Running tab of macro indicators: 9 out of 20
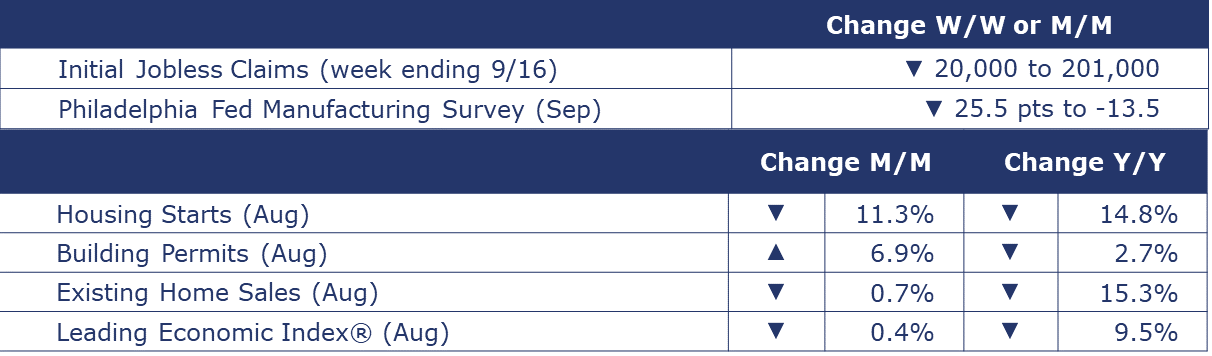
The number of new jobless claims fell by 20,000 to 201,000 during the week ending September 16. Continuing claims fell by 98,267 to 1.679 million, and the insured unemployment rate for the week ending September 9 was unchanged at 1.1%.
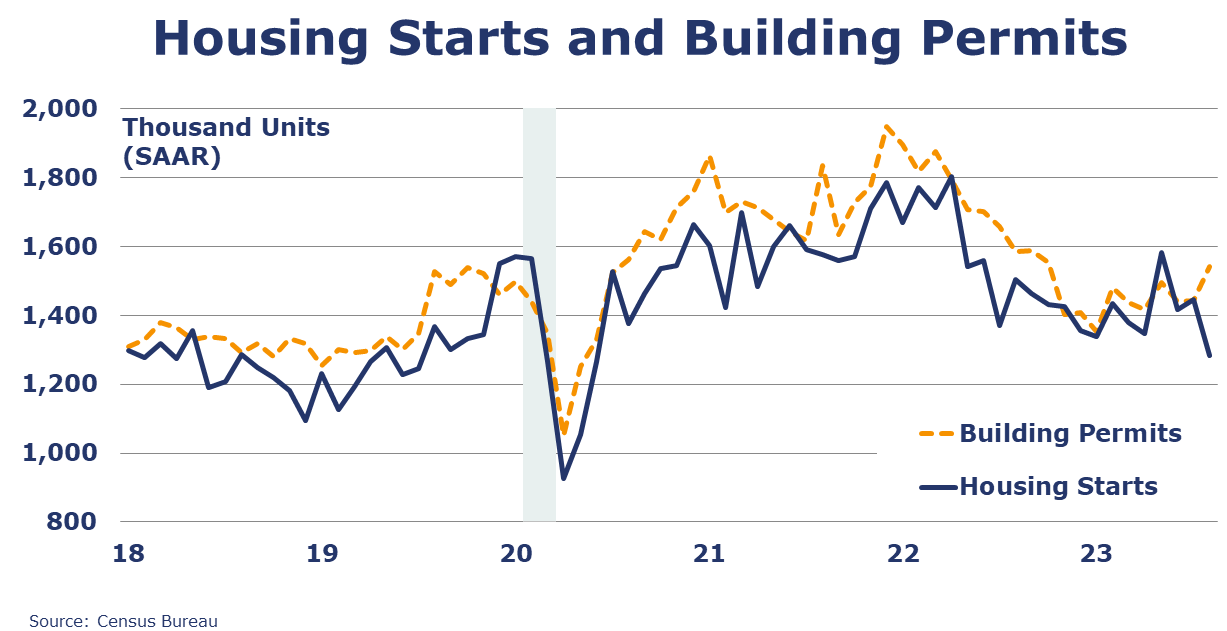
Housing starts fell sharply in August, down 11.3% to a 1.283 million SAAR, the lowest pace since June 2020. The decline reflected a steep pullback in the West and likely the result of disruptions from Hurricane Hilary. Chemistry-intensive single-family starts were down 4.3% while multifamily was off by double digits. Forward-looking building permits rose in August, up 6.9% with gains across both single-family and multifamily segments. Compared to a year ago, housing starts were off 14.8% while building permits were 2.7% lower. Homebuilder confidence fell for a second month in September, retreating to its lowest level since April. The NAHB/Wells Fargo Housing Market Index (HMI) fell five points to 45 (signaling pessimism) with deterioration among all three major components – current single-family sales, sales expectations, and prospective buyer traffic.
The National Association of REALTORS® (NAR) reported existing home sales fell 0.7% in August to a SAAR of 4.04 million, a level down 15.3% Y/Y. Inventories dipped 0.9% resulting in a 3.3-month supply. The median home sale price was up 3.9% Y/Y.
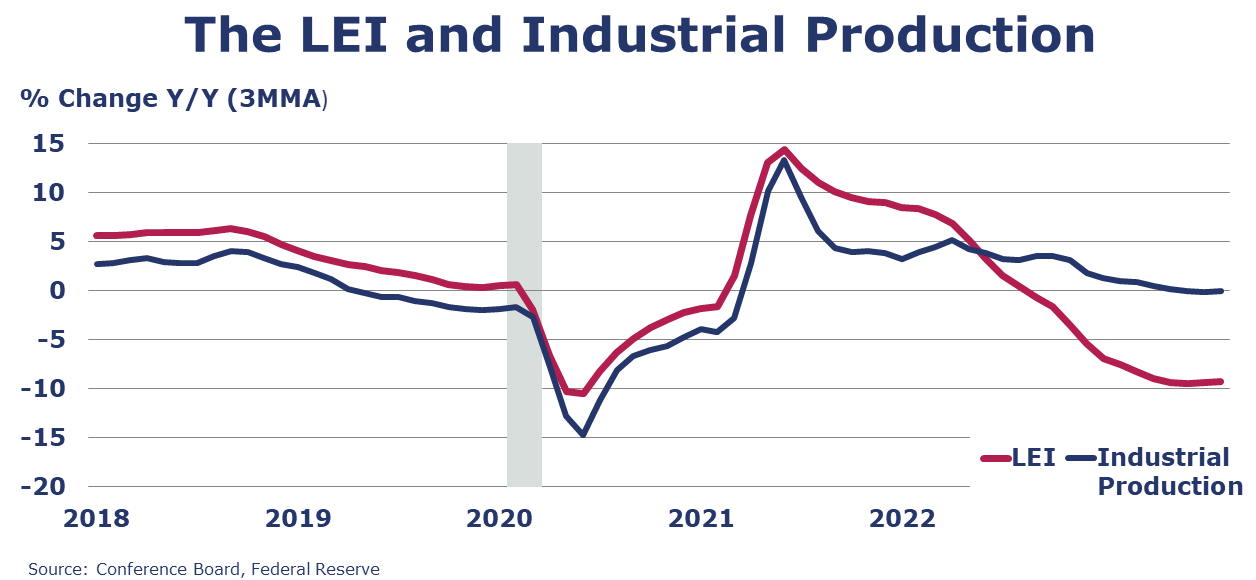
The Conference Board’s Leading Economic Index® (LEI) fell for a 17th consecutive month in August, down another 0.4%. The LEI continued to be negatively impacted by weak new orders, deteriorating consumer expectations, high interest rates, and tight credit conditions. The LEI was off 9.5% Y/Y. The Conference Board noted that “the economy is heading into a challenging growth period and possible recession over the next year.”
Survey of Economic Forecasters
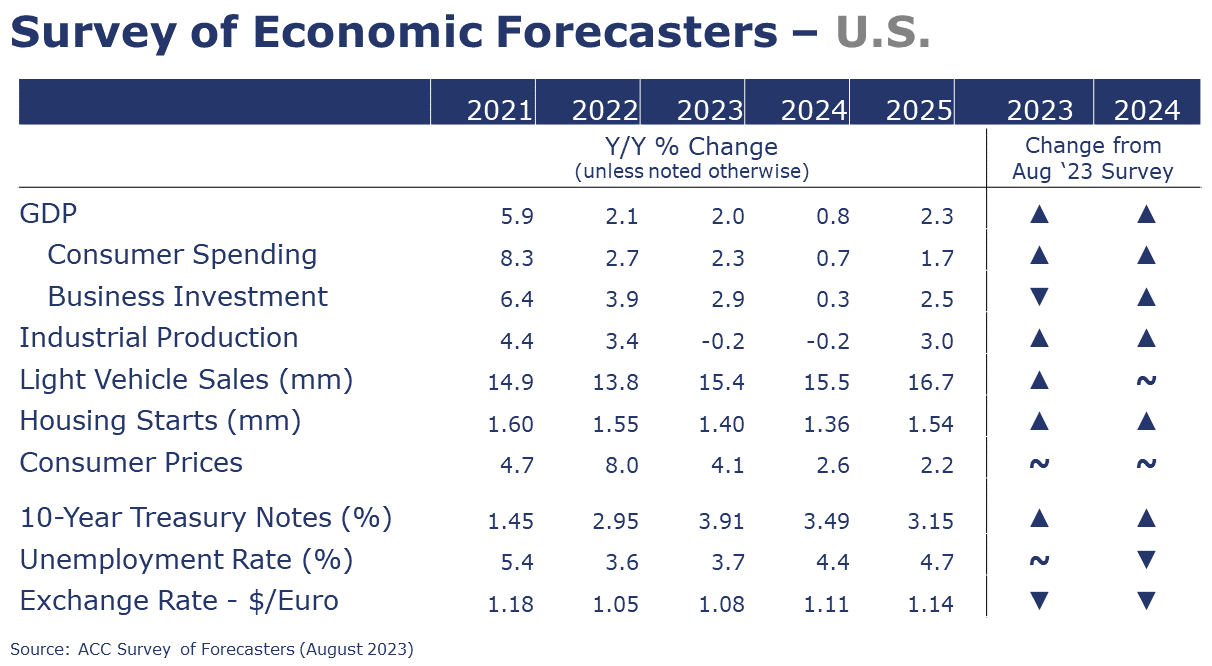
- The combination of easing inflation and cooling labor market over the past few months make us more optimistic for a “soft landing” scenario, but a short shallow recession in Q1 still seems an equally likely outcome.
- Compared to July, expectations for 2023 have improved for GDP, consumer spending, industrial production, housing starts and vehicle sales.
- U.S. GDP is expected to grow by 2.0% in 2023 and to weaken (+0.8%) in 2024.
- Consumer spending growth is expected to slow to a 2.3% Y/Y pace in 2023 (from 2.7% in 2022) and slow further to a 0.7% gain in 2024.
- Dampened by higher borrowing costs, growth in business investment is expected to decelerate to a 2.9% pace in 2023 before stalling in 2024.
- Industrial production is forecast to contract by 0.2% in both 2023 and 2024.
- Notwithstanding the UAW strike, U.S. vehicle production continues to be a relatively bright spot in an otherwise lackluster outlook. As a result, sales of autos and light trucks are expected to grow to 15.4 million in 2023 (still below trend) and 15.5 million in 2024.
- While it has struggled with high prices, labor costs, and mortgage rates, new homebuilding is finding some support from historically low inventories of existing homes. Housing starts are expected to come in at 1.40 million in 2023 before weakening to a 1.36 million pace in 2024.
- The unemployment rate is expected to move higher from 50-year lows to average 3.7% in 2023 and 4.4% in 2024.
- Recent data suggest inflation is slowing, though it has a way to go to get back to the Fed’s target. Growth in consumer prices is expected to decelerate to a 4.1% pace in 2023 and 2.6% in 2024 (down from 8.0% in 2022).
- Expectations for interest rates (10-year Treasury) were slightly higher for both 2023 and 2024.
ENERGY
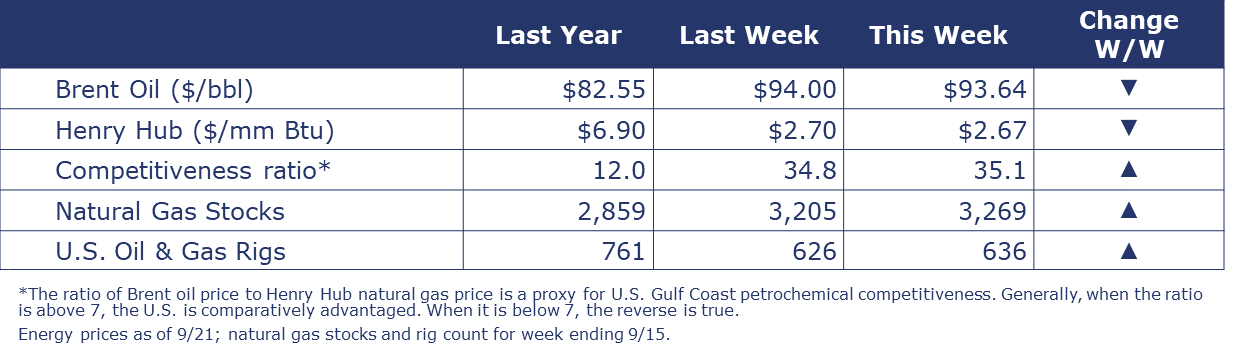
The most recent weekly data on oil and gas indicates moderation in both natural gas and oil prices. The oil to natural gas price ratio – a proxy for U.S. Gulf Coast petrochemical competitiveness rose from 34.8 to 35.1, an indication of a strong U.S. comparative advantage. Natural gas stocks rose slightly, and the combined oil and gas rig count rose by 10 to 636.
CHEMICALS
Indicators for the business of chemistry bring to mind a red banner.
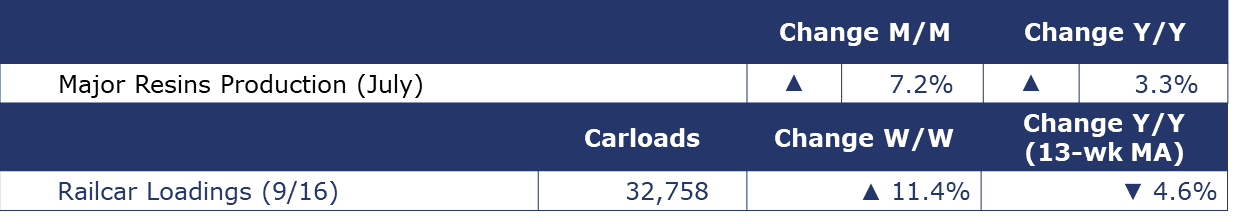
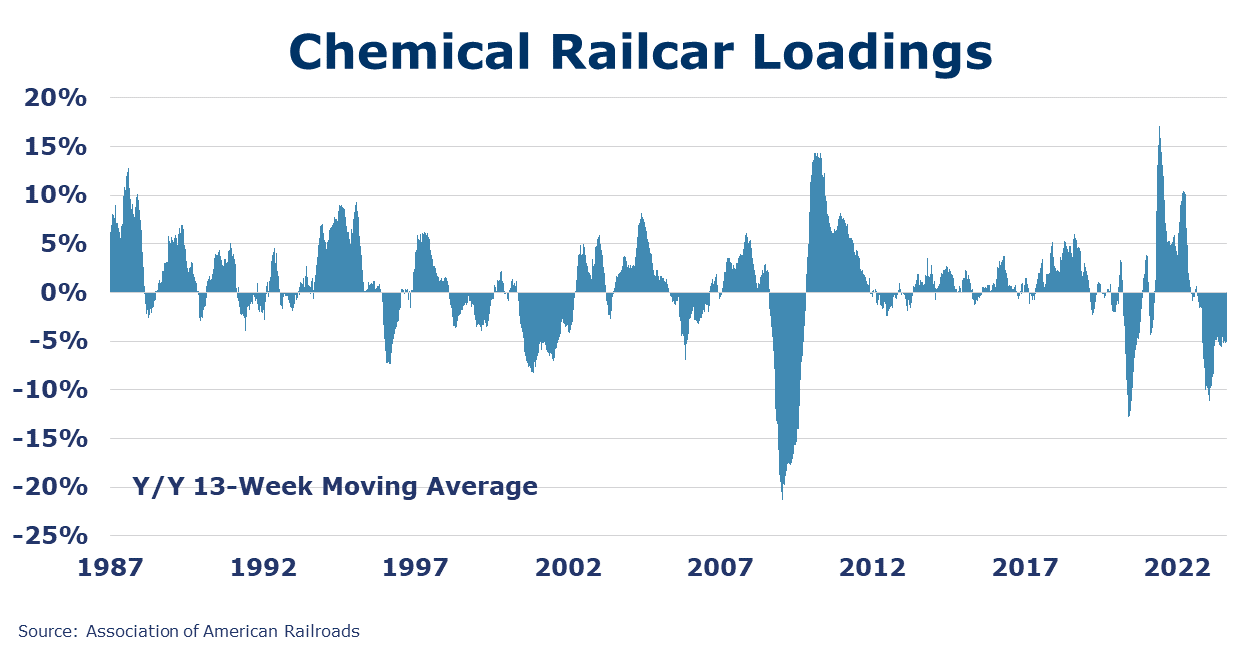
According to data released by the Association of American Railroads, chemical railcar loadings were up to 32,758 for the week ending September 16. Loadings were down 4.6% Y/Y (13-week MA), down 3.0% YTD/YTD and have been on the rise for 8 of the last 13 weeks.
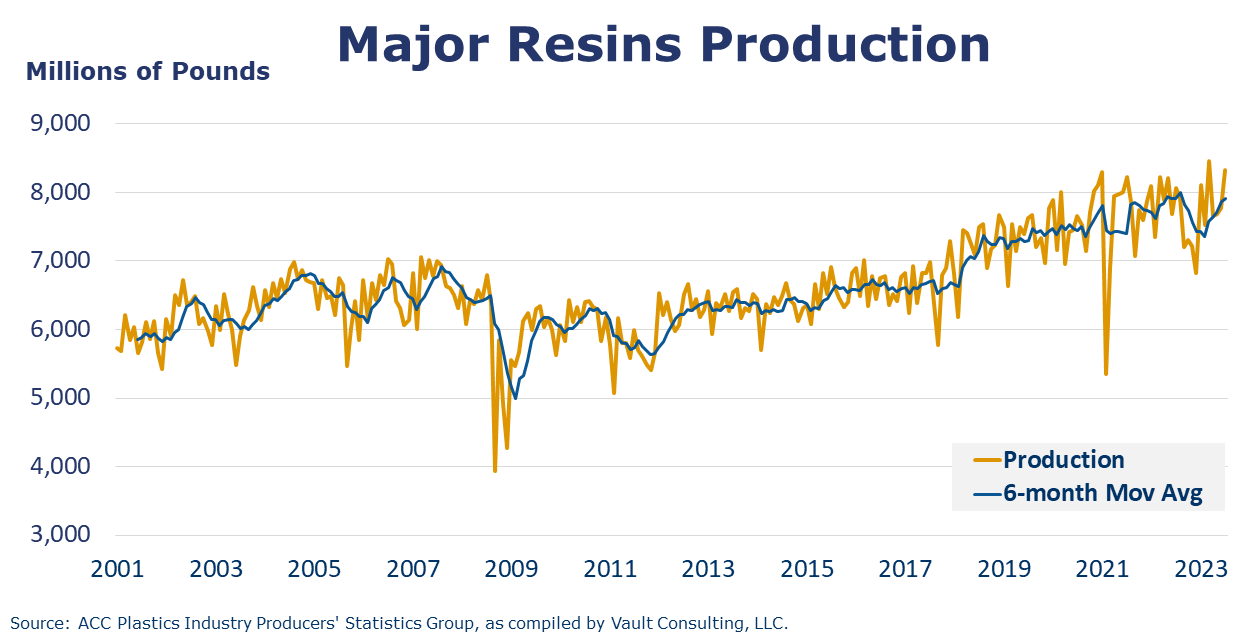
According to ACC statistics, U.S. production of major plastic resins totaled 8.3 billion pounds during July 2023, an increase of 7.2% compared to the prior month, and an increase of 3.3% compared to the same month in 2022. Year-to-date production was 55.6 billion pounds, flat as compared to the same period in 2022. Sales and captive (internal) use of major plastic resins totaled 8.1 billion pounds during July 2023, an increase of 0.9% compared to the prior month, and an increase of 8.8% from the same month one year earlier. Year-to-date sales and captive use were 54.5 billion pounds, flat as compared to the same period in 2022.
Note on Banner Colors
The banner colors represent observations about the current conditions in the overall economy and the business chemistry. For the overall economy we keep a running tab of 20 indicators. The banner color for the macroeconomic section is determined as follows:
Green – 13 or more positives
Yellow – between 8 and 12 positives
Red – 7 or fewer positives
For the chemical industry there are fewer indicators available. As a result, we rely upon judgment whether production in the industry (defined as chemicals excluding pharmaceuticals) has increased or decreased three consecutive months.
For More Information
ACC members can access additional data, economic analyses, presentations, outlooks, and weekly economic updates through ACCexchange.
In addition to this weekly report, ACC offers numerous other economic data that cover worldwide production, trade, shipments, inventories, price indices, energy, employment, investment, R&D, EH&S, financial performance measures, macroeconomic data, plus much more. To order, visit http://store.americanchemistry.com/.
Every effort has been made in the preparation of this weekly report to provide the best available information and analysis. However, neither the American Chemistry Council, nor any of its employees, agents or other assigns makes any warranty, expressed or implied, or assumes any liability or responsibility for any use, or the results of such use, of any information or data disclosed in this material.


