MACROECONOMY & END-USE MARKETS
Running tab of macro indicators: 13 out of 20
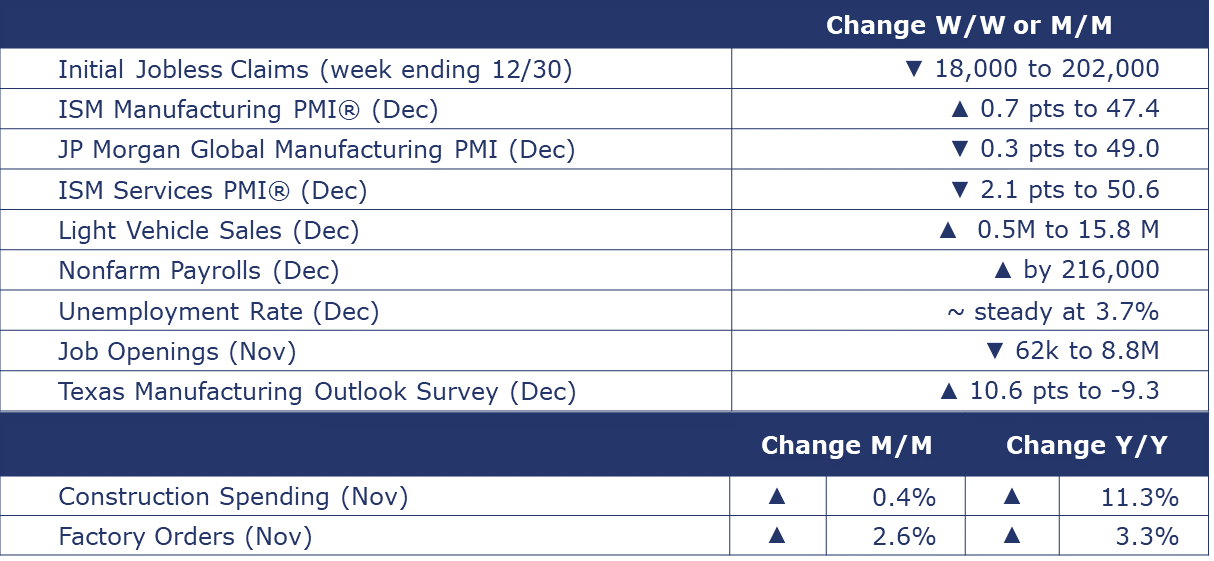
The number of new jobless claims fell by 18,000 to 202,000 during the week ending December 23. Continuing claims fell by 31,000 to 1.855 million, and the insured unemployment rate for the week ending December 30 was up 0.1 percentage point to 1.3%.
The monthly jobs report surprised to the upside…again. Nonfarm payrolls expanded by 216,000 in December, the fastest pace since September. Manufacturing employment rose by 6,000, giving 2023 the highest manufacturing employment count since 2008. There were also gains in construction, trade, and services. Employment in transportation and warehousing continued to slide. Average weekly hours dipped from 34.4 in November to 34.3 in December. Average hourly earnings for all workers rose by 4.1% Y/Y, a slight acceleration compared to a 4.0% Y/Y gain in November.
According to the separate household survey, the civilian labor force and the number of employed people fell in tandem. The unemployment rate remained steady at 3.7%. Labor force participation, which had been recovering during much of 2023, fell back to 62.5%. During times of transition, employment estimates between the household survey and the establishment survey (used to estimate nonfarm payrolls) can differ directionally.
The number of job openings was little changed at 8.8 million in November, a 32-month low. Both hires and separations (including quits) declined over the month. There were 1.4 job openings for each unemployed person. Over the past year, the trend in job openings, hires and quits data has been generally downward while the trend in layoffs and discharges has stabilized recently. The number of job openings per unemployed person has dropped from the prior 2.0 peak.
Economic activity in the services sector expanded for the 12th consecutive month in December, and it was the 42nd month to reflect growth over the past 43 months, according to the ISM Services PMI®. Of the 18 service industries tracked, half reported growth and half reported contraction. Overall, services activity (production) grew and at a faster pace. New orders grew but the pace is slowing. Services employment slipped from growth into contraction.
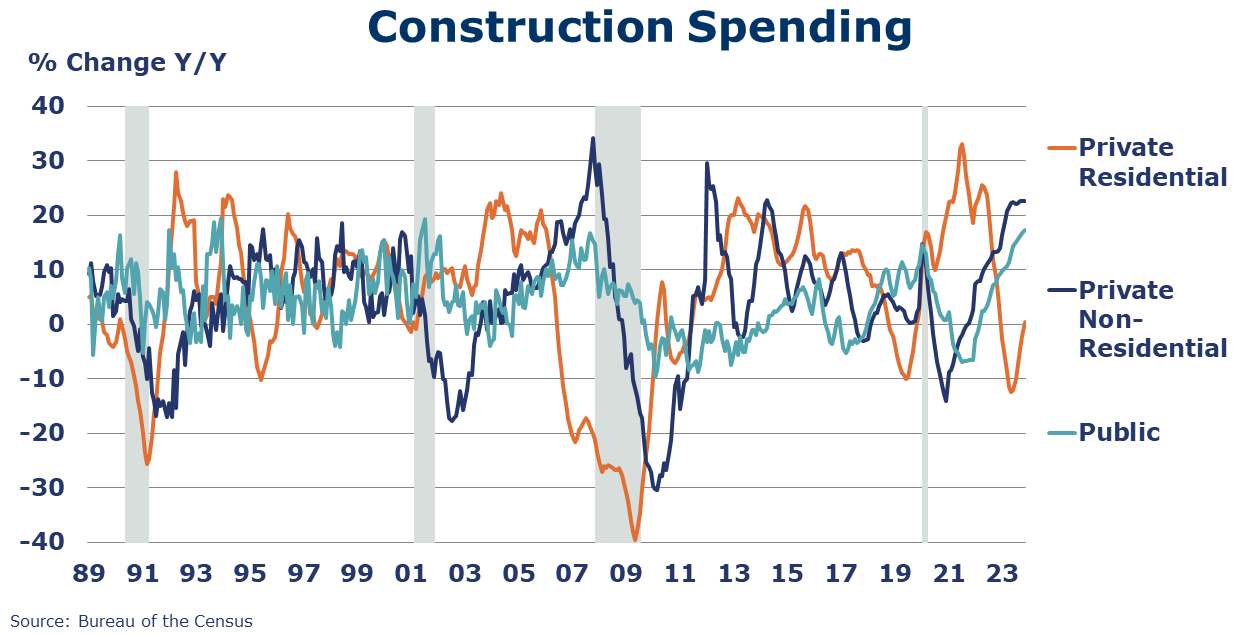
Construction spending rose 0.4% in November to a pace up 11.3% Y/Y. Private residential spending rose 1.1% M/M to a level up 3.7% Y/Y. The monthly advance was driven by a gain in single-family construction activity (multi-family was roughly flat). Led by ongoing investment in the computer/electronic/electrical category, spending on manufacturing construction projects was up 0.5% M/M to a level up 59.4% Y/Y.
Light vehicle sales moved up by 500,000 to a 15.8 million seasonally adjusted annual rate (SAAR) in December, with increases in both the passenger car and light truck (including SUVs and minivans) categories. The share of “light trucks” rose to a record 80.6% in December. The share has been steadily increasing for decades.
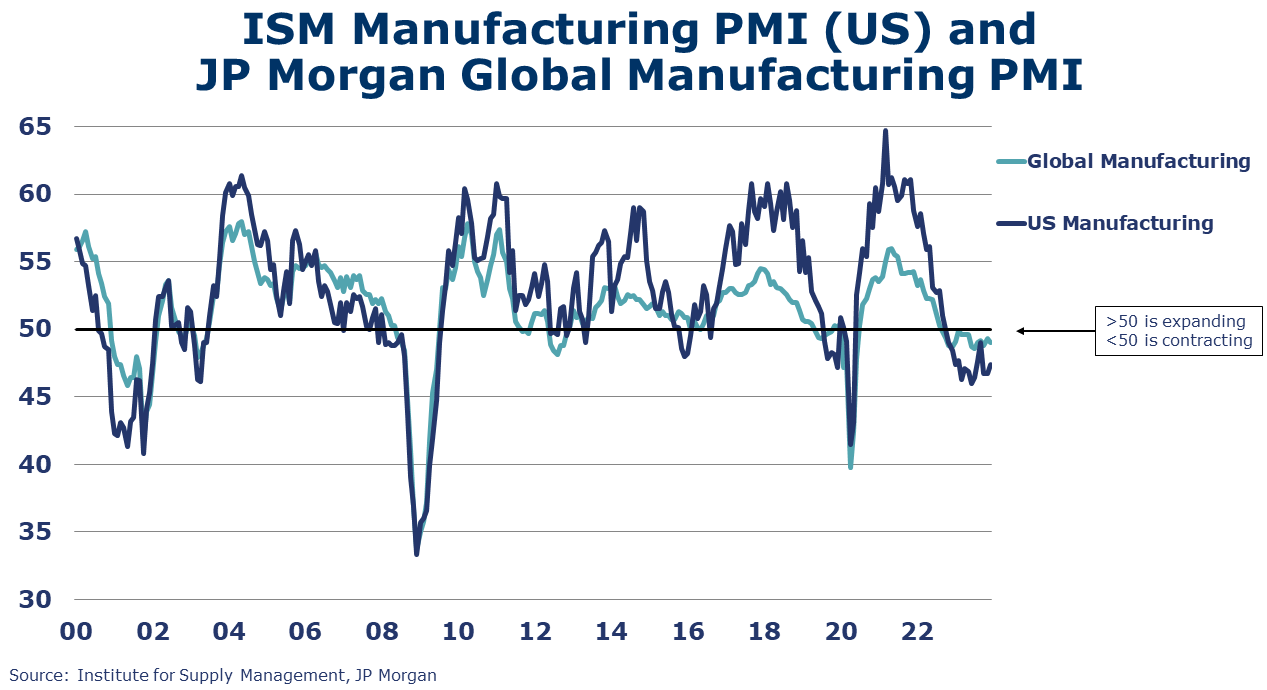
J.P. Morgan’s Global Manufacturing PMI® fell 0.3 points to 49.0 in December, indicating global manufacturing contracted and at a faster pace. The reading marked a 16th consecutive month of contraction. The readings for output, new orders and new export orders declined. Sentiment improved and growth is expected in future output. Employment contracted at a faster rate. Seven of 29 countries tracked saw expansion in output.
The ISM Manufacturing PMI® edged up to 47.4% in December. It was the 14th consecutive reading under the 50-mark, which indicates contraction in the U.S. industrial sector. Manufacturers are facing easing demand as new orders contract and export orders remain flat. Customers’ inventories were reported as “too low”, signaling possible future production. Only 1 of 17 manufacturing industries tracked – primary metals - reported growth in December.
Following a decline in October, factory orders rose 2.6% in November. Gains were strongest for computers and related products, motor vehicles & parts, and consumer durable goods. Orders for core business orders (nondefense capital goods excluding aircraft) rose by 0.8% and were up 1.5% Y/Y. Headline orders were up by 3.3% Y/Y. Unfilled orders, a measure of the manufacturing pipeline, jumped by 1.3%, a potential sign of recovery. Manufacturing shipments rose 0.5% and manufacturing inventories edged higher by 0.1%. The manufacturing inventories-to-shipments ratio remained stable at 1.48.
ENERGY
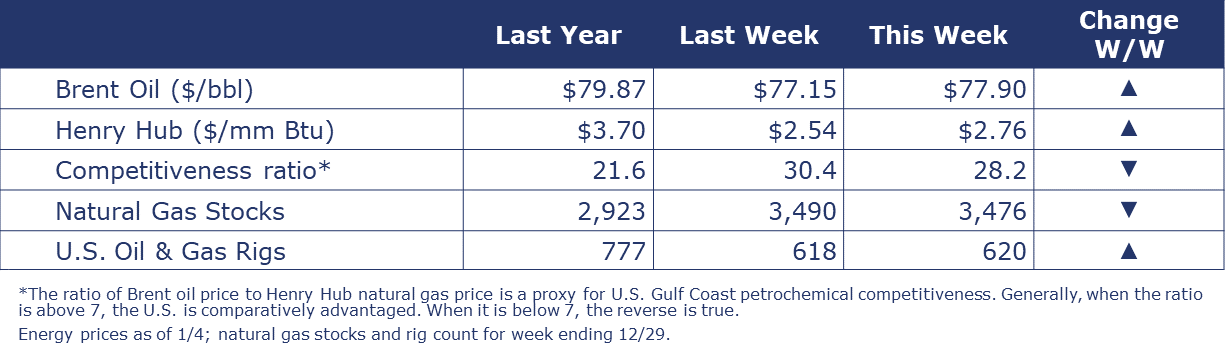
After sharp gains earlier in the week, oil prices steadied later in the week, as concerns over Middle Eastern supply and an oilfield shutdown in Libya were countered by concern about economic growth and demand. U.S. natural gas prices reached a one-month high due to forecasts for colder weather, as well as a drop in daily production. The combined oil and gas rig count was up slightly, to 620 from last week’s 618. Natural gas stocks were down slightly (by 14) W/W and up 19% compared to last year.
CHEMICALS
Indicators for the business of chemistry bring to mind a red banner.
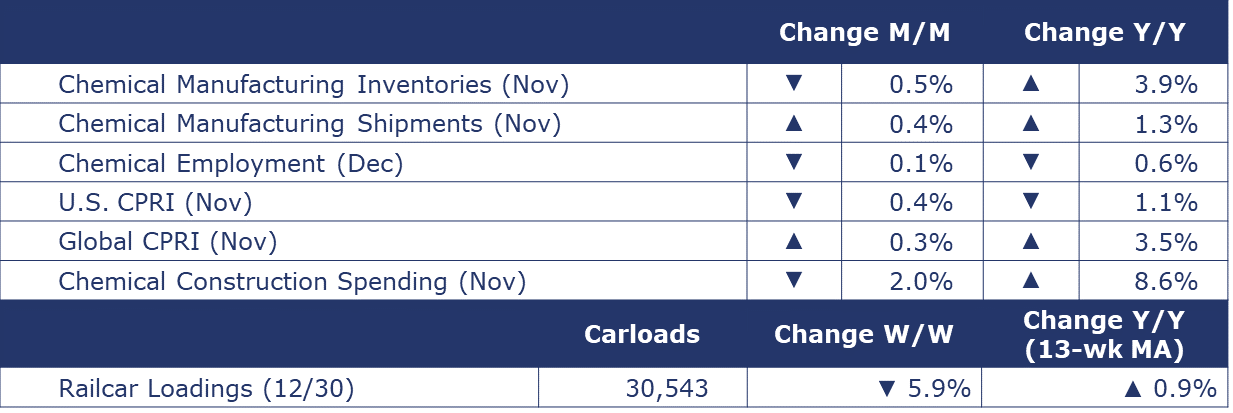
According to data released by the Association of American Railroads, chemical railcar loadings were down to 30,543 for the week ending December 30. Loadings were up 0.9% Y/Y (13-week MA), down (0.3%) YTD/YTD and have been on the rise for 6 of the last 13 weeks.
In the ISM Manufacturing PMI® report for December, most manufacturing industries (including chemicals) reported contraction. That said, according to a participant in the chemical industry, “Overall, order intake has picked up over the last quarter and a backlog of projects is beginning to accumulate.
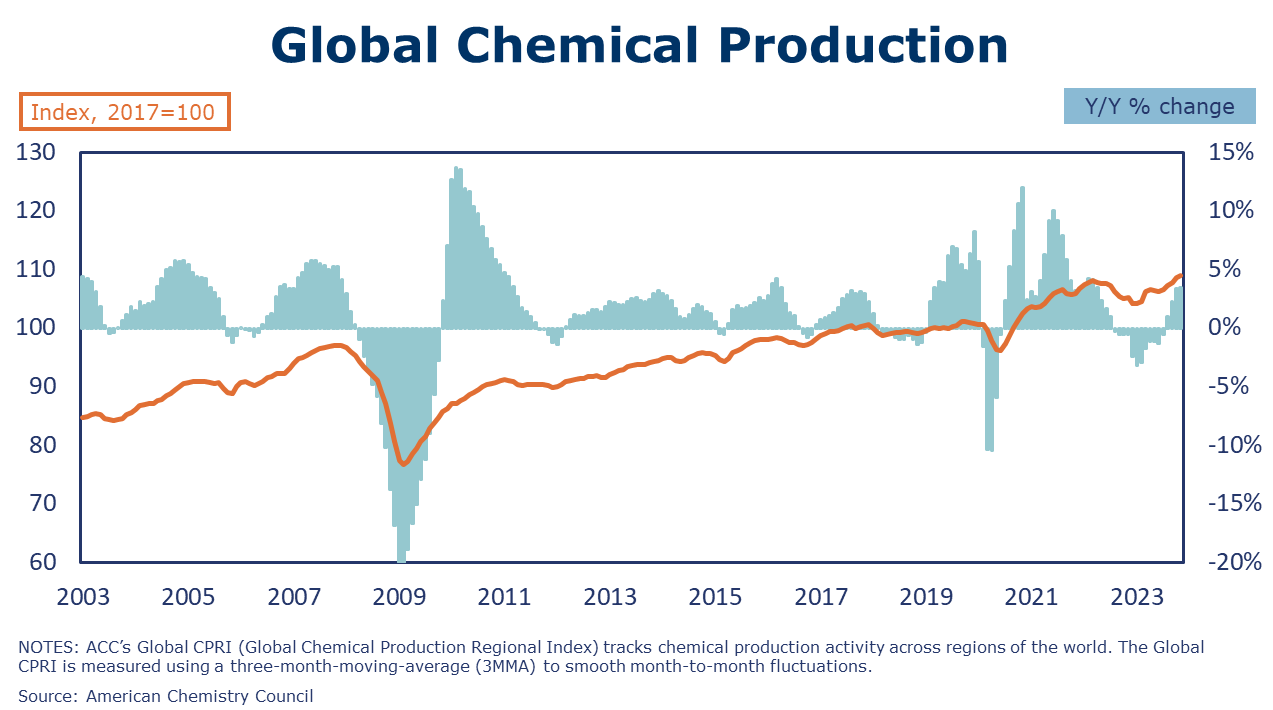
Following a 0.7% gain in October, the growth of ACC’s Global Chemical Production Regional Index (Global CPRI) slowed to 0.3%. Growth was mainly driven by Asia and the Former Soviet Union. Most significant increases were observed in China, Taiwan, Korea, Russia, Canada, and the UK. Global output was up in all segments. Global chemicals production growth was up 3.5% Y/Y.
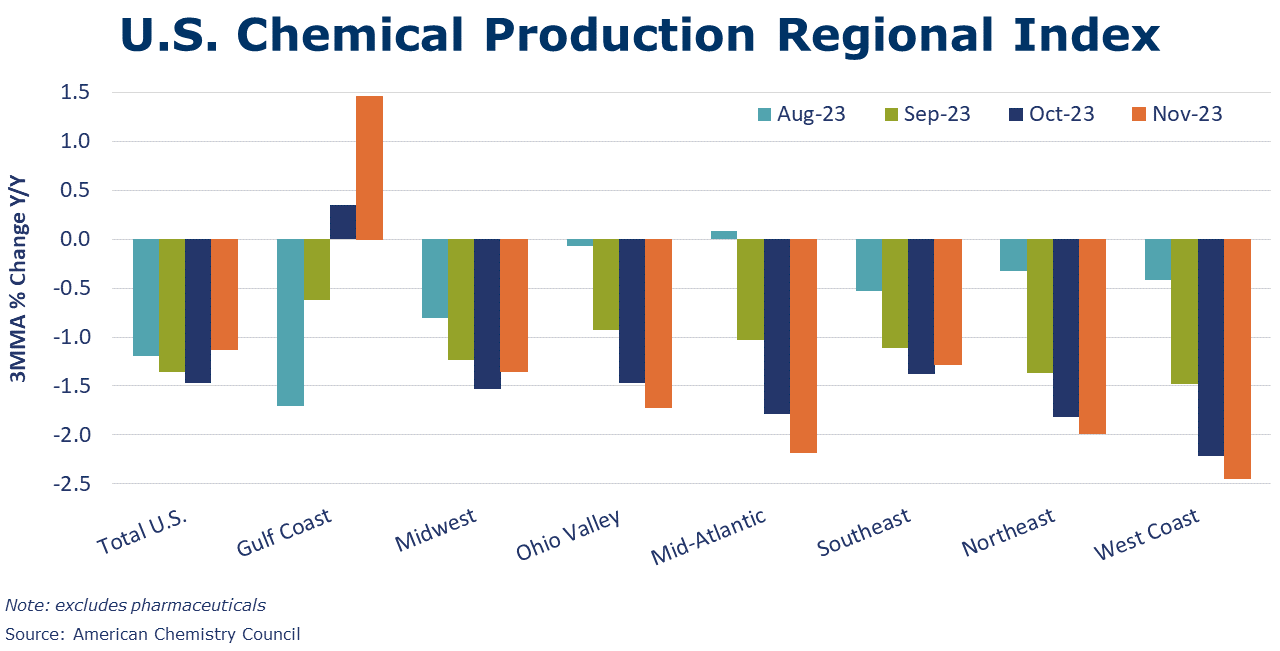
Following a downwardly revised 0.5% decline in October, ACC’s U.S. Chemical Production Regional Index (CPRI) fell 0.4% in November. Chemical production remained lower by 1.1% compared to a year ago, though in the Gulf Coast, production was higher than a year ago for a second month. In November, the 3MMA trend in chemical production was lower in all regions with the largest declines in the Ohio Valley and Mid-Atlantic.
Chemical shipments rose 0.4% in November to $53.1 billion, the second consecutive increase. Gains in shipments of agricultural and other chemicals offset a decline in shipments of coatings and adhesives. Chemical inventories fell 0.5% in November following a similar increase in October. Chemical inventories were lower across all major categories. Compared to a year ago, chemical inventories were up 3.9% Y/Y while sales were up 1.3% Y/Y. The inventories-to-shipments ratio eased from 1.23 in October to 1.22 in November.
Chemical and pharmaceutical industry employment continued to ease in December, down by 1,300 to 910,400, the lowest level since mid-2022. The decline came entirely from supervisory and nonproduction workers. Production worker employment was flat. Average hourly wages rose 8.8% Y/Y to $30.51, a slightly accelerated pace compared to October and November, but down from the 9-10% annual growth during the summer months. The average workweek expanded slightly from 41.3 hours in November to 41.4 hours in December. As a result, the labor input into the chemical industry edged higher in December, in contrast to the details of the ISM Manufacturing PMI® report that suggested the industry contracted in December.
Chemical industry construction spending declined by 2.0% in November (following an increase in October) to a pace up 8.6% Y/Y. Chemical industry spending represented about 17% of total manufacturing construction spending in November.
Note On the Color Codes
Banner colors reflect an assessment of the current conditions in the overall economy and the business chemistry of chemistry. For the overall economy we keep a running tab of 20 indicators. The banner color for the macroeconomic section is determined as follows:
Green – 13 or more positives
Yellow – between 8 and 12 positives
Red – 7 or fewer positives
There are fewer indicators available for the chemical industry. Our assessment on banner color largely relies upon how chemical industry production has changed over the most recent three months.
For More Information
ACC members can access additional data, economic analyses, presentations, outlooks, and weekly economic updates through ACCexchange.
In addition to this weekly report, ACC offers numerous other economic data that cover worldwide production, trade, shipments, inventories, price indices, energy, employment, investment, R&D, EH&S, financial performance measures, macroeconomic data, plus much more. To order, visit http://store.americanchemistry.com/.
Every effort has been made in the preparation of this weekly report to provide the best available information and analysis. However, neither the American Chemistry Council, nor any of its employees, agents or other assigns makes any warranty, expressed or implied, or assumes any liability or responsibility for any use, or the results of such use, of any information or data disclosed in this material.
Contact us at ACC_EconomicsDepartment@americanchemistry.com.


