MACROECONOMY & END-USE MARKETS
Running tab of macro indicators: 11 out of 20
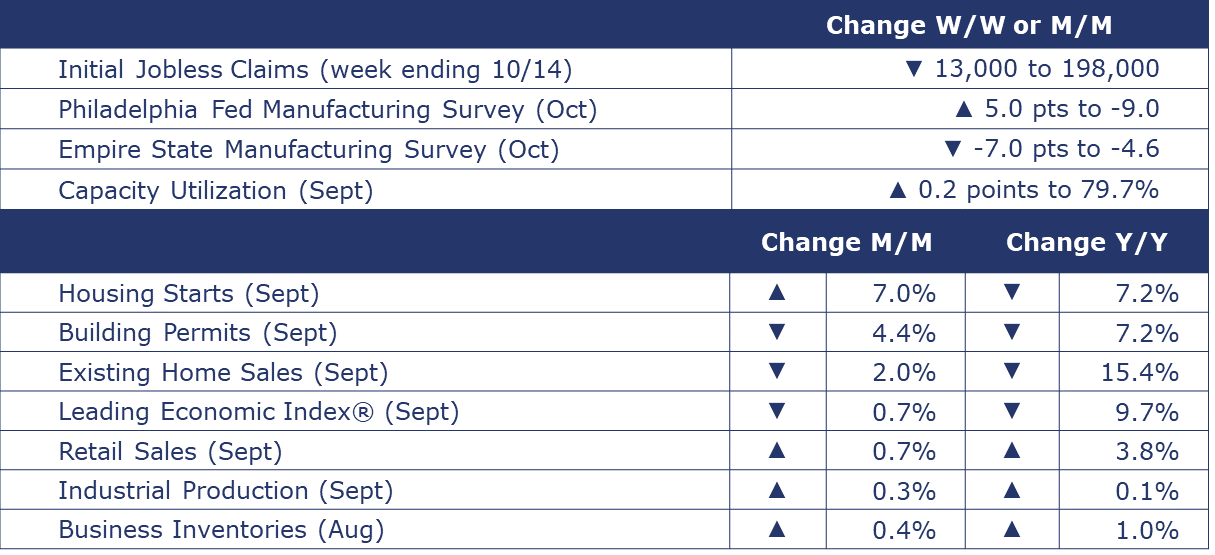
The number of new jobless claims fell by 13,000 to 198,000 during the week ending October 14. Continuing claims increased by 29,000 to 1.73 million, and the insured unemployment rate for the week ending October 7 was unchanged at 1.2%.
Retail sales rose 0.7% in September. The gain was led by strong spending in motor vehicles & parts, online retailers, bars & restaurants, food and beverage stores and clothing stores. Those gains were partially offset by lower sales of furniture & furnishings, electronics & appliances, sporting goods & bookstores, and supplies dealers. Retail sales were up 3.8% Y/Y, roughly the pace of inflation.
Combined trade sales and manufacturers’ shipments were $1,857.2 billion in August, up 1.3% compared to July and up 0.2% Y/Y. Combined business inventories were $2,548.7 billion, up 0.4% M/M and up 1.0% Y/Y for the same period. The business inventories-to-sales ratio was 1.37, up slightly from 1.36 for the same time last year.
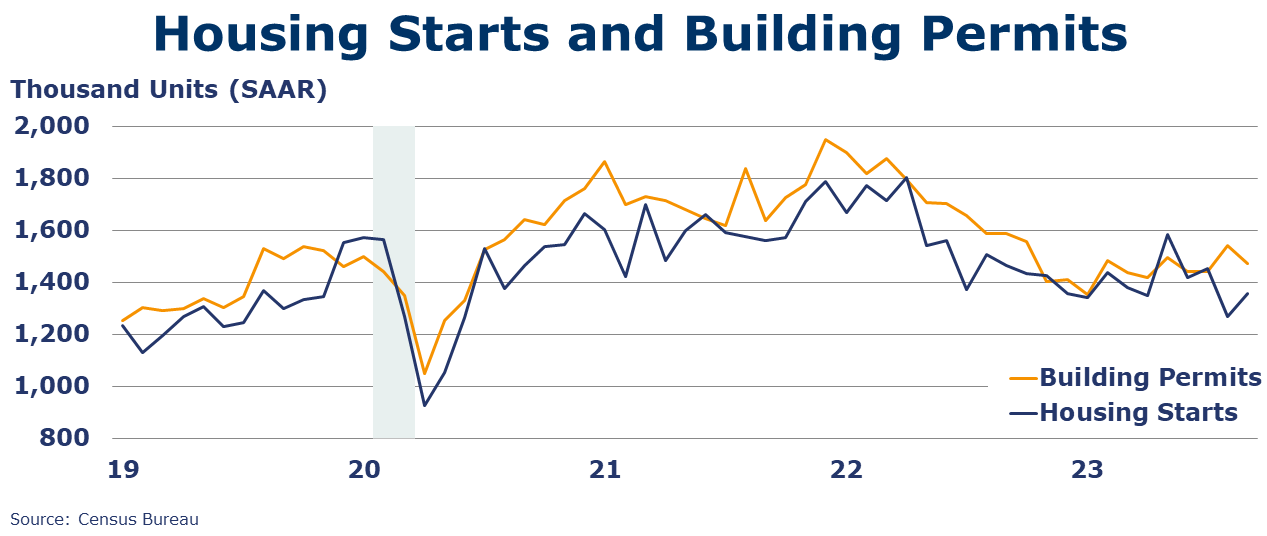
Following a decline in August, housing starts rose 7.0% in September with gains across all regions except the Northeast. Single-family starts were up 3.2% while forward-looking building permits were down 4.4%. Both housing starts and building permits were down 7.2% Y/Y. Higher mortgage rates and high home prices have priced many would-be homebuyers out of the market. On the other hand, ongoing lean inventories of existing homes continues to drive those that can afford it into the new build market. The National Association of REALTORS® (NAR) reported existing home sales fell 2.0% in September to a SAAR of 3.96 million, a level down 15.4% Y/Y. Inventories rose 2.7% resulting in a 3.4-month supply. The median home sale price was up 2.8% Y/Y. Higher mortgage rates continue to erode homebuilder confidence in the new build market. Homebuilder sentiment (NAHB/Wells Fargo) fell for a third consecutive month in October, down four points to 40, with deterioration in sales, sales expectations, and prospective buyer traffic.
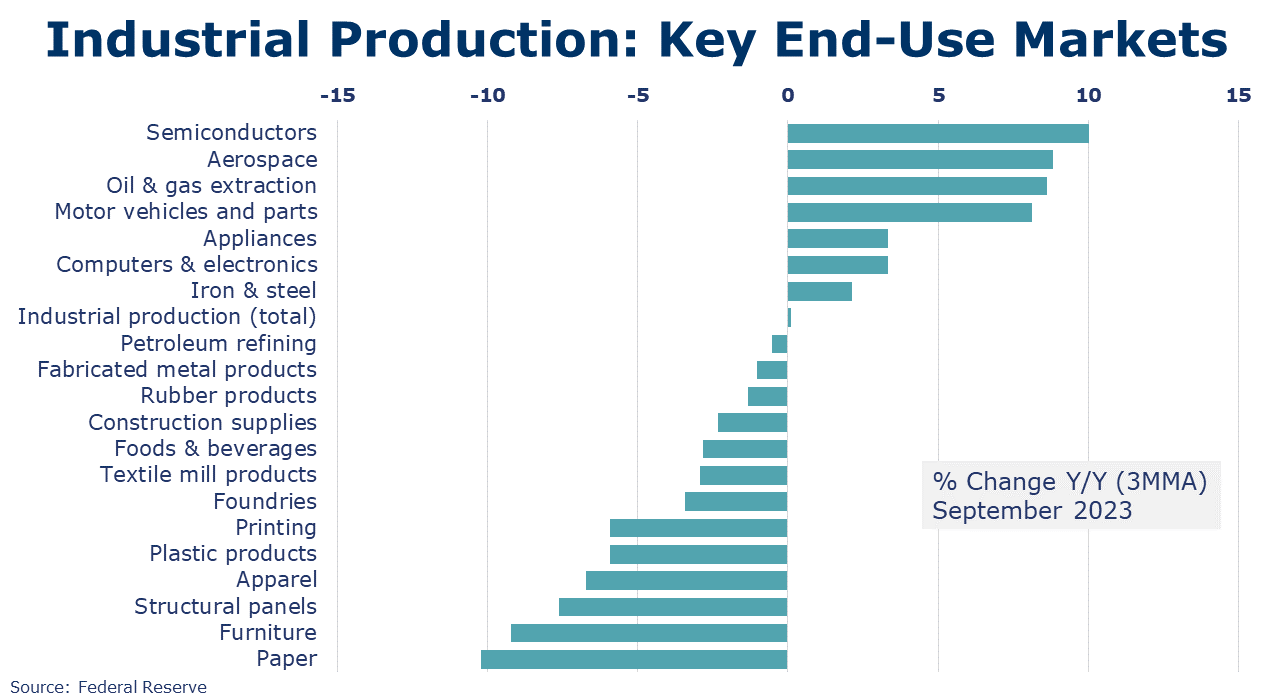
Following flat growth in August, overall industrial production rose 0.3% in September to a level up just 0.1% Y/Y. Manufacturing output expanded by 0.4% with the largest gains wood products, primary metals, and plastic & rubber products. The largest declines were in printing and apparel. Motor vehicle production rose in September, largely unaffected by the UAW strike that began in the middle of the month. Capacity utilization edged higher by 0.2 points to 79.7%, lower than a year ago (80.8%). Overall industrial capacity was 1.5% higher than a year ago.
The Conference Board’s Leading Economic Index® continued to weaken in September, down another 0.7% to 104.6. It marks a year and a half of consecutive declines and returns the index to levels last seen during the pandemic lockdowns. There were negative or flat contributions from nine of the index’s ten components. The Conference Board notes, “the US economy has shown considerable resilience despite pressures from rising interest rates and high inflation. Nonetheless, The Conference Board forecasts that this trend will not be sustained for much longer, and a shallow recession is likely in the first half of 2024.”
Fed Beige Book
A compilation of anecdotal information on the regional economies in the 12 districts, the Beige Book is published eight times per year. Interesting excerpts follow here:
- Most Districts indicated little to no change in economic activity since the September report.
- Consumer spending was mixed, especially among general retailers and auto dealers, due to differences in prices and product offerings.
- Tourism activity continued to improve, although some Districts reported slight slowing in consumer travel, and a few Districts noted an uptick in business travel.
- Banking contacts reported slight to modest declines in loan demand.
- Consumer credit quality was generally described as stable or healthy, with delinquency rates still historically low but slightly increasing.
- Real estate conditions were little changed and the inventory of homes for sale remained low.
- Manufacturing activity was mixed, although contacts across multiple Districts noted an improving outlook for the sector.
- The near-term outlook for the economy was generally described as stable or having slightly weaker growth.
- Expectations of firms for which the holiday shopping season is an important driver of sales were mixed.
Survey of Economic Forecasters
- The combination of easing inflation and cooling labor market over the past few months continues to make us more optimistic for a “soft landing” scenario, but a short shallow recession starting in Q1 still seems an equally likely outcome.
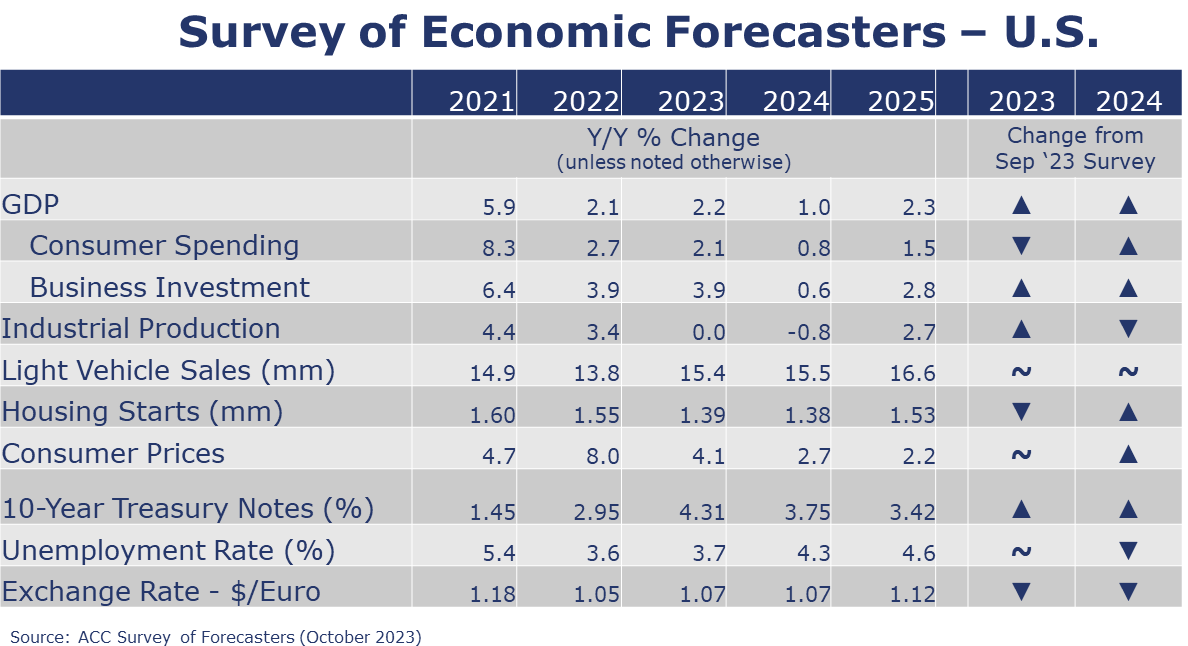
- Compared to last month, our expectations for 2023 continue to improve for GDP, and industrial production. Expectations for consumer spending, and housing starts have deteriorated.
- U.S. GDP is expected to grow by 2.2% in 2023 and by 1.0% in 2024.
- Consumer spending growth is expected to slow to a 2.1% Y/Y pace in 2023 (from 2.7% in 2022) and slow further to a 0.8% gain in 2024.
- Dampened by higher borrowing costs, growth in business investment is also expected to decelerate to a 3.9% pace in 2023 before slowing to a 0.6% gain in 2024.
- We look for industrial production to be flat this year before falling by 0.8% in 2024.
- Notwithstanding the UAW strike, U.S. vehicle production continues to be a relatively bright spot in an otherwise lackluster outlook. As a result, sales of autos and light trucks are expected to grow to 15.4 million in 2023 (still below trend) and 15.5 million in 2024.
- While it has struggled with high prices, labor costs, and mortgage rates, new homebuilding is finding some support from historically low inventories of existing homes. Housing starts are expected to come in at 1.39 million in 2023 before easing slightly to a 1.38 million pace in 2024.
- The unemployment rate is expected to move higher from 50-year lows to average 3.7% in 2023 and 4.3% in 2024
- Recent data suggests that inflation is slowing, though it has a way to go to get back to the Fed’s target. Growth in consumer prices is expected to decelerate to a 4.1% pace in 2023 and 2.7% in 2024 (down from 8.0% in 2022).
- Expectations for interest rates (10-year Treasury) were higher for both 2023 and 2024, reflecting the expectation that interest rates will be “higher for longer”.
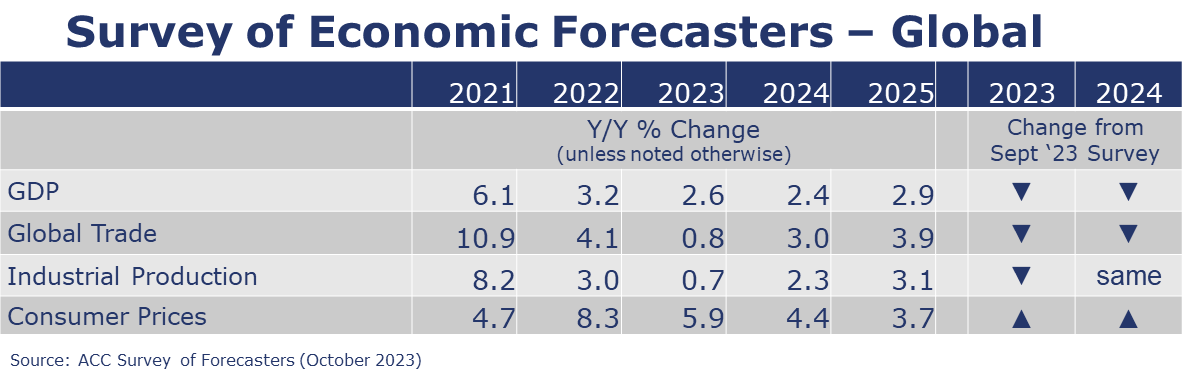
- Global GDP growth forecasts for 2023 and 2024 were revised downward. Global activity is now projected to expand 2.6% this year (2023) and to slow further to a 2.4% pace in 2024.
- Inflation forecasts for this year and next ticked up. Global inflation is forecast to grow at a 5.9% pace this year and moderate to a 4.4% pace in 2024.
- Reflecting slower than previously expected trade volume growth in North America and Asia, especially, the global trade growth forecast was notably revised down to 0.8% for 2023. Global trade is forecast to improve to a 3.0% pace in 2024.
- The industrial sector is forecast to expand by 0.7% this year and pick up some steam, growing by 2.3% in 2024.
ENERGY

Oil prices were higher this week with escalating tensions in the Middle East. Natural gas prices eased a bit compared to a week ago, with solid inventories going into the winter heating season. The combined oil and gas rig count rose by three to 618 during the week ending 10/16.
CHEMICALS
Indicators for the business of chemistry bring to mind a yellow banner.
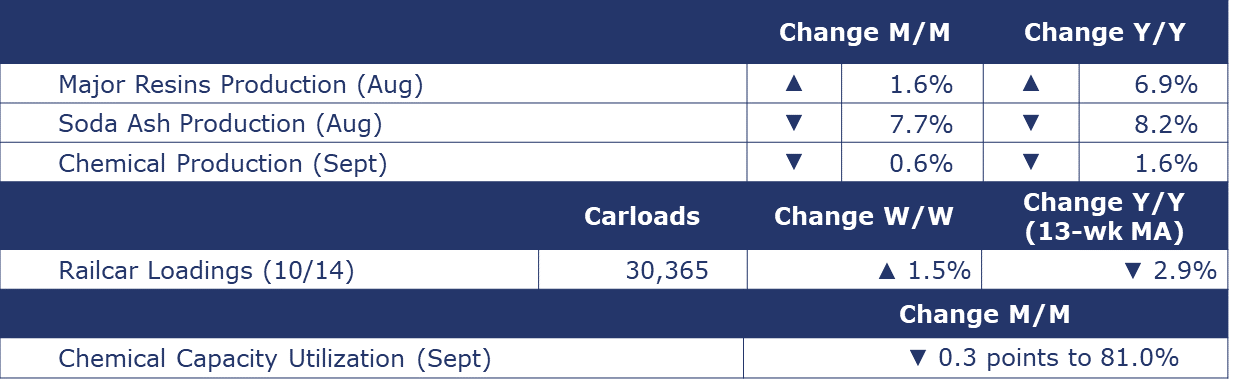
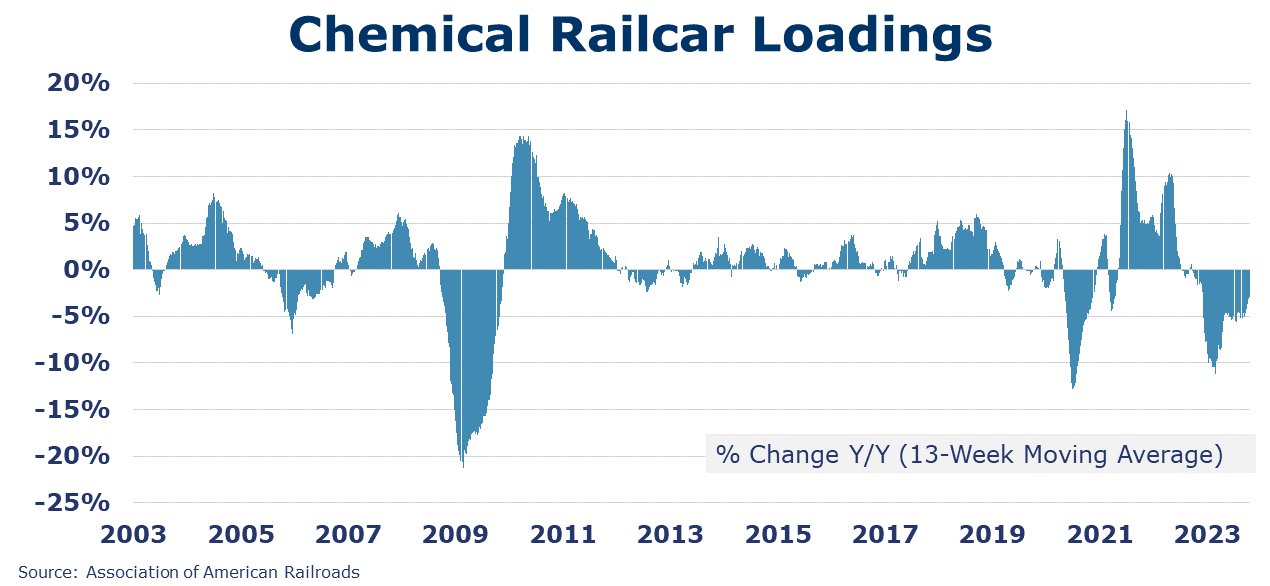
According to data released by the Association of American Railroads, chemical railcar loadings were up to 30,365 for the week ending October 14th. Loadings were down 2.9% Y/Y (13-week MA), down (-2.3%) YTD/YTD and have been on the rise for 7 of the last 13 weeks.
Among the comments in the Fed Beige Book specific to chemicals, one respondent told the Atlanta Fed, “Surplus chemical product supplies from China and Europe lowered demand for U.S. products. Further chemical product demand erosion is a potential risk resulting from a protracted auto manufacturing shutdown.” Another respondent to the Kansas City Fed noted, “Chemical production improved amid stabilizing demand. However, much uncertainty persists, and manufacturers' perceptions of broader business conditions worsened overall.”
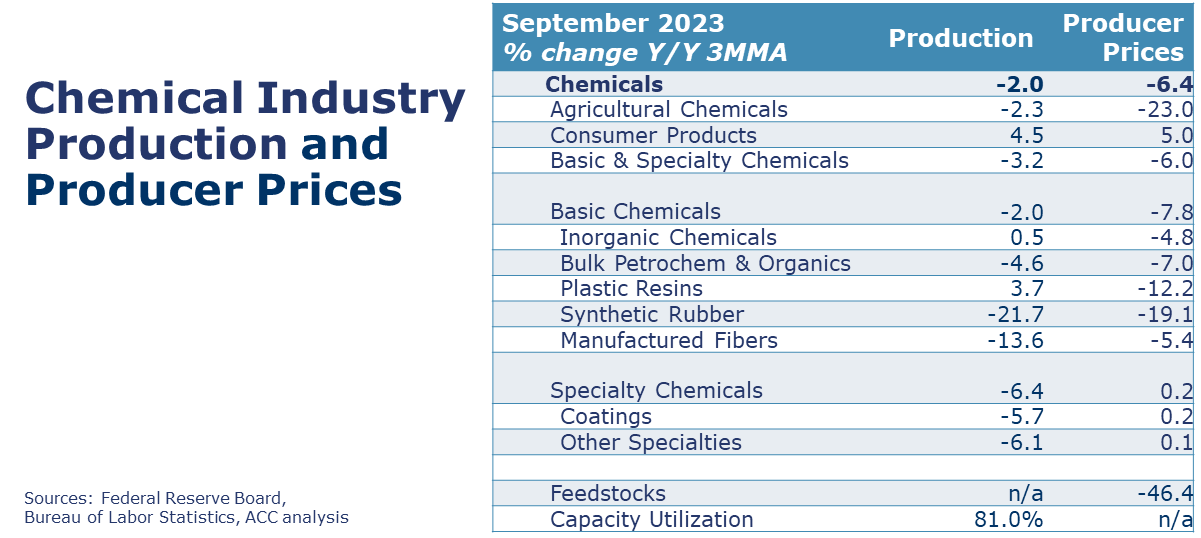
Following a 1.0% gain in August, chemical production retreated in September, down 0.6%. Gains in the output of organic chemicals and other specialty chemicals were offset by lower production of inorganic chemicals, plastic resins, synthetic rubber, manufactured fibers, coatings, fertilizers, crop protection chemicals, and consumer products. Chemical capacity utilization eased from 81.3% in August to 81.0% in September. A year ago, chemical capacity utilization was 80.5%.
The U.S. Geological Survey reported that monthly production of soda ash in August was 869 thousand tons, down 7.7% compared to the previous month and down 8.2% Y/Y. Stocks fell 15.2% over July to 312 thousand tons at the end of the month, an 11-day supply. Ending stocks were up 31.6% Y/Y.
U.S. production of major plastic resins totaled 8.5 billion pounds during August 2023, up 1.6% M/M, and up 6.9% Y/Y, according to ACC statistics. Year-to-date production was 64.1 billion pounds up 0.9% YTD/YTD. Sales and captive (internal) use of major plastic resins totaled 8.6 billion pounds, up 6.8% M/M and up 7.3% Y/Y. Year-to-date sales and captive use were 63.1 billion pounds, up 0.9% Y/Y.
Note On the Color Codes
The banner colors represent observations about the current conditions in the overall economy and the business chemistry. For the overall economy we keep a running tab of 20 indicators. The banner color for the macroeconomic section is determined as follows:
Green – 13 or more positives
Yellow – between 8 and 12 positives
Red – 7 or fewer positives
For the chemical industry there are fewer indicators available. As a result, we rely upon judgment whether production in the industry (defined as chemicals excluding pharmaceuticals) has increased or decreased three consecutive months.
For More Information
ACC members can access additional data, economic analyses, presentations, outlooks, and weekly economic updates through ACCexchange.
In addition to this weekly report, ACC offers numerous other economic data that cover worldwide production, trade, shipments, inventories, price indices, energy, employment, investment, R&D, EH&S, financial performance measures, macroeconomic data, plus much more. To order, visit http://store.americanchemistry.com/.
Every effort has been made in the preparation of this weekly report to provide the best available information and analysis. However, neither the American Chemistry Council, nor any of its employees, agents or other assigns makes any warranty, expressed or implied, or assumes any liability or responsibility for any use, or the results of such use, of any information or data disclosed in this material.
Contact us at ACC_EconomicsDepartment@americanchemistry.com.


