MACROECONOMY & END-USE MARKETS
Running tab of macro indicators: 12 out of 20
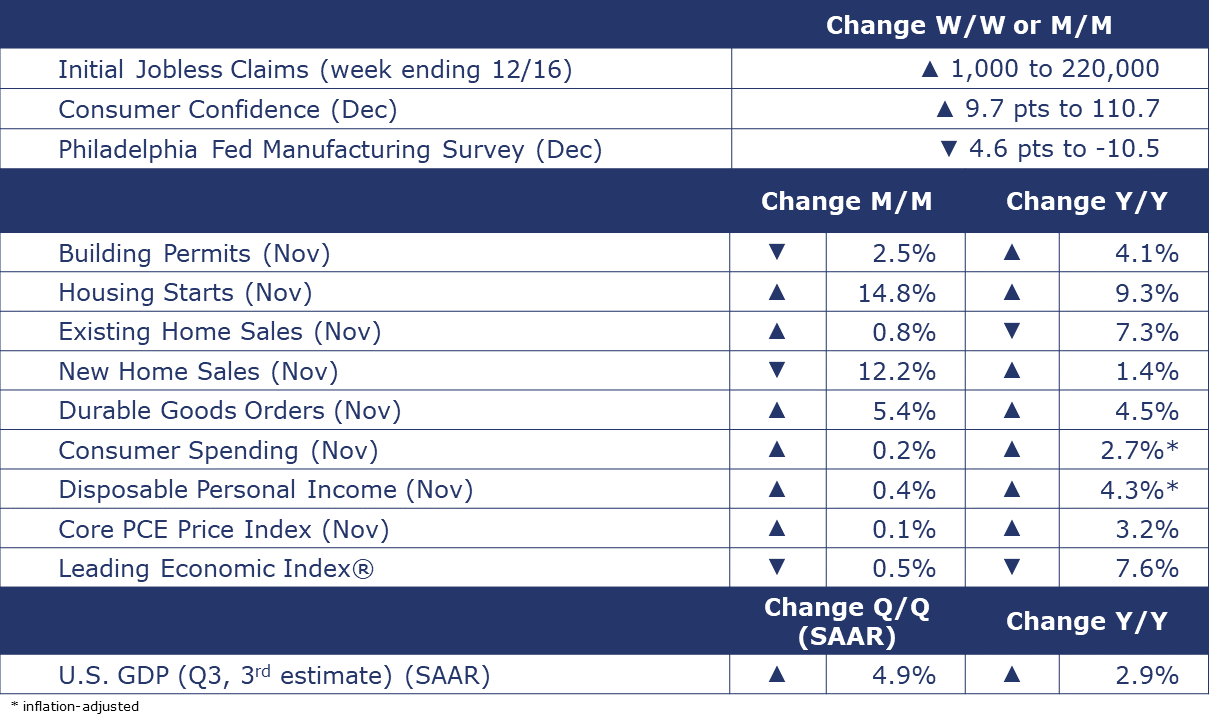
The number of new jobless claims rose by 1,000 to 220,000 during the week ending 16 December. Continuing claims fell by 1,000 to 1.865 million, and the insured unemployment rate for the week ending 9 December was unchanged at 1.3%.
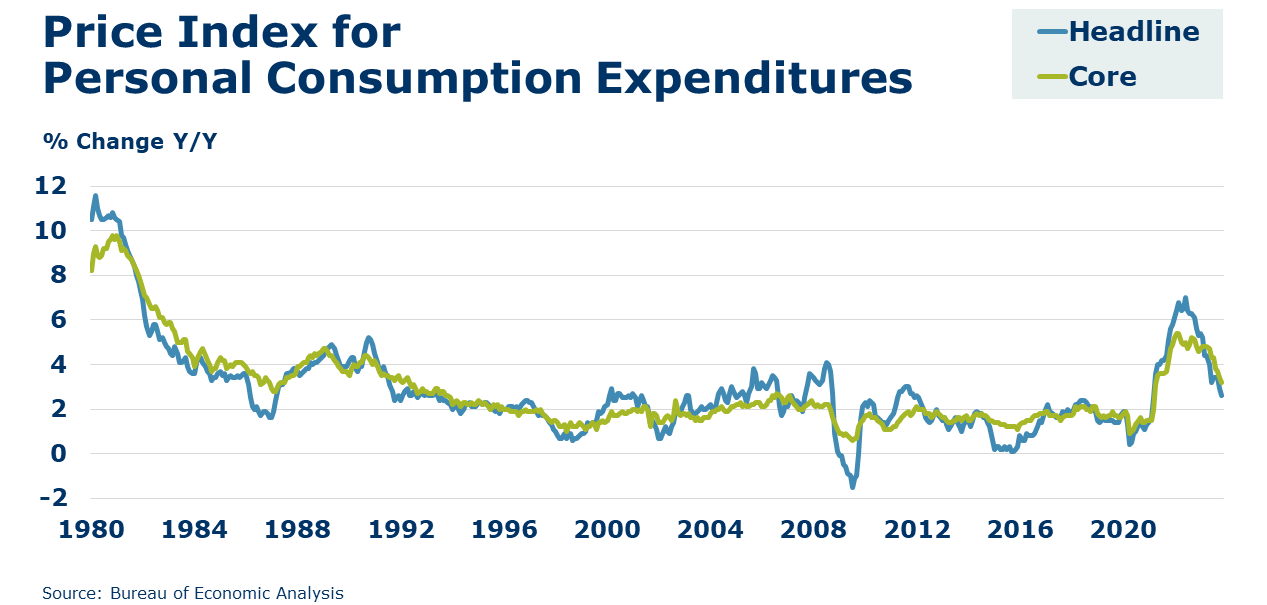
Consumer spending continued to advance in November, up by 0.2%. The gain follows a modest 0.1% increase in October. The pace of consumer spending has slowed considerably since the third quarter as consumers contend with higher prices (though growth has slowed) and higher borrowing costs. A tranche of consumers also began repaying student loans that were in forbearance during the pandemic. Spending on goods, which had rebounded slightly during the frothy Q3 continued to decline in November while spending on services continued to rise (in part reflecting higher wages). In November, personal income rose by 0.4% largely reflecting gains in wages and other compensation. Compared to a year ago, personal income was 4.3% higher while consumer spending was up 2.7% Y/Y. Annual growth in the headline PCE price index eased to 2.6% while the closely watched core PCE price index eased from 3.4% in October to 3.2% in November. Still ahead of the Fed’s 2% target but moving in the right direction.
Durable goods orders rose 5.4% in November and were 4.5% higher Y/Y. Month-to-month, headline orders have been choppy, but core business orders (nondefense capital goods excluding aircraft) have been more predictable, rising or falling less than 1% monthly for the past year. Core business orders rose 0.8% in November and were up 1.7% Y/Y. New orders for motor vehicles and parts rose 2.1% in November and were up 5.1% Y/Y.
The Conference Board’s consumer confidence index® ended the year on a positive note, up 9.7 points to 110.7 in December to a five-month high. The gain reflects improved assessment of current business conditions and job availability, as well as less pessimistic views of business, labor market and income prospects over the next six months. Consumers’ assessment of the “perceived likelihood of a US recession over the next 12 months” eased to the lowest level in 2023, though it remains elevated.
Lower mortgage rates have brought back some buyers who were sitting on the sidelines. The National Association of Realtors reported existing home sales edged up 0.8% in November to a SAAR of 3.82 million, a level down 7.3% Y/Y. Inventories slid 1.7% from October, but were 0.9% higher than a year ago, resulting in a 3.5-month supply. The median price was up 4.0% Y/Y.
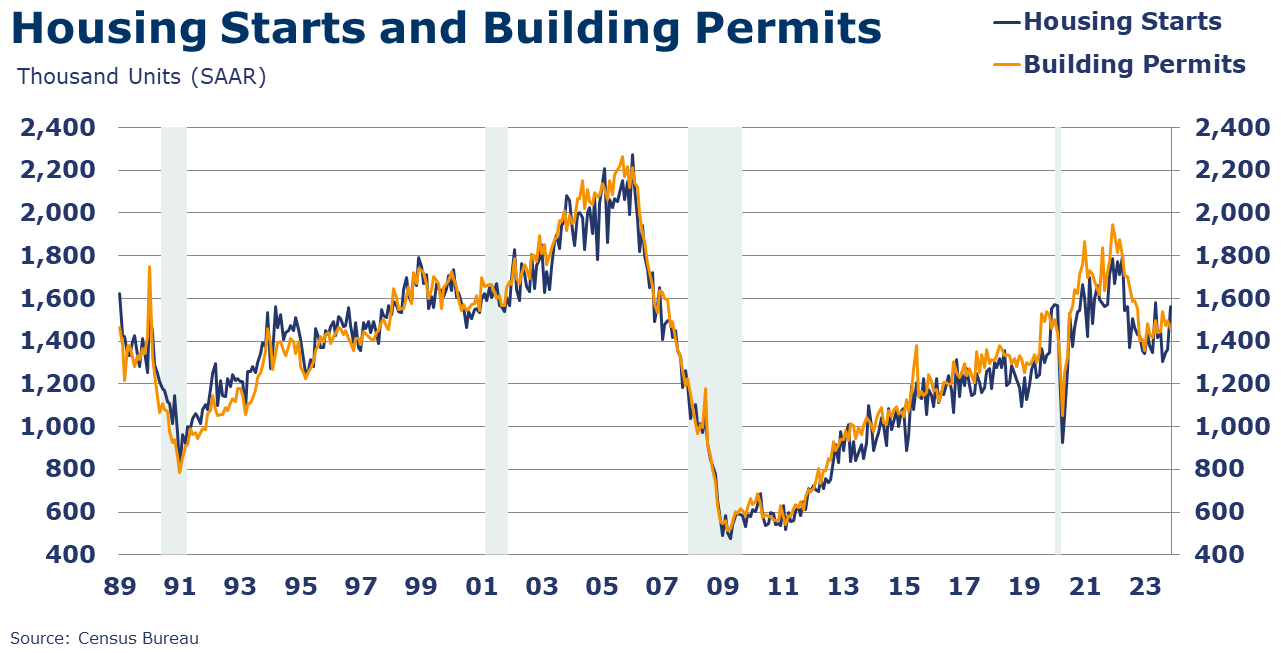
Housing starts rose 14.8% in November with gains across all regions. Chemistry-intensive single-family starts were up 18.0% while multi-family starts gained 8.9%. Even though forward-looking building permits were down 2.5%, both housing starts and building permits were up from year ago levels. Separately, the NAHB/Wells Fargo homebuilder confidence index rose in December up 3 points to 37. While an improvement, it was the fourth consecutive month below 50, indicating an unfavorable outlook on home sales.
New home sales fell 12.2% in November to a SAAR of 590,000 (a level up 1.4% Y/Y). The monthly decline largely reflects a 20.9% drop in the South. At the end of the month, the inventory of new homes for sale rose, pushing the months’ supply ratio up to 9.2 (the highest comparison so far in 2023 but lower than a year earlier when the months’ supply was 9.4).
As expected the Conference Board’s Leading Economic Index® fell for a 20th consecutive month in November, down another 0.5%. The index was off 7.6% from a year ago. Equity prices were essentially the only positive contribution to the index. The Conference Board notes that indicators for housing and labor market conditions weakened in November. New manufacturing orders stalled, suggesting a lack of economic growth momentum heading into the end of the year. The Conference Board continues to forecast a short and shallow recession in the first half of 2024.
The Bureau of Economic Analysis downwardly revised its third and final estimate of Q3 U.S. GDP to a 4.9% SAAR. Including more complete source data, the revisions reflect downward revisions to consumer spending, private inventory investment, and exports which were partly offset by upward revisions to state and local government spending, nonresidential fixed investment, residential fixed investment, and federal government spending. Imports were revised down. Despite the downward revisions, growth in Q3 GDP was the highest pace since Q1 2021, when the U.S. economy was pulling out of the pandemic.
ENERGY
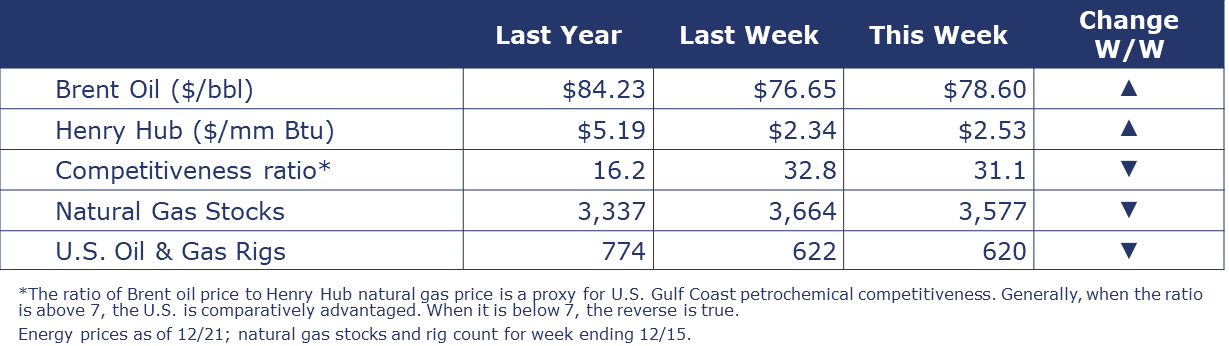
Oil prices were higher than a week ago as markets assess the impact of Red Sea shipping disruptions due to increased attacks by Houthi rebel groups. Around 12% of global seaborne oil trade and 8% of global LNG moves through the Red Sea. U.S. natural gas prices were also higher on a colder January forecast and a larger-than-expected withdrawal last week. Angola announced it would leave the OPEC cartel following a long-running dispute regarding oil production quotas. Angola produces around 1.1 M bpd, around 4% of total OPEC production. Following four weeks of consecutive gains, the combined oil and gas rig count fell by two to 620.
CHEMICALS
Indicators for the business of chemistry bring to mind a red banner.

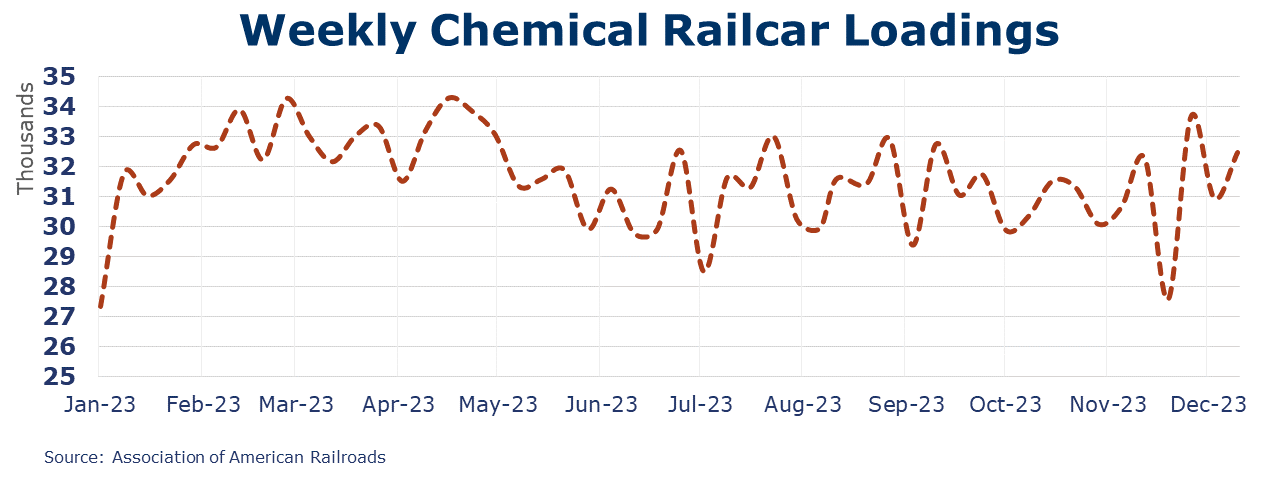
According to data released by the Association of American Railroads, chemical railcar loadings were up to 32,483 for the week ending December 16. That was the second highest level since mid-September. Loadings remained off 0.1% Y/Y (13-week MA), down 1.2% YTD/YTD and have been on the rise for 7 of the last 13 weeks.
For More Information
ACC members can access additional data, economic analyses, presentations, outlooks, and weekly economic updates through ACCexchange.
In addition to this weekly report, ACC offers numerous other economic data that cover worldwide production, trade, shipments, inventories, price indices, energy, employment, investment, R&D, EH&S, financial performance measures, macroeconomic data, plus much more. To order, visit http://store.americanchemistry.com/.
Every effort has been made in the preparation of this weekly report to provide the best available information and analysis. However, neither the American Chemistry Council, nor any of its employees, agents or other assigns makes any warranty, expressed or implied, or assumes any liability or responsibility for any use, or the results of such use, of any information or data disclosed in this material.
Contact us at ACC_EconomicsDepartment@americanchemistry.com.


