MACROECONOMY & END-USE MARKETS
Running tab of macro indicators: 10 out of 20
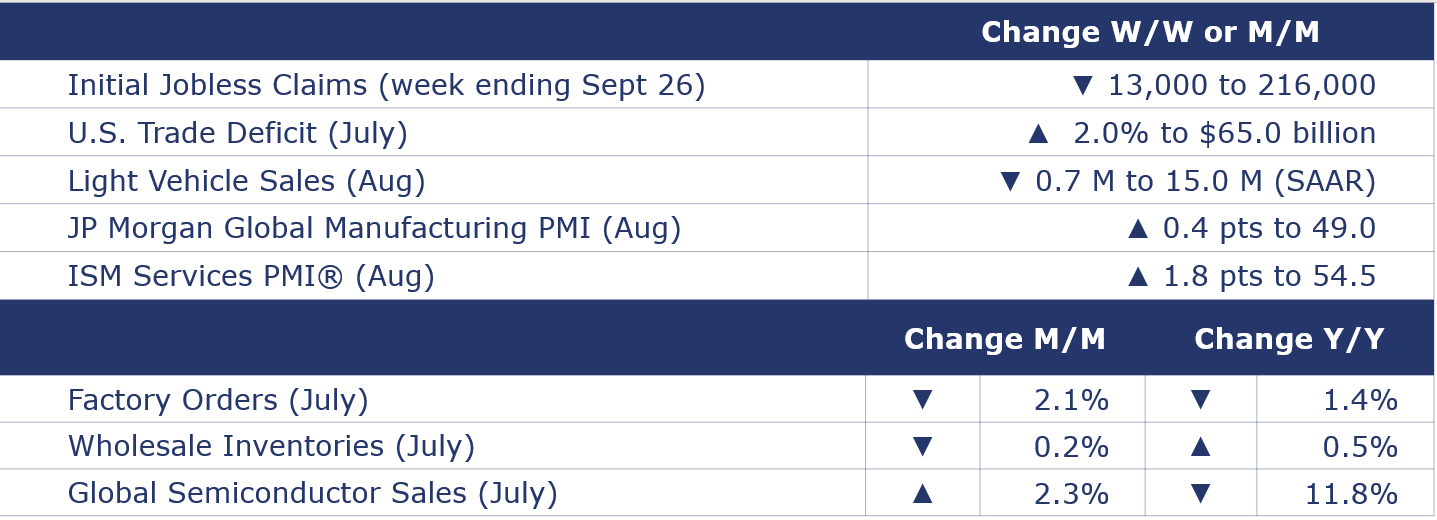
The number of new jobless claims fell by 13,000 to 216,000 during the week ending September 2, which led up to the Labor Day holiday. Continuing claims fell by 40,000 to 1.68 million, and the insured unemployment rate for the week ending August 26 was down at 1.1%.
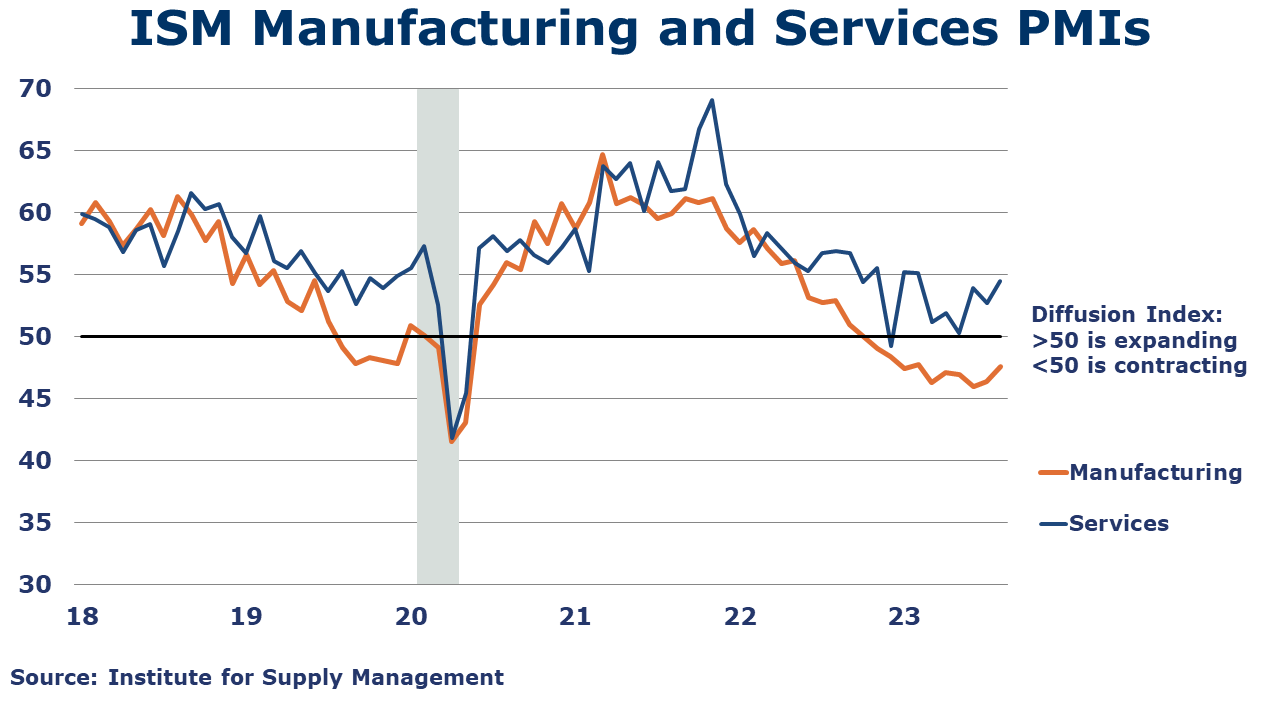
The ISM Services PMI® registered 54.5% in August, indicating continued expansion in the U.S. services sector. Except for a contraction in December, services have grown in 38 of the last 39 months. August’s expansion was due mostly to the increase in business activity, new orders, and employment. In addition, although backlog orders were down, inventories declined, and delivery times improved.
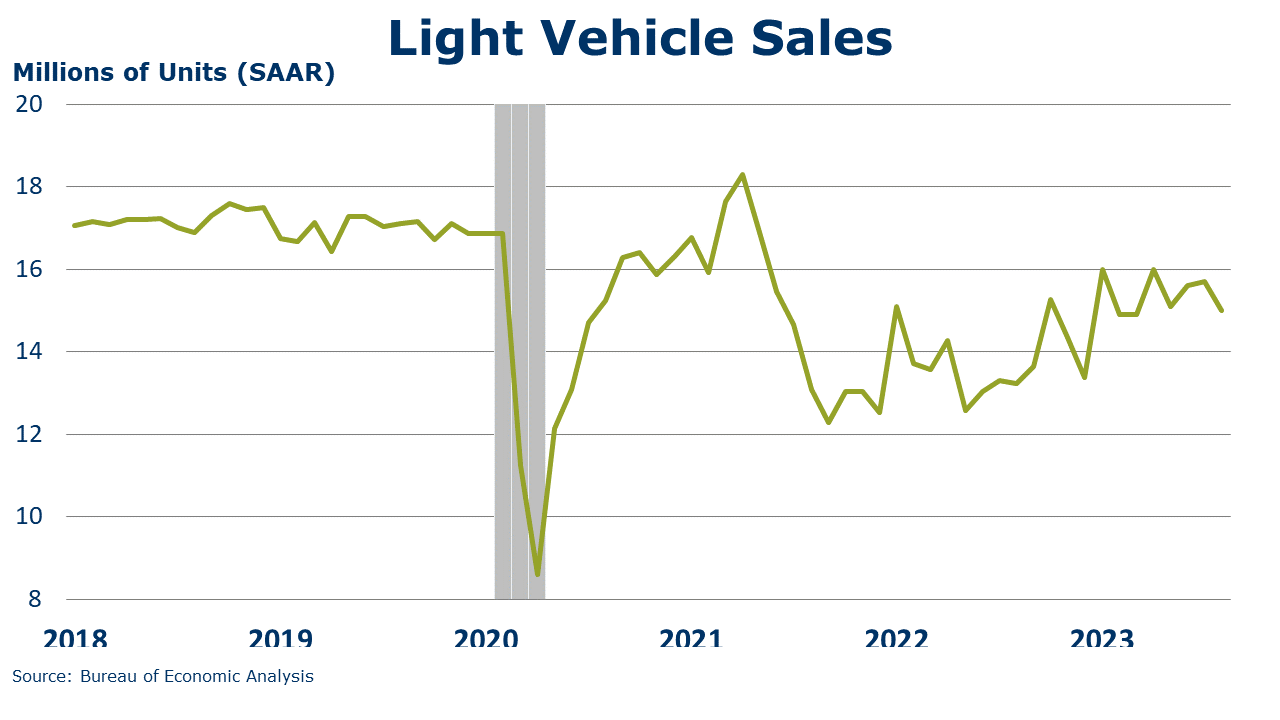
Light vehicle sales fell by an annualized 700K to a seasonally adjusted annual rate of 15.0 million (the slowest pace since March) as the boost from increased supply gives way to higher borrowing costs and tightening lending standards.
Wholesale inventories continued to move lower, down 0.2% in July. Inventories were lower across most categories, with the largest declines in furniture, electrical equipment, hardware, apparel, groceries, and chemicals. Wholesale inventories were higher for motor vehicles, machinery, farm products, and petroleum products. Sales at the wholesale level rose 0.8% in July, following a similar decline in June. Compared to a year ago, sales were 4.2% lower while inventories were 0.5% higher. The wholesale inventories-to-sales ratio fell from 1.41 in June to 1.39 in July.
Following four straight months of gains, factory orders fell by 2.1% in July, led by sharply lower orders for civilian aircraft. There were also declines in new orders for computers and IT equipment. Orders for motor vehicles, defense capital goods, and consumer goods were higher. New orders for construction materials were flat. Core business orders (nondefense capital goods excluding aircraft) edged higher by 0.1%. Compared to a year ago, headline factory orders were down 1.4% Y/Y while core business orders were up 0.5% Y/Y. Unfilled orders (a measure of the manufacturing pipeline) were up 0.5%. Manufacturing shipments also rose, up 0.5% and inventories were higher by 0.1%. The inventories-to-shipments ratio for manufacturing was steady at 1.48, up slightly from last July’s 1.47.
Global semiconductor sales were $43.2 billion in July, up 2.3% compared to June 2023 but down 11.8% Y/Y, according to data from Semiconductor Industry Association (SIA).
The JP Morgan Global PMI remained below the 50-mark, rising 0.4 pts to 49.0 in August, signaling contraction in global manufacturing activity for the twelfth month in a row. Manufacturing production declined for the third month in a row. The Euro area remains weak, U.S. returned to contraction, and China returned to expansion. Globally, new orders are declining for the fourteenth month. About a third of countries tracked have a manufacturing PMI above the 50-mark.
Fed Beige Book
A compilation of anecdotal information on the regional economies in the 12 districts, the Beige Book is published eight times per year. Interesting excerpts follow here:
“Contacts from most Districts indicated economic growth was modest during July and August. Consumer spending on tourism was stronger than expected, surging during what most contacts considered the last stage of pent-up demand for leisure travel from the pandemic era. But other retail spending continued to slow, especially on non-essential items. Some Districts highlighted reports suggesting consumers may have exhausted their savings and are relying more on borrowing to support spending. New auto sales did expand in many Districts, but contacts noted this had more to do with better availability of inventory rather than increased consumer demand. Manufacturing contacts in several Districts also noted that supply chain delays improved, and that they were better able to meet existing orders. New orders were stable or declined in most Districts, and backlogs shortened as demand for manufactured goods waned. One sector where supply did not become more available was single-family housing. Nearly all Districts reported the inventory of homes for sale remained constrained. Accordingly, new construction activity picked up for single-family housing. But multiple Districts noted that construction of affordable housing units was increasingly challenged by higher financing costs and rising insurance premiums. Bankers from different Districts had mixed experiences with growth in loan demand. Most indicated that consumer loan balances rose, and some Districts reported higher delinquencies on consumer credit lines. Agriculture conditions were somewhat mixed, but reports of drought and higher input costs were widespread. Energy activity was mostly unchanged during the final months of the summer.”
ENERGY
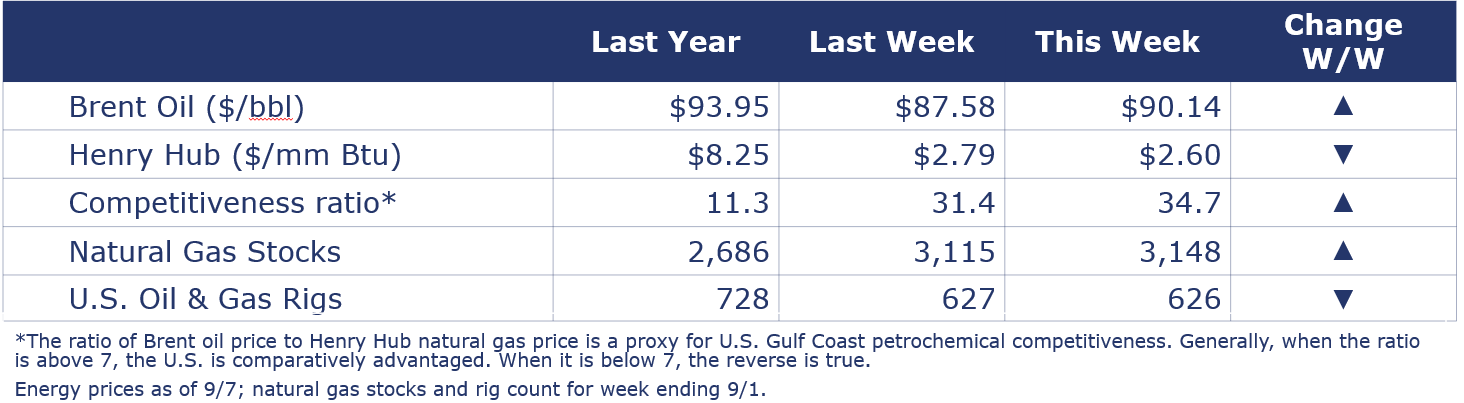
Oil prices continued to move higher (to above $90/bbl) after Saudia Arabia confirmed that it would extend its current production cuts into October and Russia announced it would continue to withhold some oil exports from the market. U.S. natural gas prices moved lower as the near-term forecast is for below-average to near-normal temperatures. The combined oil and gas rig count fell by one to 626.
CHEMICALS
Indicators for the business of chemistry bring to mind a [red] banner.

According to data released by the Association of American Railroads, chemical railcar loadings rose to 32,945 for the week ending Sept 2. Loadings were 6.1% Y/Y (13-week MA), down (4.7%) YTD/YTD and have been on the rise for 8 of the last 13 weeks.
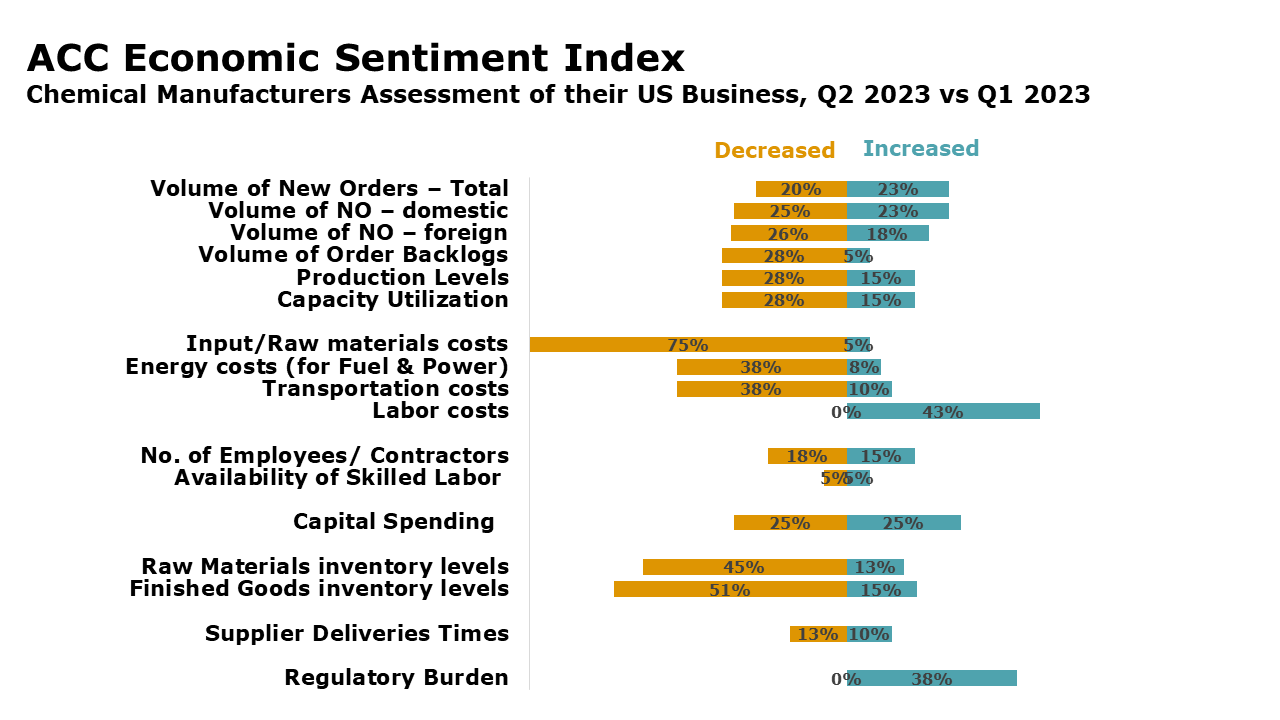
Chemical manufacturers’ assessment of their own company’s activity level (e.g., sales, production, output) deteriorated over the second quarter, according to findings from ACC’s Chemical Manufacturing Economic Sentiment Index (ESI) survey conducted in July. New orders growth flattened out and production and capacity utilization fell. Manufacturers’ volume of order backlogs continued to decline. Inventory destocking accelerated with declines in inventories of finished goods and raw materials. Labor costs continued to rise while production costs related to inputs/raw materials, energy (for fuel and power), and transportation eased. The level of regulatory burden (i.e., compliance and opportunity costs) is growing and expected to build further over the coming six months. Capital spending is on pause. The number of chemical industry jobs declined by a small margin. Availability of skilled labor was about the same. Chemical manufacturers’ assessment of demand from major customer markets deteriorated further and their sentiment on the state of economic conditions in the U.S. and globally has been largely pessimistic this year. Further weakening in economic conditions is expected in the coming six months.
Fed Beige Book – Comments related to chemical manufacturing
Atlanta Fed - “Contacts reported robust activity in plant expansions for oil and gas refineries, chemical manufacturers, and low carbon and green energy projects. Related to increased energy production, contacts described strong demand for onshoring large-scale modular plant construction since some chemical, petrochemical, and liquefied natural gas customers were "burned" by offshoring these builds over the last several years, which resulted in late delivery and poor-quality structures.”
Dallas Fed - “The weakness was broad-based but most notable in chemical, high-tech, and machinery manufacturing. Food and fabricated metals manufacturing exhibited more strength than other segments. A chemical manufacturer said construction, packaging, and industrial demand were proving anemic, and that the weak outlook for China and Europe was weighing on expected export demand.”

Chemical shipmentsfell by 0.3% in July, the fourth decline in the past five months. The decline in July reflected lower shipments of coatings & adhesives and all other chemicals that partially offset a gain in shipments of agricultural chemicals. Chemical manufacturing inventories also fell by 0.9% with declines across all major segments. Compared to a year ago, shipments were 1.2% lower while inventories were down 3.6% Y/Y. The inventories-to-shipments ratio remained stable at 1.24, a level lower than last year’s 1.27.
Chemical wholesale inventories fell 0.7% in July, following a 2.2% decline in June. Sales of chemicals at the wholesale level were flat in July, however. As a result, the inventories-to-shipments ratio fell from 1.16 in June to 1.15 in July. Inventories were off 8.8% Y/Y while sales wer off 9.2% Y/Y.
Chemicals exports fell by 7.8% to $13.1 billion in July, with exports down in all major chemicals except synthetic rubber, which was up 3.4% M/M. Agricultural chemicals saw the steepest drop (25.3%), following by synthetic fibers (16.4%) and inorganics (down 13.6%). Chemicals imports were also down M/M, by 3.6% to $11.3 billion. Imports of agricultural chemicals, inorganics, bulk petrochemicals, and specialties all fell, while imports of plastic resins, consumer products and synthetic fibers were up. Compared to the same time last year, chemicals exports were down 14.9% and imports were down 10.6%.
Note On the Color Codes
Banner colors reflect an assessment of the current conditions in the overall economy and the business chemistry of chemistry. For the overall economy we keep a running tab of 20 indicators. The banner color for the macroeconomic section is determined as follows:
Green – 13 or more positives
Yellow – between 8 and 12 positives
Red – 7 or fewer positives
There are fewer indicators available for the chemical industry. Our assessment on banner color largely relies upon how chemical industry production has changed over the most recent three months.
For More Information
ACC members can access additional data, economic analyses, presentations, outlooks, and weekly economic updates through ACCexchange.
In addition to this weekly report, ACC offers numerous other economic data that cover worldwide production, trade, shipments, inventories, price indices, energy, employment, investment, R&D, EH&S, financial performance measures, macroeconomic data, plus much more. To order, visit http://store.americanchemistry.com/.
Every effort has been made in the preparation of this weekly report to provide the best available information and analysis. However, neither the American Chemistry Council, nor any of its employees, agents or other assigns makes any warranty, expressed or implied, or assumes any liability or responsibility for any use, or the results of such use, of any information or data disclosed in this material.
Contact us at ACC_EconomicsDepartment@americanchemistry.com.


