MACROECONOMY & END-USE MARKETS
Running tab of macro indicators: 8 out of 20
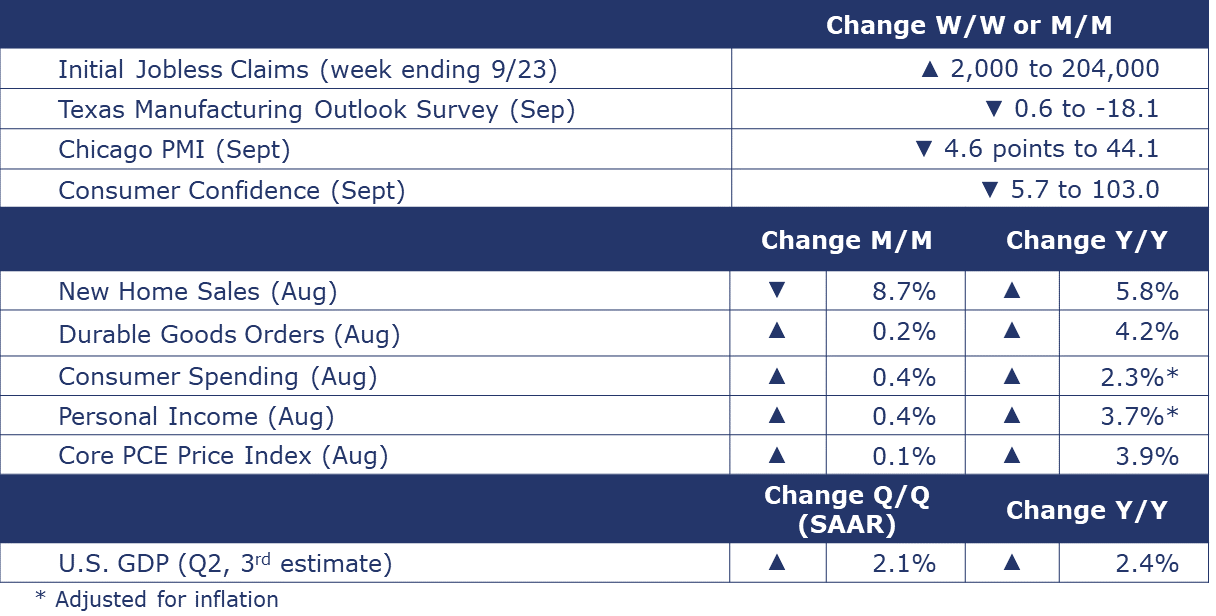
The number of new jobless claims rose by 2,000 to 204,000 during the week ending September 23. Continued claims increased by 12,000 to 1.67 million, and the insured unemployment rate for the week ending September 16 was unchanged at 1.1%.
Following a 0.9% gain in July, consumer spending continued to expand in August, up 0.4%. The gain partially reflects higher gasoline prices; spending on services slowed and spending on durable goods was lower. Aggregate personal income also continued to grow as employment and wage growth continued to rise. The headline price index for personal consumption expenditures (PCE) rose at a faster annual pace (up slightly to 3.5% Y/Y). The underlying core PCE price index (excluding food and energy) moderated from 4.3% Y/Y in July to 3.9% Y/Y in August. This is good news for the Fed.

The Conference Board’s Consumer Confidence Index® declined in September to 103.0 from an upwardly revised 108.7 in August. Consumers’ assessment of the present and short-term outlook for economic and labor market conditions rose slightly. Concerns about family finances are growing as consumers are less confident about future business conditions, job availability, and incomes. The Expectations Index fell back below 80 - a level which historically signals a recession within the coming year. Plans to purchase autos and appliances continued to trend upward but plans to buy homes—more in line with rising interest rates—continued to trend downward.
New home sales fell 8.7% in August, with the largest M/M drop in the Midwest; the Northeast was the only region that had an uptick in sales. On a Y/Y basis, sales were up 5.8%, with double digit gains in the Northeast (18.5%), Midwest (24.2%) and West (44.1%). The inventory of new homes was up 1.2%, representing a 7.8-month supply, the largest since March of this year.
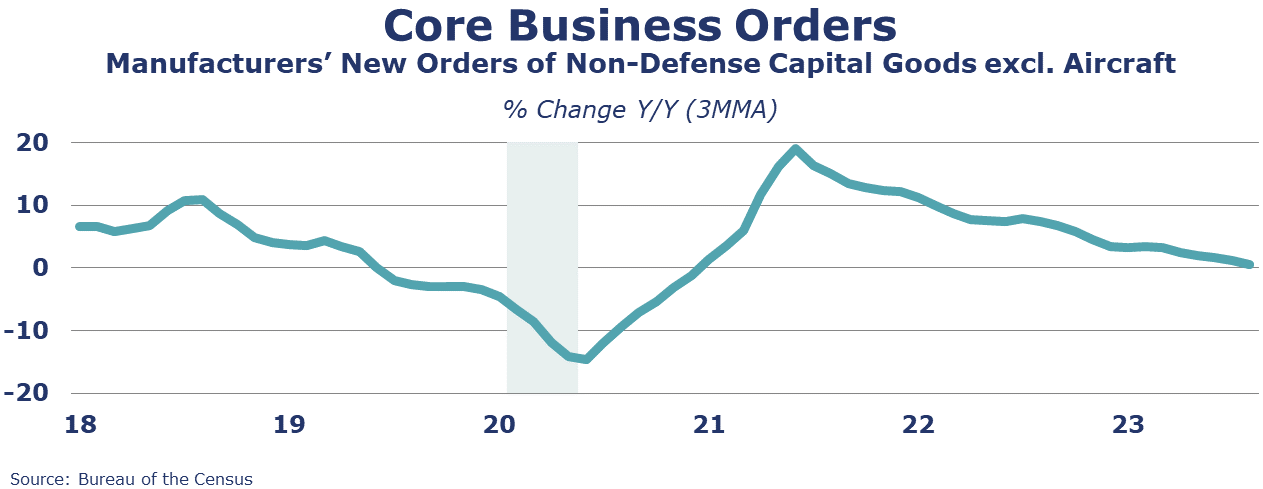
Following a 5.6% decline in July, new orders for durable goods rose 0.2% in August. The gain was led by machinery, which has risen four of the last five months. Declines in nondefense aircraft and parts, primary metals, and transportation equipment were offset by gains in defense aircraft and parts and computers and related products. Core business orders increased 0.9% following a 0.4% decline in July. Headline orders were up 4.2% Y/Y while core business orders were up 2.1% Y/Y.
In its third and final estimate, BEA reported U.S. GDP grew by a 2.1% seasonally adjusted annual rate during Q2. The increase in Q2 primarily reflects gains in business investment, consumer spending, and state and local government spending that were partly offset by lower exports. Imports, which are a subtraction in the calculation of GDP, decreased.
ACC Survey Economic Forecasters – Global Outlook
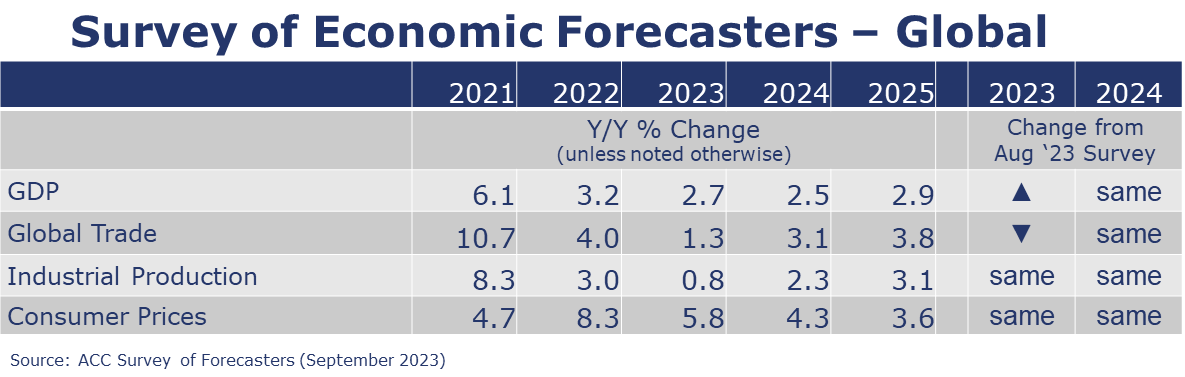
- The consensus assessment of the global economic situation this year and in the near-term was hardly changed from last month. The forecast for world economic activity this year was raised slightly to 2.7%. Expectations for 2024 global GDP growth held steady at a a 2.5% pace.
- Estimates on the pace of inflation this year and next were unchanged. Global inflation is forecast to grow at a 5.8% pace this year and moderate further to a 4.3% pace in 2024.
- Global trade growth forecasts were lowered slightly for this year but the consensus outlook for 2024 growth was unchanged. Trade volumes are expected to have grown at an average 1.3% pace this year and improve to a 3.1% pace in 2024.
- The industrial sector will expand 0.8% overall this year and pick up some steam, growing by 2.3% in 2024.
ENERGY
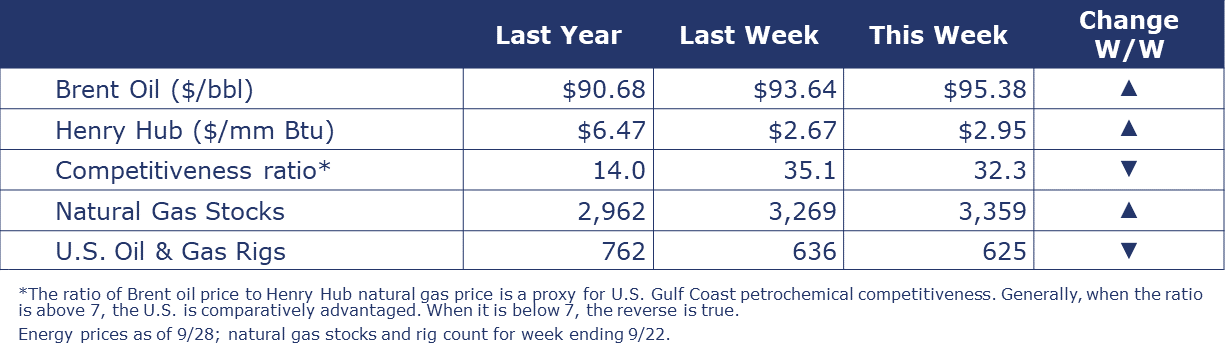
Oil prices rose to their highest level in more than a year on lower-than-expected stockpiles of oil in the US. Oil prices have risen more than 30% since June on the back of supply cuts from Saudi Arabia and Russia. Natural gas prices also moved higher, nearing $3/mmbtu, despite above-average build in inventories. Moving into October, heating demand is starting to pick up in some parts of the country. Following a jump last week, the combined oil and gas rig count fell by 11 to 625 during the week ending 22 September.
CHEMICALS
Indicators for the business of chemistry bring to mind a red banner.

According to Association of American Railroads data, chemical railcar loadings were down 5.2% to 31,067 for the week ending September 23. Loadings were down 4.2% Y/Y (13-week MA), down 2.8% YTD/YTD and have been on the rise for 7 of the last 13 weeks.
The U.S. Geological Survey reported production of soda ash rose 0.9% in July to 942 thousand tons, a level down 5.0% Y/Y. Stocks were up 12.2% M/M to 368 thousand tons at the end of July, a 12-day supply. Ending stocks were up 13.5% Y/Y.
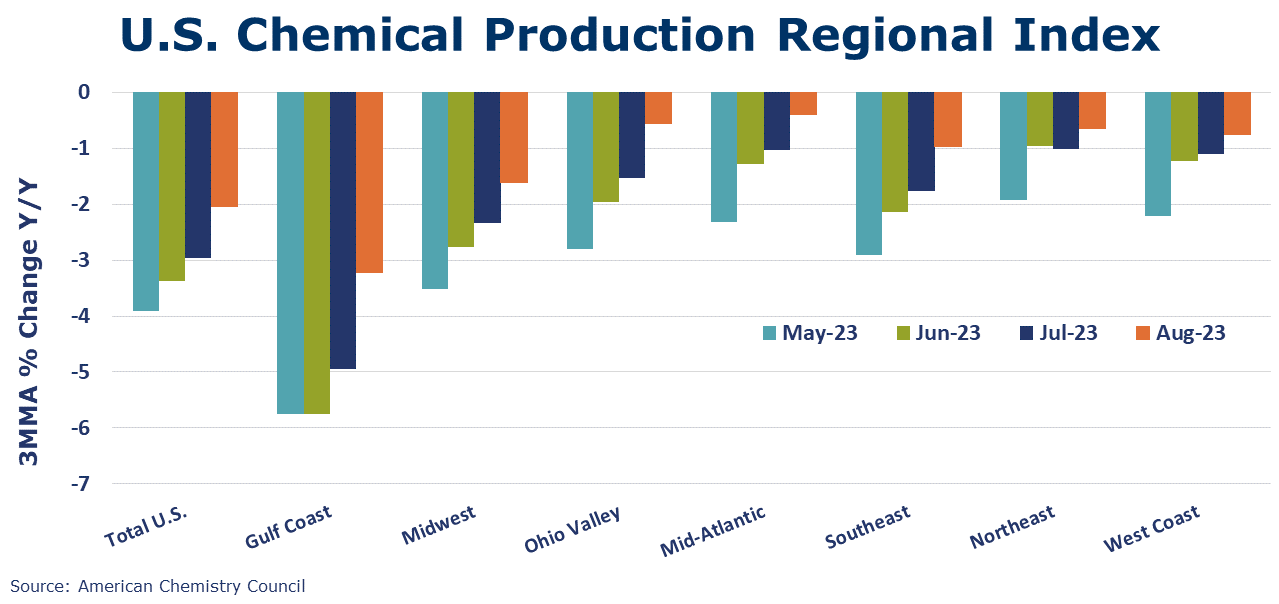
ACC’s U.S. Chemical Production Regional Index (U.S. CPRI) rose 0.7% in August, following a 0.2% decline in July. The U.S. CPRI was off 2.0% Y/Y. The U.S. CPRI, measured on a 3MMA basis to reduce month-to-month volatility, showed improvement in production in all regions. The largest gains were in the Gulf Coast, Ohio Valley, and Southeast regions. Increased output of resins, organic chemicals, inorganic chemicals, coatings, adhesives, other specialty chemicals, and consumer products was offset by weakness in fertilizers, crop protection chemicals, synthetic rubber, and manufactured fibers.
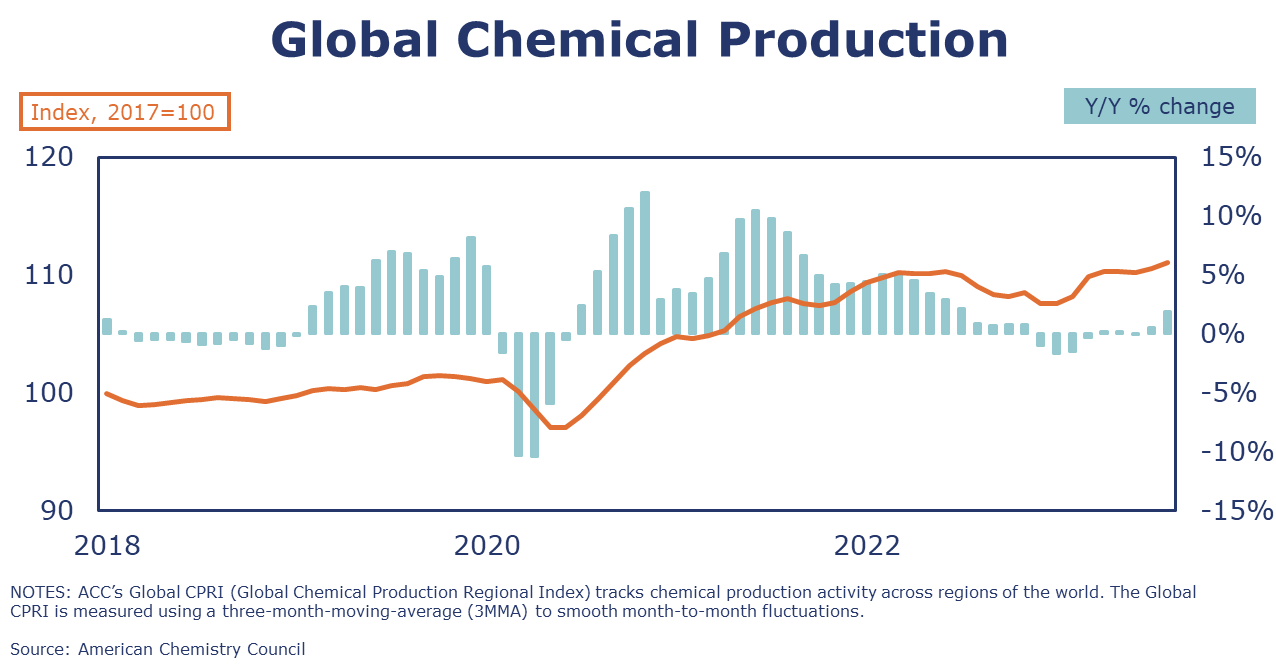
Following the 0.3% gain in the month prior, the ACC Global Chemical Production Regional Index (Global CPRI) bounced back by 0.4% in August. All regions recorded growth with the most significant increases in the United States, China, Germany, the Netherlands, and Russia. Global output is up in all segments with agricultural and coating leading the gains. Global chemicals production growth was up 1.1% Y/Y.
Note On the Color Codes
The banner colors represent observations about the current conditions in the overall economy and the business chemistry. For the overall economy we keep a running tab of 20 indicators. The banner color for the macroeconomic section is determined as follows:
Green – 13 or more positives
Yellow – between 8 and 12 positives
Red – 7 or fewer positives
For the chemical industry there are fewer indicators available. As a result, we rely upon judgment whether production in the industry (defined as chemicals excluding pharmaceuticals) has increased or decreased three consecutive months.
For More Information
ACC members can access additional data, economic analyses, presentations, outlooks, and weekly economic updates through ACCexchange.
In addition to this weekly report, ACC offers numerous other economic data that cover worldwide production, trade, shipments, inventories, price indices, energy, employment, investment, R&D, EH&S, financial performance measures, macroeconomic data, plus much more. To order, visit http://store.americanchemistry.com/.
Every effort has been made in the preparation of this weekly report to provide the best available information and analysis. However, neither the American Chemistry Council, nor any of its employees, agents or other assigns makes any warranty, expressed or implied, or assumes any liability or responsibility for any use, or the results of such use, of any information or data disclosed in this material.
Contact us at ACC_EconomicsDepartment@americanchemistry.com.


