June 2, 2023
(press release)
–
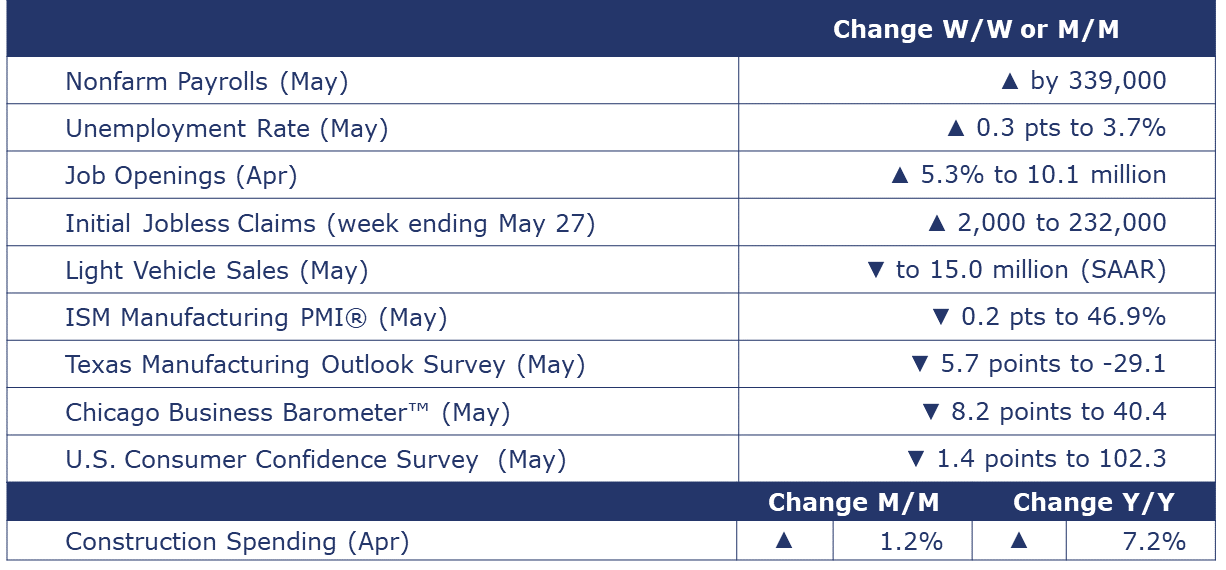
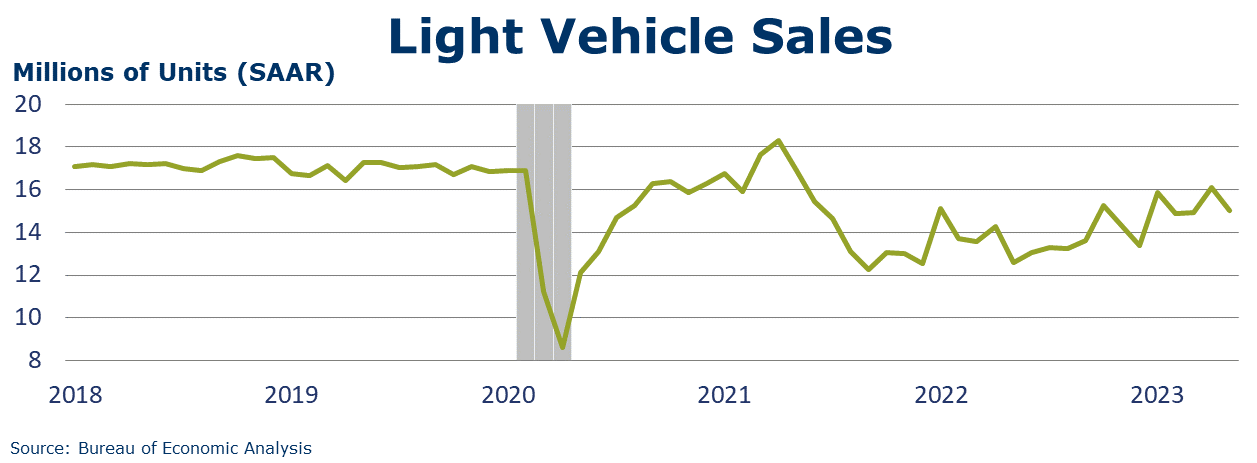
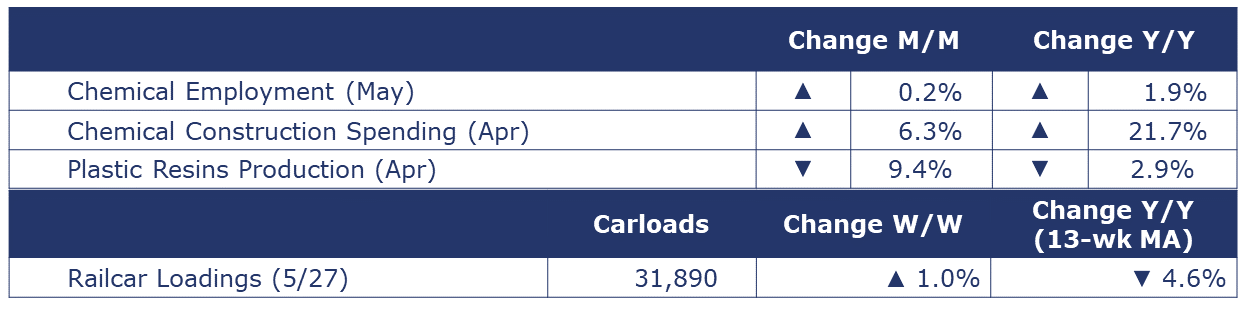
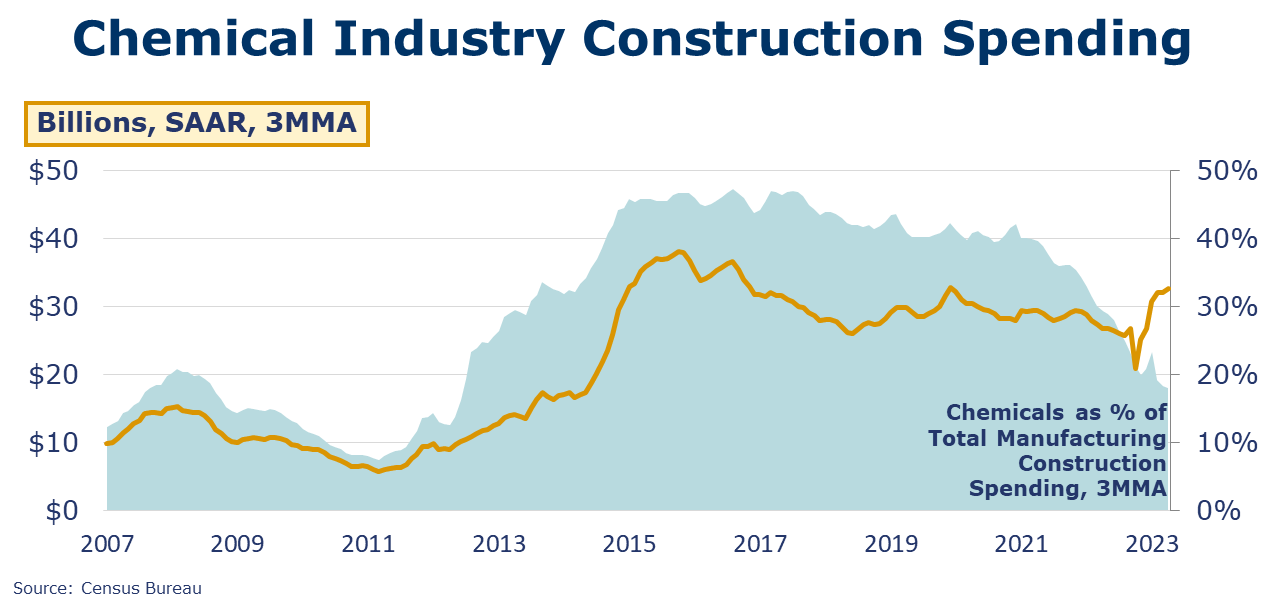
Running tab of macro indicators: 11 out of 20 Nonfarm payrolls expanded by 339,000 in May, once again above expectations. The increase in May employment (based on data from the establishment survey) was the largest monthly gain since January. In addition, gains for March and April were revised higher. Interestingly, data from the household survey (used to calculate the unemployment rate) showed the number of employed people declined in May. It’s not unusual for the two surveys to contradict each other, especially around turning points. The gains in employment from the establishment survey were predominantly in the services sector. Total manufacturing employment eased with a decline in nondurable goods manufacturing that offset gains in motor vehicle and other durable goods manufacturing. A bellwether for labor demand, employment in “temporary help services” moved higher in May, following three months of declines. The growth rate in average hourly wages slowed slightly to 4.3% Y/Y. Average weekly hours edged lower to 34.3 hours. According to the household survey, the number of unemployed people rose by 440,000, the largest gain since the pandemic lockdowns. As a result, the unemployment rate jumped from a 50-year low of 3.4% in April to 3.7% in May. The number of new jobless claims was up by 2,000 to 232,000 during the week ending May 27. Continuing claims increased by 6,000 to 1.79 million, and the insured unemployment rate for the week ending May 20 was unchanged at 1.2%. After falling for three consecutive months, job openings rose 5.3% to 10.1 million in April. That works out to 1.8 jobs for every unemployed person, up from 1.6 last month, but below the 2.0 job openings per unemployed person in December. In addition, layoffs fell from 1.8 million in March to 1.6 million in April. The demand for labor has remained robust despite more than a year of interest rate hikes. The Conference Board Consumer Confidence Index® fell to 102.3 in May (from 103.7 in April). Consumers’ assessment of present economic and labor market conditions decreased as did their expectations for the short-term outlook. The expectations index remains below 80 and has been there for 14 of the last 15 months. Consumers’ assessment of the current business environment remains below the level which often signals a recession looming in the short term. Plans for major purchases such as autos, appliances, and vacations all ticked upwards in May, while plans for a home purchase remained the same but still down from the fourth quarter of 2022. Following a gain in May, light vehicle sales fell back in May to a 15.0 million unit seasonally adjusted annual rate (SAAR). Vehicle sales have been choppy this year as the restoration of inventories following several years of supply chain problems have been met with higher borrowing costs and greater economic uncertainty. Construction spending increased 1.2% in April to a level up 7.2% Y/Y. Residential construction was up 0.4%. Spending on multi-family home construction rose 0.6% while spending on chemistry-intensive single family home construction fell 0.8%. Higher non-residential spending (up 2.4%) was influenced by an 8.7% increase in manufacturing. Public spending on construction rose by 1.1% and was 16.5% higher Y/Y. The ISM Manufacturing PMI® fell 0.2 points to 46.9% in May, indicating a seventh consecutive month of contraction in the U.S. industrial sector (readings below 50 suggest contraction, readings above 50 suggest expansion). The ISM’s data indicates easing demand with new orders down for the ninth month, new export orders unchanged, and customer inventories deemed “too high”. Manufacturing output signals were positive with the production index moving into growth territory and employment expanding at a faster pace in May. Prices dropped notably and supplier delivery times were faster. Fourteen out of 18 manufacturing industries reported contraction. The Chicago Business Barometer™ fell by 8.2 points to 40.4, a six-month low and indicative of a severe contraction. General business activity at Texas manufacturers continued to deteriorate in May according to the Dallas Fed’s Texas Manufacturing Outlook Survey. The general business conditions index fell to -29.1, its lowest reading in three years. Production edged slightly lower while the decline in new orders accelerated. Finished goods inventories were essentially neutral (after contracting in April). Capital expenditures contracted. Looking ahead six months, manufacturers are less pessimistic about business activity. The J.P.Morgan Global Manufacturing PMI™ was unchanged and signaling contraction at 49.6 in May. A reading below 50 signals contraction. The index has registered below 50 for 9 months. Output expanded (and at a faster rate). Labor also expanded (though at a slower rate). Weak demand was indicated with declines in both new orders and new export orders. Sentiment amongst manufacturers is weakening as demand deteriorates. A compilation of anecdotal information on the regional economies in the 12 districts, the Beige Book is published eight times per year. “Economic activity was little changed overall in April and early May. Four Districts reported small increases in activity, six no change, and two slight to moderate declines. Expectations for future growth deteriorated a little, though contacts still largely expected a further expansion in activity. Consumer expenditures were steady or higher in most Districts, with many noting growth in spending on leisure and hospitality. Education and healthcare organizations saw steady activity on balance. Manufacturing activity was flat to up in most Districts, and supply chain issues continued to improve. Demand for transportation services was down, especially in trucking, where contacts reported there was a "freight recession." Residential real estate activity picked up in most Districts despite continued low inventories of homes for sale. Commercial construction and real estate activity decreased overall, with the office segment continuing to be a weak spot. Outlooks for farm income fell in most districts, and energy activity was flat to down amidst lower natural gas prices. Financial conditions were stable or somewhat tighter in most Districts. Contacts in several Districts noted a rise in consumer loan delinquencies, which were returning closer to pre-pandemic levels. High inflation and the end of Covid-19 benefits continued to stress the budgets of low- and moderate-income households, driving increased demand for social services, including food and housing.” Oil prices had drifted lower earlier in the week on debt ceiling concerns but were trending upward on Thursday on the debt ceiling deal and better economic news about China. OPEC+ meets on Sunday and has banned some western media from the meeting. U.S. natural gas prices moved lower on another solid build in gas inventories last week. Gas inventories are nearly 30% higher than a year ago. The combined oil and gas rig count fell for a fourth consecutive week, down by nine to 707. Indicators for the business of chemistry bring to mind a yellow banner. According to data released by the Association of American Railroads, chemical railcar loadings were up to 31,890 for the week ending May 27. Loadings were down 4.6% Y/Y (13-week MA), down (4.9%) YTD/YTD and have been on the rise for 8 of the last 13 weeks. Within the comments of the Dallas Fed’s Texas Manufacturing Outlook Survey, one chemical manufacturing respondent noted, “Volumes have not rebounded at a level we would expect this time of year. Orders seem to be more erratic, which is in line with automotive and building construction markets trending downward as interest rates have deeply impacted both of these key, basic-materials consumer sectors.” Separately, a comment from the Beige Book, “Reports from refineries and chemical producers were mixed. Overall, manufacturing outlooks worsened further, and uncertainty continues to climb.” U.S. production of major plastic resins totaled 7.7 billion pounds during April, down 9.4% M/M and down 2.9% Y/Y, according to ACC statistics. Year-to-date production was 31.8 billion pounds, up slightly (0.5%) compared to this time last year. Sales and captive use of major plastic resins totaled 7.4 billion pounds, down 8.4% M/M and down 6.8% Y/Y. Year-to-date sales and captive use were 30.6 billion pounds, a 2.6% decrease as compared to the same period in 2022. Chemical industry construction spending rose 6.3% in April and was up 21.7% Y/Y. Chemical construction spending as a percent of total manufacturing construction spending was 18.0% in April. The comparison has been softening gradually after climbing to a sustained high proportion (around 46%) during 2014-2017. Chemical and pharmaceutical industry employment rose by 1,700 (0.2%) in May and was higher by 17,400 (1.9%) compared to a year ago. The gain in May reflected a gain in supervisory and non-production workers that offset a decline in the number of production workers. Average hourly wages for production workers continued to accelerate, up by 8.6% Y/Y to $29.38. The average workweek ticked down to 41.4 hours. As a result, the production labor input into the chemical industry fell, consistent with the ISM report that said that the chemical industry contracted in May. While official government data shows the number of chemical and pharmaceutical industry employees continuing to rise, details in the ISM PMI Manufacturing® survey report suggest they decreased in May. The chemical industry was one of the industries reporting contraction in May according to ISM. A survey respondent from the chemical industry commented, “demand continues to gain momentum due to new business pipelines finally yielding billable production. Personal care and home care are drivers.” However, in aggregate, demand is looking weaker. Chemical industry respondents reported a decline in new orders and lower new export orders. From chemicals, the ISM report also included signs of faster supplier deliveries, contracting inventories, customer inventories being “too low”, falling raw materials prices and lower order backlogs in May. The banner colors represent observations about the current conditions in the overall economy and the business chemistry. For the overall economy we keep a running tab of 20 indicators. The banner color for the macroeconomic section is determined as follows: Green – 13 or more positives For the chemical industry there are fewer indicators available. As a result, we rely upon judgment whether production in the industry (defined as chemicals excluding pharmaceuticals) has increased or decreased three consecutive months. ACC members can access additional data, economic analyses, presentations, outlooks, and weekly economic updates through ACCexchange. In addition to this weekly report, ACC offers numerous other economic data that cover worldwide production, trade, shipments, inventories, price indices, energy, employment, investment, R&D, EH&S, financial performance measures, macroeconomic data, plus much more. To order, visit http://store.americanchemistry.com/. Every effort has been made in the preparation of this weekly report to provide the best available information and analysis. However, neither the American Chemistry Council, nor any of its employees, agents or other assigns makes any warranty, expressed or implied, or assumes any liability or responsibility for any use, or the results of such use, of any information or data disclosed in this material. Contact us at ACC_EconomicsDepartment@americanchemistry.com.MACROECONOMY & END-USE MARKETS

Fed Beige Book
ENERGY

CHEMICALS

Note On the Color Codes
Yellow – between 8 and 12 positives
Red – 7 or fewer positivesFor More Information


* All content is copyrighted by Industry Intelligence, or the original respective author or source. You may not recirculate, redistrubte or publish the analysis and presentation included in the service without Industry Intelligence's prior written consent. Please review our terms of use.


