March 27, 2023
(press release)
–
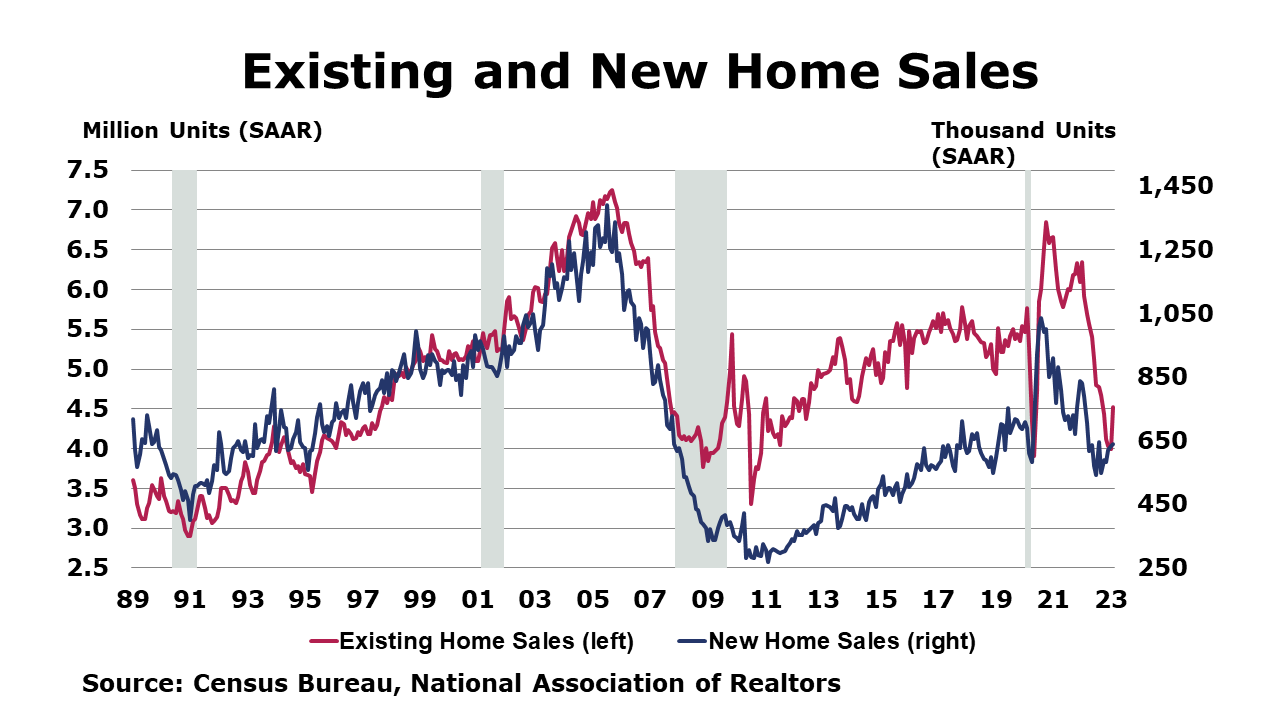
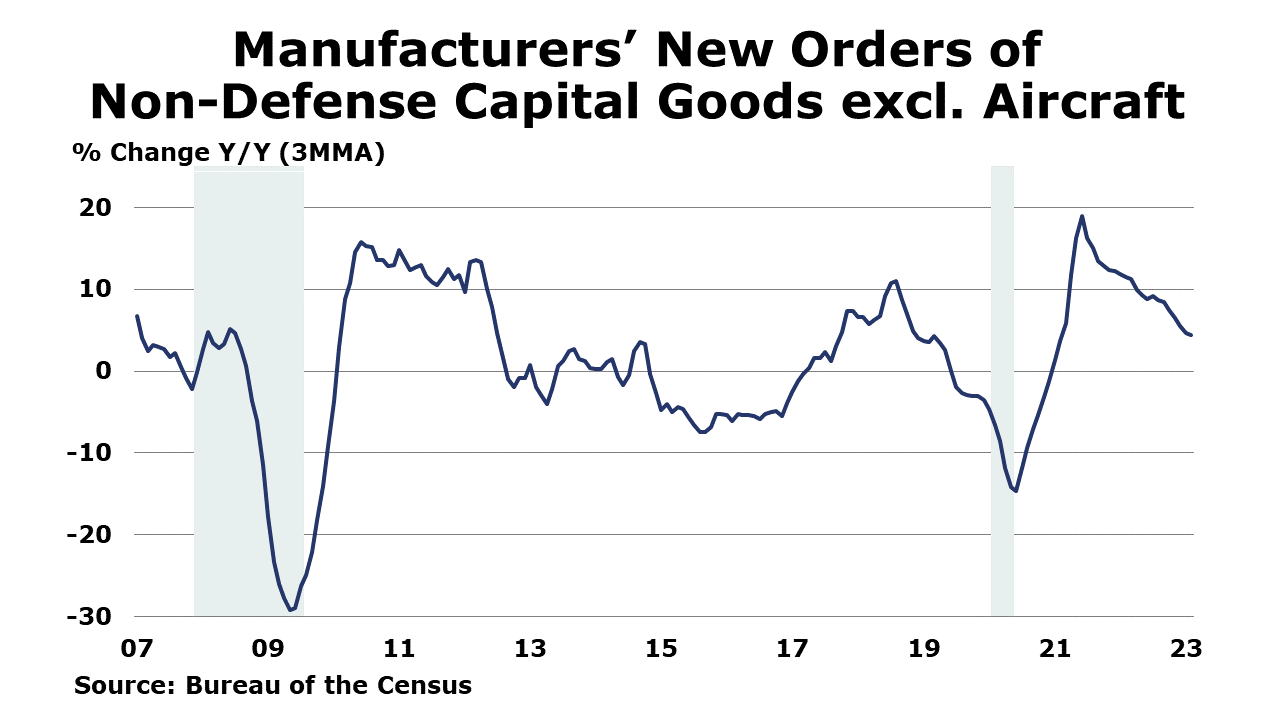
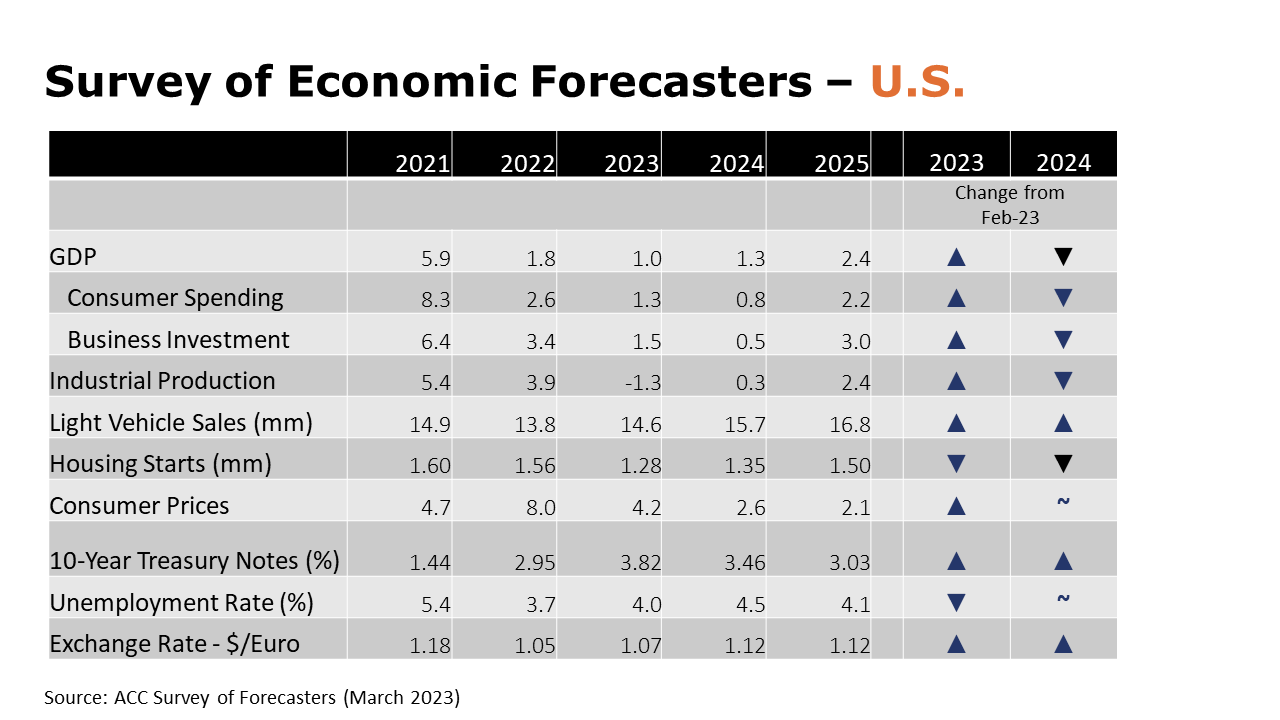
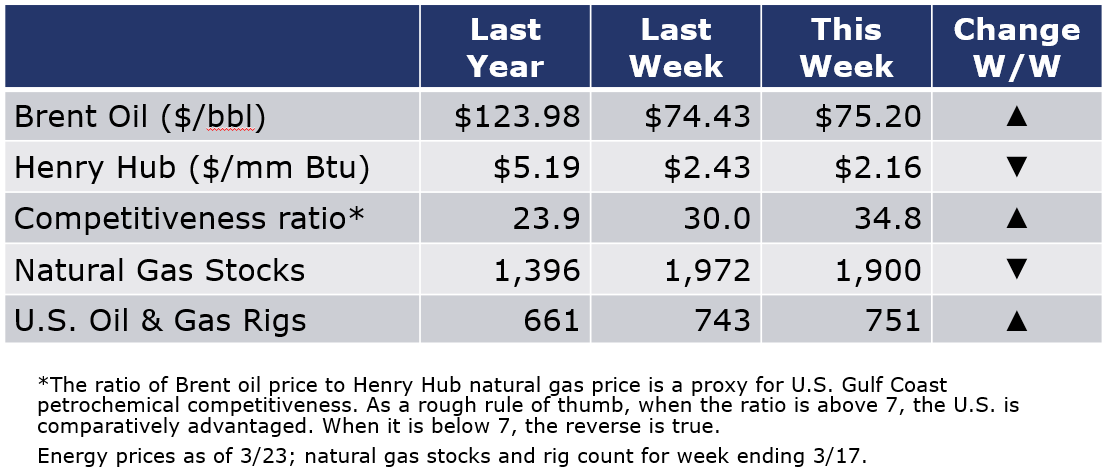
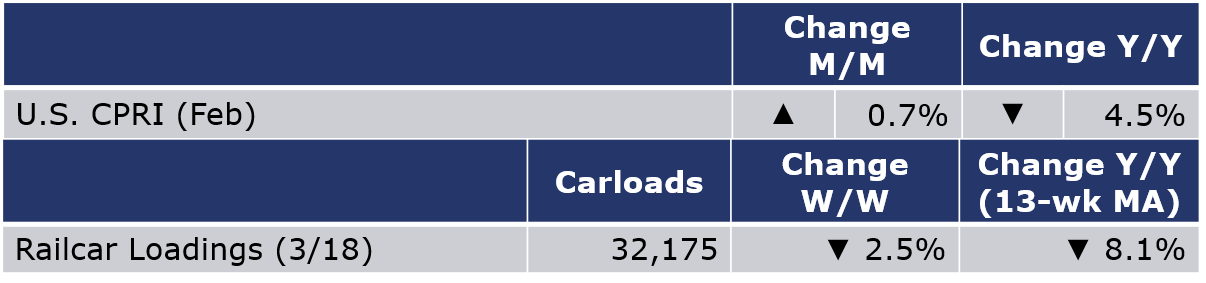
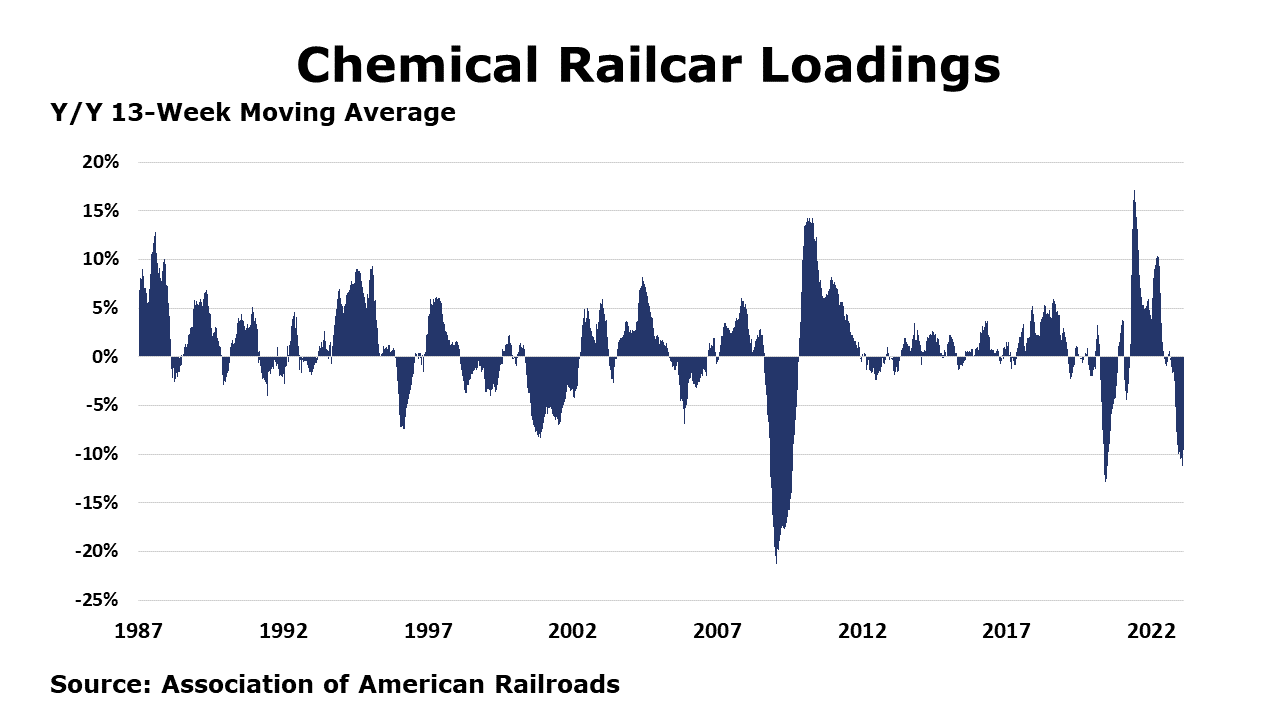
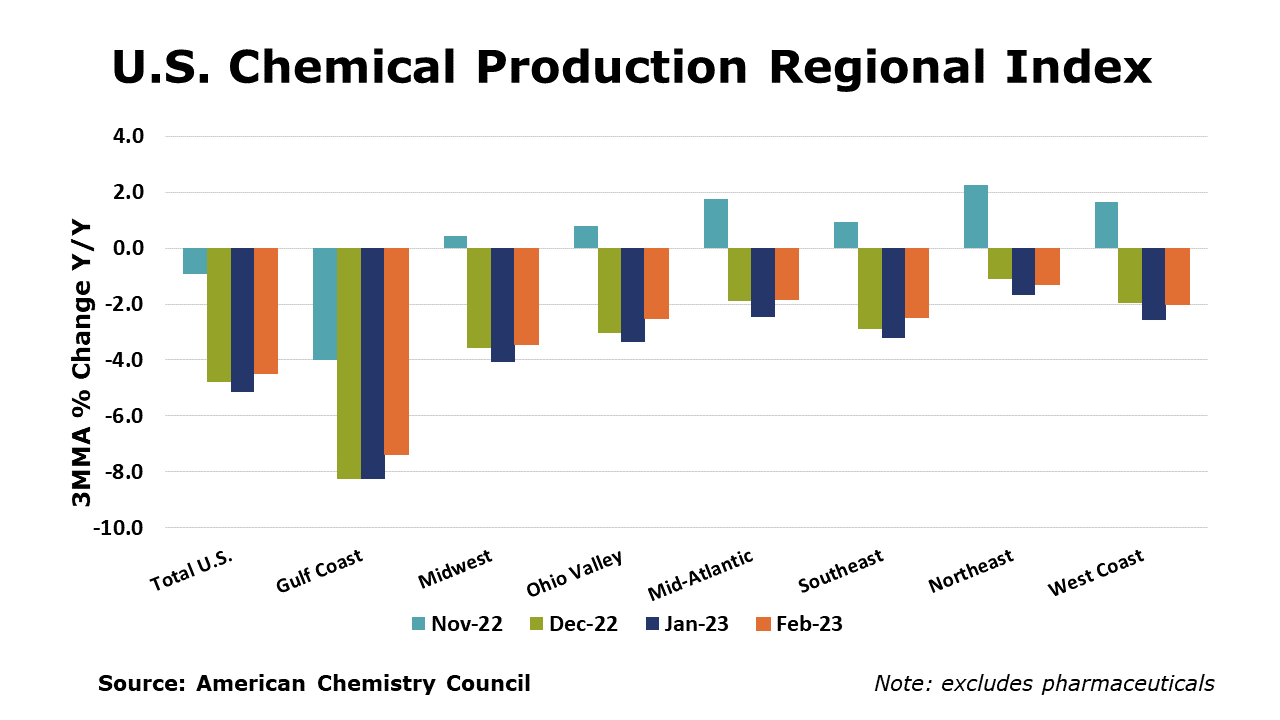
Running tab of macro indicators: 6 out of 20 The number of new jobless claims decreased by 1,000 to 191,000 during the week ending March 18. Continuing claims increased by 14,000 to 1.69 million, and the insured unemployment rate for the week ending March 11 was unchanged (1.2%) from the week prior. For the first time in a year, existing home sales rose in February, up by 14.5% compared to January. The boost in sales follows a dip in mortgage rates through mid-February. All regions posted higher sales. The inventory of unsold homes was unchanged and represents an historically lean 2.6 months at the current sales pace. The median price of an existing home fell 0.2% Y/Y for the first annual decline in more than a decade. New home sales rose for a third straight month in February, up by 1.1%. Sales were down 19.0% Y/Y, however. Higher sales in the South and West offset declines in the Northeast and Midwest. The inventory of new homes declined from 8.3 months of supply in January to 8.2 in February. The median price for a new home rose 2.5% Y/Y continuing a slowing pace of gains. Orders for long-lasting durable goods fell for a second straight month in February, off by 1.0%. There were declines across a broad set of sectors, including aircraft, motor vehicles, computers, communications equipment, and machinery. Orders for metals, metal products, and electrical equipment were higher, however. Core business orders rose modestly for a second month, up by 0.2%. Compared to a year ago, core business orders were up 3.2% Y/Y while headline durable orders remained ahead by 1.0% Y/Y. According to its monthly survey, the Kansas City Fed reported that manufacturing activity remained flat in March, virtually unchanged from January and February. Its composite index of activity includes production, new orders, employment, supplier delivery time, and raw material inventory. Nondurable goods plants reported decreased activity in March, notably plastics and chemical manufacturing. The year-over-year factory index increased slightly. Since the beginning of the year, factories reported a slight decrease in profit margins given current pricing pressures. SURVEY OF ECONOMIC FORECASTERS Natural gas prices were lower this week on strong production forecasts and the anticipation of warmer spring temperatures. Oil prices were slightly higher than a week ago, however, as the dollar fell to its lowest level in nearly two months. The combined oil and gas rig count rose by eight to 751 during the most recent week. For the business of chemistry, the indicators brings to mind a yellow banner for basic and specialty chemicals According to data released by the Association of American Railroads, chemical railcar loadings were down to 32,175 for the week ending March 18. Loadings were down 8.1% Y/Y (13-week MA), down 7.2% YTD/YTD and have been on the rise for 8 of the last 13 weeks. The U.S. Chemical Production Regional Index (U.S. CPRI) rose by 0.7% in February following declines of 2.4% in December and 0.6% in January, according to the American Chemistry Council (ACC). Chemical output was higher than a month ago in all regions, with the largest gain in the Gulf Coast, home to much of the nation’s basic industrial chemical and synthetic materials capacity. Because the CPRI is measured as a three-month moving average (3MMA), February’s gain reflects a rebound in the most recent month that followed several declines at the end of the year due to lower manufacturing demand and disruptions from winter storm Elliott. Compared with February 2022, U.S. chemical production was 4.5% lower. Chemical production was lower than a year ago in all regions, with the largest declines in the Gulf Coast. On a 3MMA basis, chemical production within segments was mixed in February. Output of plastic resins, consumer products, fertilizers, organic chemicals, and pesticides were higher. These gains were offset by lower production of coatings, adhesives, other specialty chemicals, synthetic rubber manufactured fibers, industrial gases and synthetic dyes & pigments. As nearly all manufactured goods are produced using chemistry in some form, manufacturing activity is an important indicator for chemical demand. Down for a fourth consecutive month, manufacturing output was lower by 0.2% in February on a 3MMA basis. The 3MMA trend in manufacturing production was mixed, with output in most chemistry-consuming segments continuing to contract. Output continued to expand, however, in aerospace, apparel and appliances. The banner colors represent observations about the current conditions in the overall economy and the business chemistry. For the overall economy we keep a running tab of 20 indicators. The banner color for the macroeconomic section is determined as follows: Green – 13 or more positives For the chemical industry there are fewer indicators available. As a result we rely upon judgment whether production in the industry (defined as chemicals excluding pharmaceuticals) has increased or decreased three consecutive months. ACC members can access additional data, economic analyses, presentations, outlooks, and weekly economic updates through MemberExchange. In addition to this weekly report, ACC offers numerous other economic data that cover worldwide production, trade, shipments, inventories, price indices, energy, employment, investment, R&D, EH&S, financial performance measures, macroeconomic data, plus much more. To order, visit http://store.americanchemistry.com/. Every effort has been made in the preparation of this weekly report to provide the best available information and analysis. However, neither the American Chemistry Council, nor any of its employees, agents or other assigns makes any warranty, expressed or implied, or assumes any liability or responsibility for any use, or the results of such use, of any information or data disclosed in this material. Contact us at ACC_EconomicsDepartment@americanchemistry.comMACROECONOMY & END-USE MARKETS

ENERGY
CHEMICALS
Note On the Color Codes
Yellow – between 8 and 12 positives
Red – 7 or fewer positivesFor More Information
* All content is copyrighted by Industry Intelligence, or the original respective author or source. You may not recirculate, redistrubte or publish the analysis and presentation included in the service without Industry Intelligence's prior written consent. Please review our terms of use.


