July 7, 2023
(press release)
–
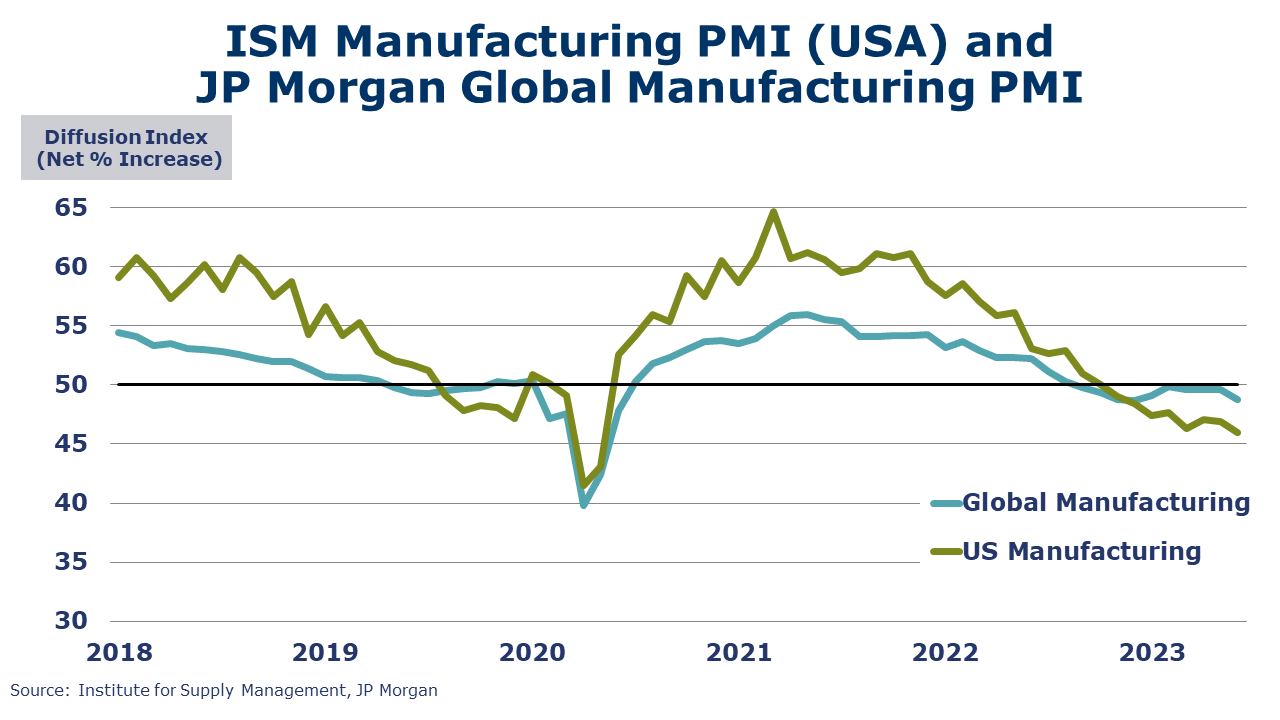
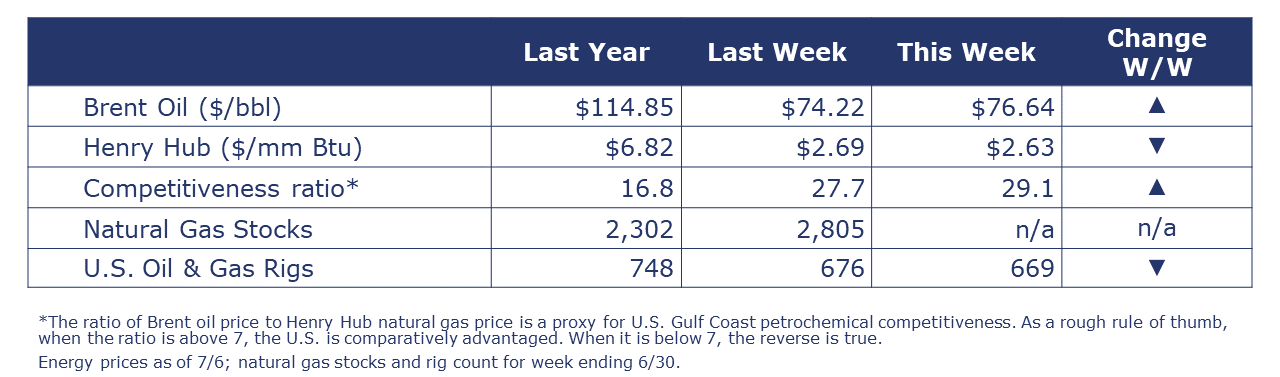
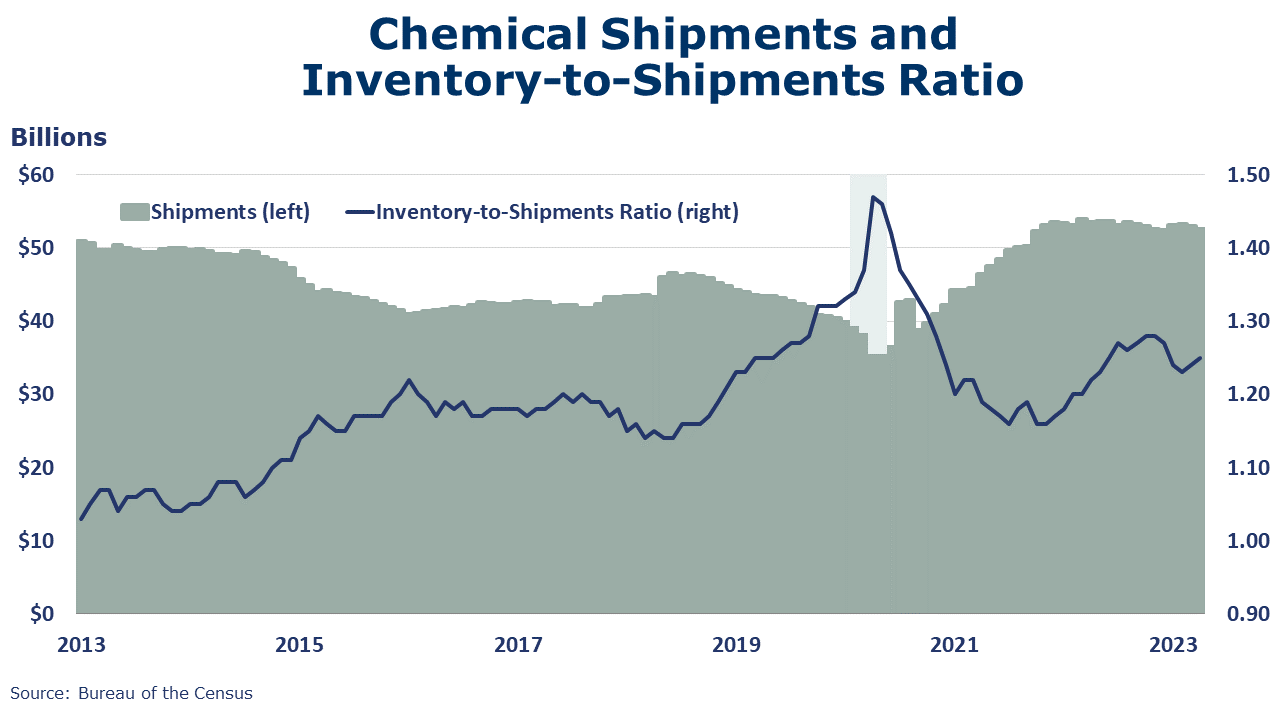
Running tab of macro indicators: 12 out of 20 The highly-anticipated jobs report showed that nonfarm payrolls expanded by 209,000 in June, coming in lower than expected for the first time in more than a year. In addition, May job gains were downwardly revised. Manufacturing employment rose by 7,000, more than reversing a decline in May. Staffing in “temporary help services” fell in June, however, down for the fourth of the past five months. Employment in retail, wholesale, and transportation were also lower. Average hourly earnings for all employees rose 4.4% Y/Y. The average work week ticked higher to 34.4 hours. The unemployment rate edged lower to 3.6% (near its 50-year low) as the number of people reporting they are unemployed as a share of the labor force declined. The labor force ticked higher, but the share of working age adults participating in the labor force remained unchanged, still down from pre-pandemic levels. Job openings fell by 500,000 to 9.82 million in May, but the decline only partially offset April’s gain. May’s job openings remained slightly ahead of the level in March. There were 1.6 job openings for every unemployed person, the lowest ratio in more than a year and a half. The quit rate ticked higher to 2.6% of employment, but remains below year ago levels, suggesting workers are less willing to make a voluntary move. New jobless claims rose by 12,000 to 248,000 during the week ending 1 July. Continuing claims fell by 13,000 to 1.72 million, and the insured unemployment rate for the week ending 24 June was unchanged at 1.2%. The U.S. trade deficit in goods decreased (-6.1%) in May. Both exports and imports of goods were down, with imports falling more than exports (-2.7% versus -0.6%, respectively). For exports, leading the decline were food and beverages (-14.2%) and industrial supplies (-3.0%). For imports, leading the decline were consumer goods (-7.3%) and industrial supplies (-5.9%). Light vehicle sales increased by 0.6 million to 15.7 million (SAAR) in June. Sales were higher in both passenger cars and light trucks. Sales were ahead of last June’s 13 million (SAAR) pace but remained below pre-pandemic levels as some remaining shortages of materials and higher lending rates constrain the market. The ISM Services PMI® rose 3.6 points to 53.9% in June, indicating continued expansion in the U.S. services sector. Except for a contraction in December, services have grown in 36 of the last 37 months. June’s expansion was due mostly to the increase in business activity, new orders, and employment. Increased capacity, backlog reduction, and continued improvements in logistics impacting delivery times (resulting in a decrease in the Supplier Deliveries Index). The ISM Manufacturing PMI® signaled contraction in US manufacturing for an eight consecutive month. The headline index fell 0.9 points to 46.0, its lowest reading in three years. A reading above 50 indicates expansion, while a reading below 50 suggests contraction. Production, new orders, export orders, imports, order backlogs, inventories, and employment all contracted in June. Supplier deliveries, a measure of the slack in the distribution system, were faster. Customers’ inventories were deemed to be “too low” a shift from May when customers’ inventories were felt to be “too high”. The JP Morgan Global PMI fell to its lowest level in six months in June, down 0.8 points to 48.8, signaling continued contraction in global manufacturing activity. The index has been below 50 for ten straight months. Only ten out of 29 nations saw output expand last month (including China and India). Factory output, new orders, and new export orders declined at a faster rate. Expectations for future output were less optimistic. Headline factory orders rose 0.3% in May, following a similar increase in April. Orders were higher for construction materials, motor vehicles & parts, aircraft, and consumer durable goods. Core business orders (nondefense capital goods, excluding aircraft) rose 0.7%. Manufacturing shipments rose 0.3% in May, following declines in March and April. Unfilled orders, a measure of the manufacturing pipeline, rose 0.8%. Finally, manufacturing inventories eased by 0.2%, partially reversing a 0.3% gain in April. Inventories of finished goods were higher but offset by declining inventories of work in progress and materials & supplies. The inventories-to-sales ratio edged lower from 1.50 in April to 1.49 in May. A year ago, the I/S ratio was 1.46. Oil prices were higher compared to a week ago as Saudi Arabia announced plans to extend its previously announced 1 M bpd into August and Russia committed to lowering its oil exports by 500,000 bpd in August. U.S. natural gas prices were slightly lower as estimates of June’s natural gas production (102 BCF/day) were just below all-time highs. The combined oil and gas rig count fell for a ninth consecutive week, down by seven to 669. Since the beginning of the year, the rig count has fallen by more than 100. Indicators for the business of chemistry bring to mind a red banner. According to data released by the Association of American Railroads, chemical railcar loadings were up to 32,548 for the week ending 1 July. Loadings were down 5.0% Y/Y (13-week MA), down (4.5%) YTD/YTD, and have been on the rise for 9 of the last 13 weeks. Within the details of the ISM Manufacturing PMI® report, chemicals was among the 11 industries reporting contraction. Contraction was noted in new orders, production, employment, inventories, imports and order backlogs. Chemical customers’ inventories were deemed to be “too high”. Supplier deliveries were faster for chemical industry respondents. Comments from respondents included, “Customer orders have definitely slowed down. Our company thought the second half of 2023 would be better than the first half, but this doesn’t seem to be the case.” Chemical shipments fell for a third consecutive month, down 0.4% to $52.3 billion. Higher shipments of coatings and adhesives were more than offset by lower shipments of agricultural chemicals and other chemical products. Chemical inventories were flat in May, following a 0.3% gain in April. Higher inventories of agricultural chemicals offset lower coatings & adhesives inventories. Inventories of other chemical products were flat. Compared to a year ago, chemical inventories were off 1.7% Y/Y while shipments were down 2.4% Y/Y. The inventories-to-sales ratio (I/S ratio) for chemicals edged higher from 1.25 in April to 1.26 in May. A year ago, the I/S ratio was 1.23. Production of soda ash rose 4.4% to 906 thousand tons in April, a level up 6.5% Y/Y. Stocks rose 8.2% over March to 250 thousand tons at the end of the month, an 8-day supply. Ending stocks were up 5.9% Y/Y. Following gains in March and April, chemical industry construction spending eased by 2.1% in May to $32.8 billion. Chemical construction spending was up 10.0% Y/Y. The banner colors represent observations about the current conditions in the overall economy and the business chemistry. For the overall economy we keep a running tab of 20 indicators. The banner color for the macroeconomic section is determined as follows: Green – 13 or more positives For the chemical industry there are fewer indicators available. As a result, we rely upon judgment whether production in the industry (defined as chemicals excluding pharmaceuticals) has increased or decreased three consecutive months. ACC members can access additional data, economic analyses, presentations, outlooks, and weekly economic updates through ACCexchange. In addition to this weekly report, ACC offers numerous other economic data that cover worldwide production, trade, shipments, inventories, price indices, energy, employment, investment, R&D, EH&S, financial performance measures, macroeconomic data, plus much more. To order, visit http://store.americanchemistry.com/. Every effort has been made in the preparation of this weekly report to provide the best available information and analysis. However, neither the American Chemistry Council, nor any of its employees, agents or other assigns makes any warranty, expressed or implied, or assumes any liability or responsibility for any use, or the results of such use, of any information or data disclosed in this material. Contact us at ACC_EconomicsDepartment@americanchemistry.com.MACROECONOMY & END-USE MARKETS
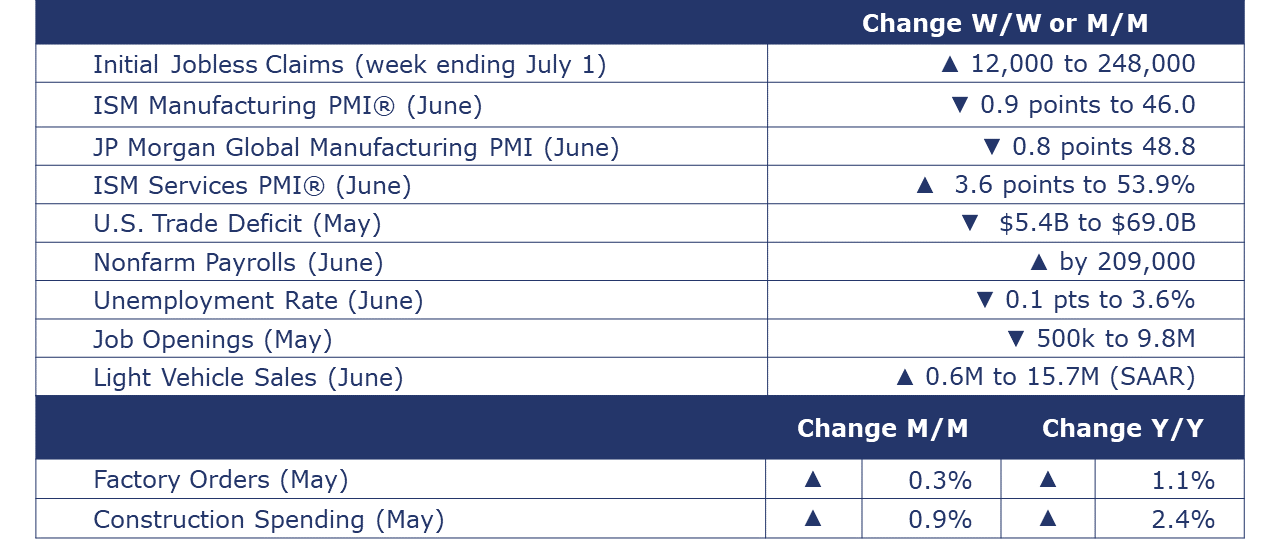
Construction spending rose 0.9% in May, largely on gains in single-family residential construction. Private nonresidential construction spending was lower, as continued strong gains in manufacturing construction were offset by lower spending in commercial, power, and other segments. Publicly funded construction edged slightly higher. Compared to a year ago, overall construction spending was up 2.4%, led by manufacturing construction which was up 76.9% Y/Y. Within manufacturing, the CHIPS Act has boosted spending on computer/electronic manufacturing (including semiconductors) and it has surged over the past year.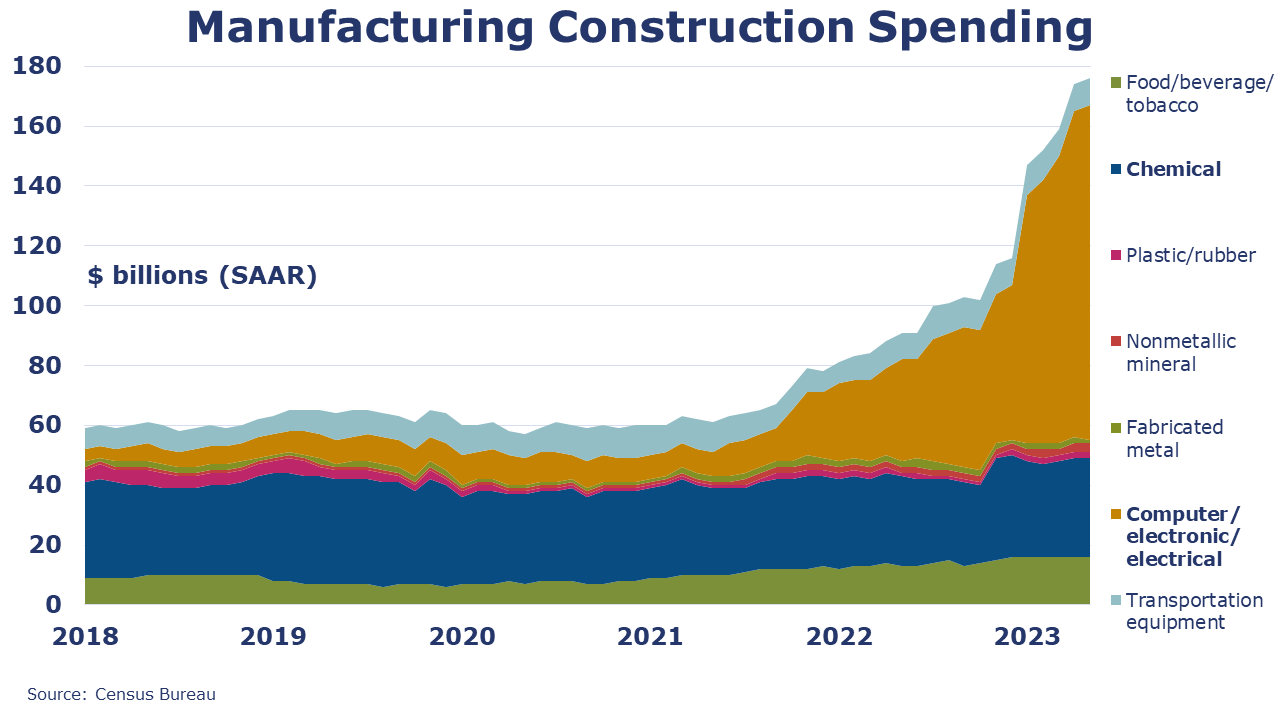
ENERGY
CHEMICALS

Note On the Color Codes
Yellow – between 8 and 12 positives
Red – 7 or fewer positivesFor More Information


* All content is copyrighted by Industry Intelligence, or the original respective author or source. You may not recirculate, redistrubte or publish the analysis and presentation included in the service without Industry Intelligence's prior written consent. Please review our terms of use.


