MACROECONOMY & END-USE MARKETS
Running tab of macro indicators: 11 out of 20
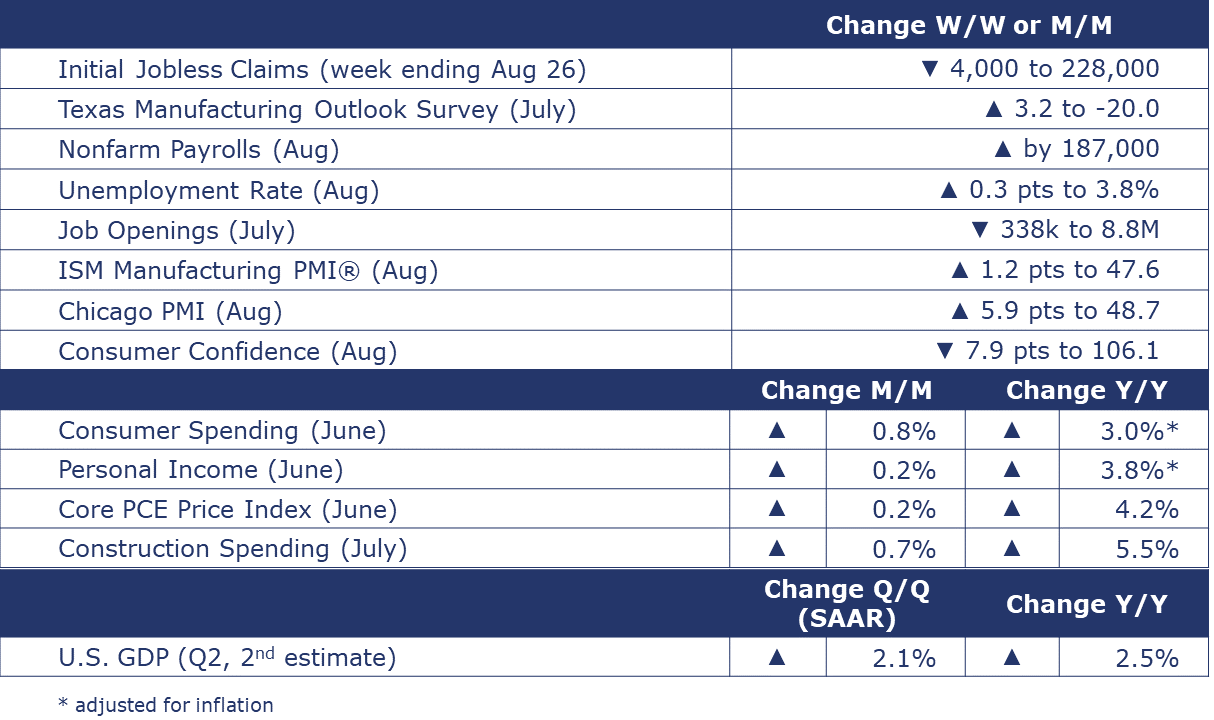
The number of new jobless claims fell by 4,000 to 228,000 during the week ending August 26. Continuing claims increased by 28,000 to 1.725 million, and the insured unemployment rate for the week ending August 19 was up 0.1% to 1.2%.
Nonfarm payrolls expanded by 187,000 in August, a little higher than expected and higher than the previous two months. Average hourly earnings for all employees rose 4.3% Y/Y, a pace slightly lower than last month. There were broad gains across most industries (except mining & logging, transportation & warehousing, and information). Manufacturing employment rose by 16,000. Employment in bellwether temporary help services continued to decline. Despite the gains in August, employment growth has slowed since the beginning of the year. The slowing pace of employment growth may give the Fed cover to hold interest rates steady. The unemployment rate rose from a near 50-year low of 3.5% in July to 3.8% in August. The increase reflected a large gain in the civilian labor force of which only a portion were absorbed into the ranks of employed. As a result, the number of unemployed people rose at a faster pace. The labor force participation rate rose to 62.8%, the highest since the pandemic began.
Job openings continued to slide in July, down for the third consecutive month to 8.8 million. It was the lowest number of openings since March 2021 when COVID vaccines were rolling out. It was a larger decline than expected and June’s openings were revised downward. There were 1.5 job openings for every unemployed person, down slightly from June and down from 2.0 at the end of last year. Hiring also slowed as did voluntary quits, suggesting more caution among existing job holders.
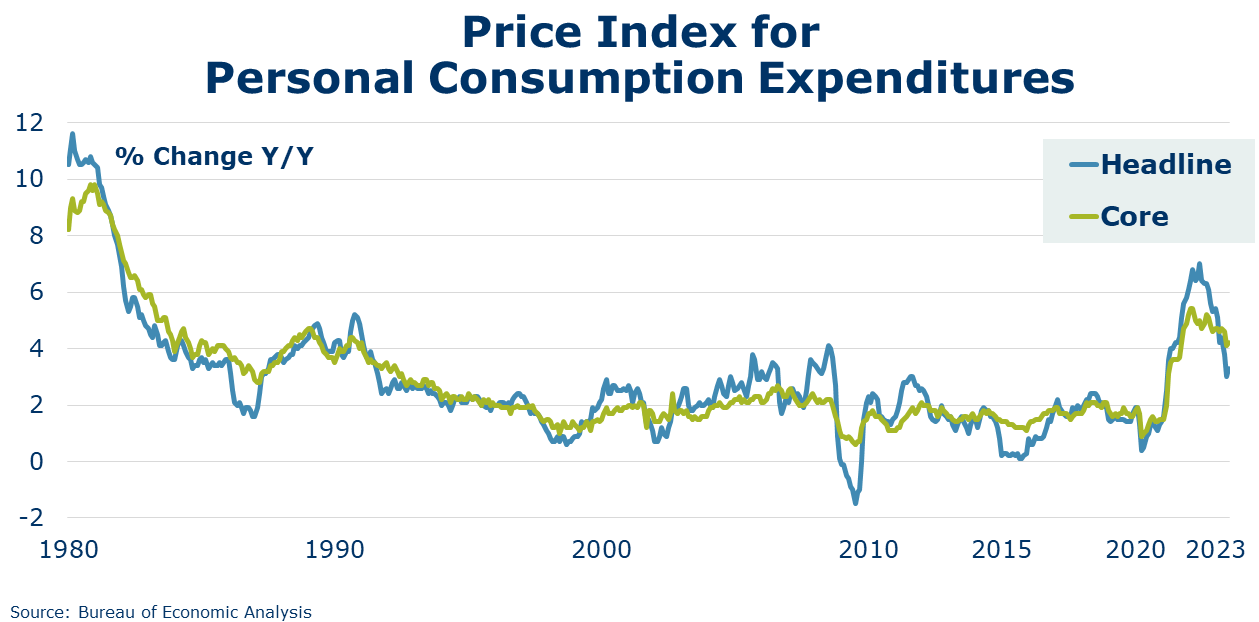
Consumer spending surged in July, up 0.8%. Consumer spending was higher on both goods and services. Personal income rose by 0.2%. Compared to a year ago, real disposable personal income grew by 3.8% while real consumer spending rose by 3.0% Y/Y. Income growth has slowed while the trend in spending has accelerated. That can only go on for so long. The headline PCE price index rose 3.3% Y/Y while the core PCE price index (excluding food and energy) rose 4.2% Y/Y. Both measures were slightly higher than last month, but looking at the most recent three months, price pressures have moved closer to the Fed’s 2% target.
The Conference Board’s Consumer Confidence Index® declined in August to 106.1 from a downwardly revised 114.0 in July. Consumers’ assessment of present and short-term outlook for economic and labor market conditions fell. Concerns about family finances are growing as consumers are less confident about future business conditions, job availability, and incomes. The Expectations Index—is right at a level that historically signals a recession within the next year. Plans to purchase autos and appliances continued to trend upward but plans to buy homes—more in line with rising interest rates—continued to trend downward.
Construction spending rose by 0.7% in July as gains in private residential and nonresidential more than offsetting a decline in publicly funded construction spending. There were continued gains in spending towards new single-family, commercial, and manufacturing projects. Compared to a year ago, construction spending was up 5.5%.
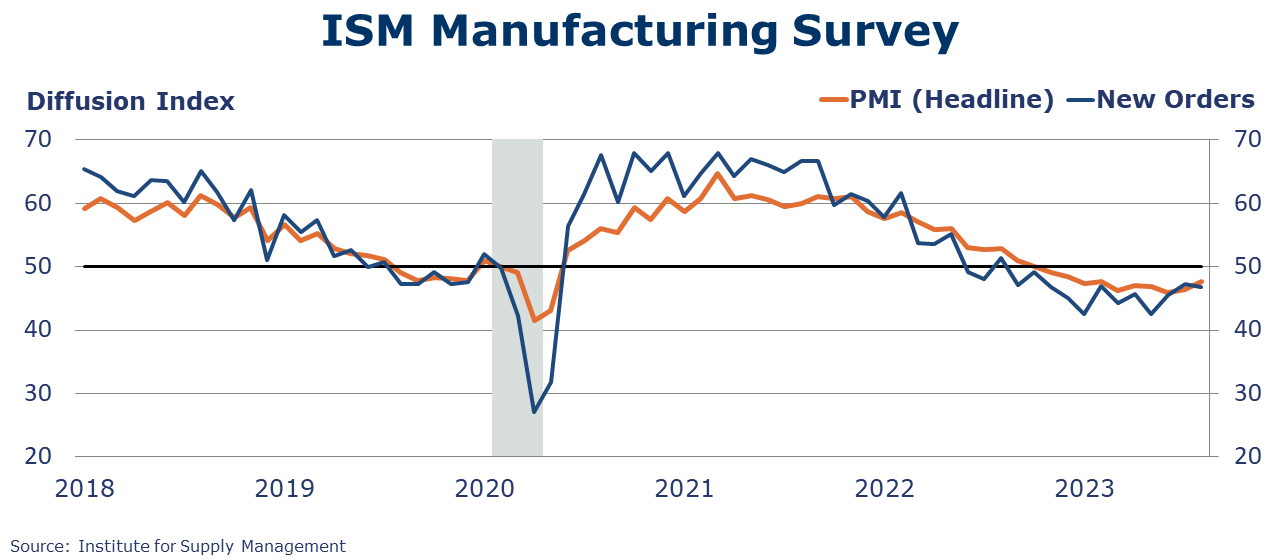
The ISM Manufacturing PMI® rose by 1.2 points to 47.6 in August but signaled contraction for a tenth consecutive month. New orders contracted at a faster pace, as did inventories. Production, however, was neutral (neither expanding nor contracting). Customer inventories were assessed to be “too low”. Supplier deliveries continued to be faster, likely reflecting a combination of slower demand and supply chain improvements. Five of the 18 manufacturing industries covered reported growth in August, including printing, transportation equipment, food & beverage, petroleum products, and miscellaneous manufacturing.
Real gross domestic product (GDP) increased at an annual rate of 2.1% in the second quarter of 2023 according to the "second" estimate released by the Bureau of Economic Analysis. In the first quarter, real GDP increased 2.0%.
ENERGY
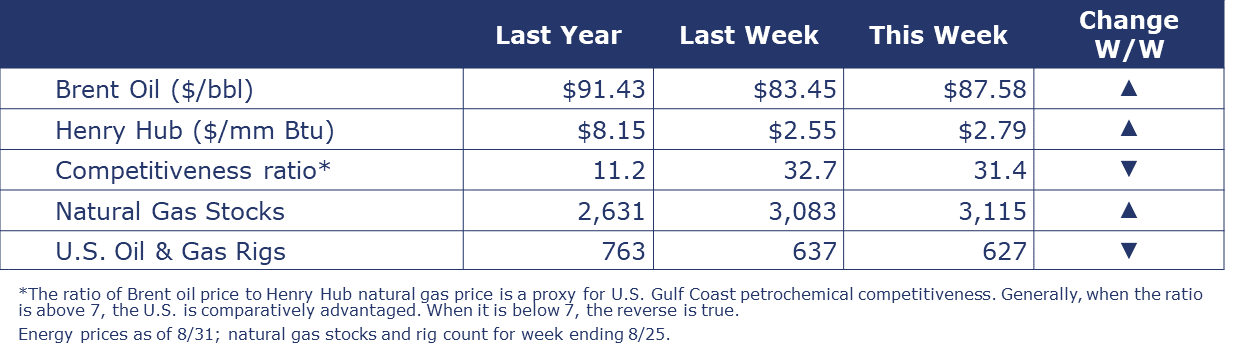
Oil prices rose this week as supply concerns moved to center stage. There was a large drawdown in U.S. crude inventories last week against the backdrop of a potential extension of OPEC+ production cuts. Saudi Arabia is expected to announce within the next few days its decision whether to extend production cuts into October. U.S. natural gas prices also moved higher this week on a hot Labor Day week forecast and a lower-than-expected build in natural gas inventories. Inventories remain 8.7% higher than normal for this week in the year, however. The combined oil and gas rig count fell by 10 to 627 at the end of last week.
CHEMICALS
Indicators for the business of chemistry bring to mind a red banner.

According to data released by the Association of American Railroads, chemical railcar loadings were down to 31,427 for the week ending August 26. Loadings were down 3.6% Y/Y (13-week MA), down (5.2%) YTD/YTD, and have been on the rise for 8 of the last 13 weeks.
Details in the ISM Manufacturing PMI® report indicate the chemical industry continued to contract in August with declines in chemical industry production, new orders, inventories, export orders, and imports. Order backlogs increased. Customer inventories were assessed as “too low”. Among the comments from a chemical industry respondent, “Demand still weak. Customer inventories are getting depleted; however, we are not seeing a real uptick in demand. General supply conditions are softening.”
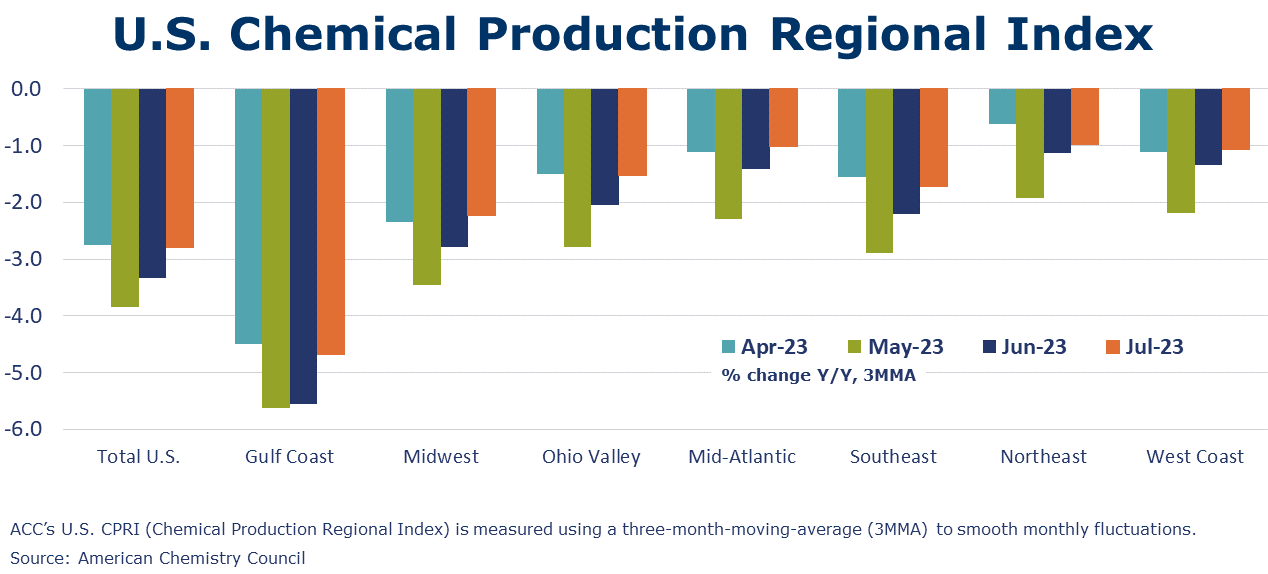
ACC’s U.S. Chemical Production Regional Index (U.S. CPRI) was essentially flat in July, up just 0.1% compared to June and down 2.8% Y/Y. The U.S. CPRI, measured on a 3MMA basis to reduce month-to-month volatility, showed improvement in production in the Gulf Coast, Midwest, Ohio Valley, and Southeast regions. Production was flat in the Mid-Atlantic and lower in the Northeast and West Coast regions. Increased output of coatings, adhesives, other specialty chemicals, fertilizers, crop protection chemicals, and consumer products was offset by weakness in organic and inorganic chemicals, plastic resins, synthetic rubber, and manufactured fibers.
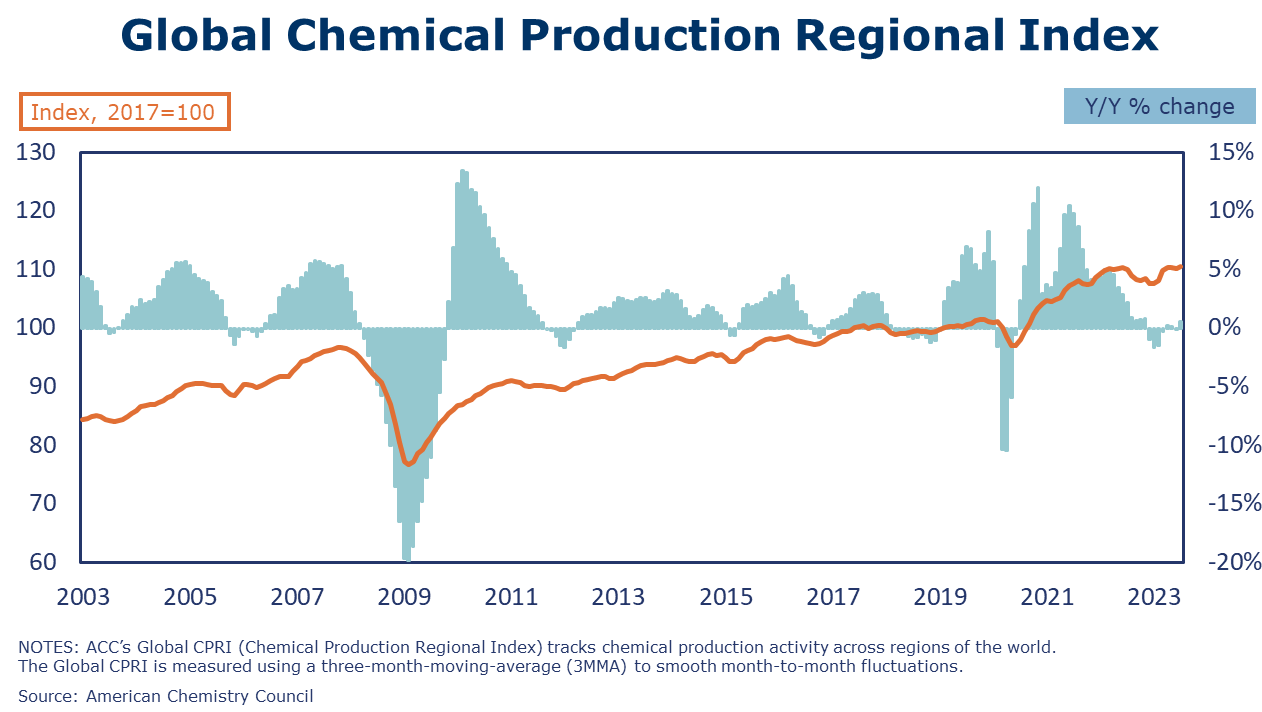
After a brief pause in June (-0.1%), the ACC Global Chemical Production Regional Index (Global CPRI) bounced back by 0.4% in July. All regions recorded growth except for North America with the most significant increases in China, Japan, Germany, France, the Netherlands, and Russia. Global output is up in all segments with agricultural and consumer products leading the growth. Global chemicals production growth was up 0.6% Y/Y.
Chemical and pharmaceutical employment rose by 4,800 (0.5%) in September. The number of production workers rose by 2,700 and supervisory and non-production employment rose by 2,100. The average work week rose by 42 minutes to 41.9 hours. As a result, the total labor input in chemical & pharmaceutical manufacturing rose by 2.2%, suggesting that output rose in August. This conflicts with the ISM report that suggests the chemical industry contracted in August. Average hourly earnings rose 9.7% Y/Y to $30.18. Compared to a year ago, chemical employment was higher by 7,900 (0.9%).
Chemical industry construction spending rose by 3.9% in July, the fifth consecutive monthly gain. Construction spending was up by 35.6% Y/Y.
Note On the Color Codes
Banner colors reflect an assessment of the current conditions in the overall economy and the business chemistry of chemistry. For the overall economy we keep a running tab of 20 indicators. The banner color for the macroeconomic section is determined as follows:
Green – 13 or more positives
Yellow – between 8 and 12 positives
Red – 7 or fewer positives
There are fewer indicators available for the chemical industry. Our assessment on banner color largely relies upon how chemical industry production has changed over the most recent three months.
For More Information
ACC members can access additional data, economic analyses, presentations, outlooks, and weekly economic updates through ACCexchange.
In addition to this weekly report, ACC offers numerous other economic data that cover worldwide production, trade, shipments, inventories, price indices, energy, employment, investment, R&D, EH&S, financial performance measures, macroeconomic data, plus much more. To order, visit http://store.americanchemistry.com/.
Every effort has been made in the preparation of this weekly report to provide the best available information and analysis. However, neither the American Chemistry Council, nor any of its employees, agents or other assigns makes any warranty, expressed or implied, or assumes any liability or responsibility for any use, or the results of such use, of any information or data disclosed in this material.
Contact us at ACC_EconomicsDepartment@americanchemistry.com.


