MACROECONOMY & END-USE MARKETS
Running tab of macro indicators: 13 out of 20
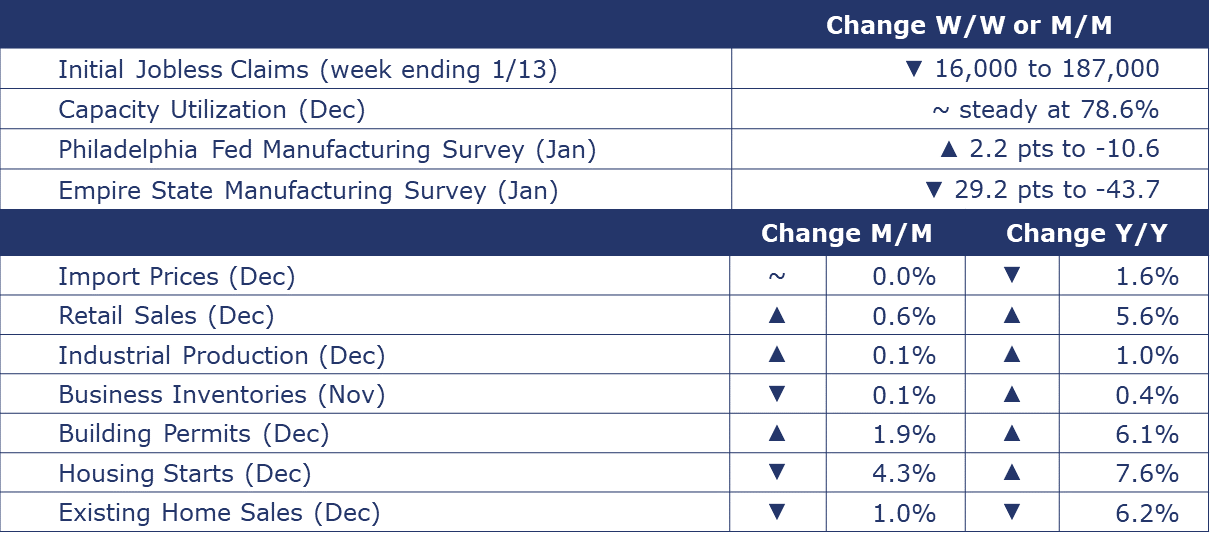
The number of new jobless claims fell by 16,000 to 187,000 during the week ending January 13. This was the lowest level since September 2022. Continuing claims fell by 26,000 to 1.806 million, and the insured unemployment rate for the week ending January 6 was unchanged at 1.2%.
Consumers continued to show up in December. Retail sales were up 0.6%, exceeding expectations. Partially reflecting holiday spending, the largest gains were in general merchandise stores, clothing & accessory stores, and online platforms. There was also growth in sales at motor vehicle & parts dealers as vehicle availability improved following the UAW strike. Compared to a year ago, retail sales were up 5.6%.
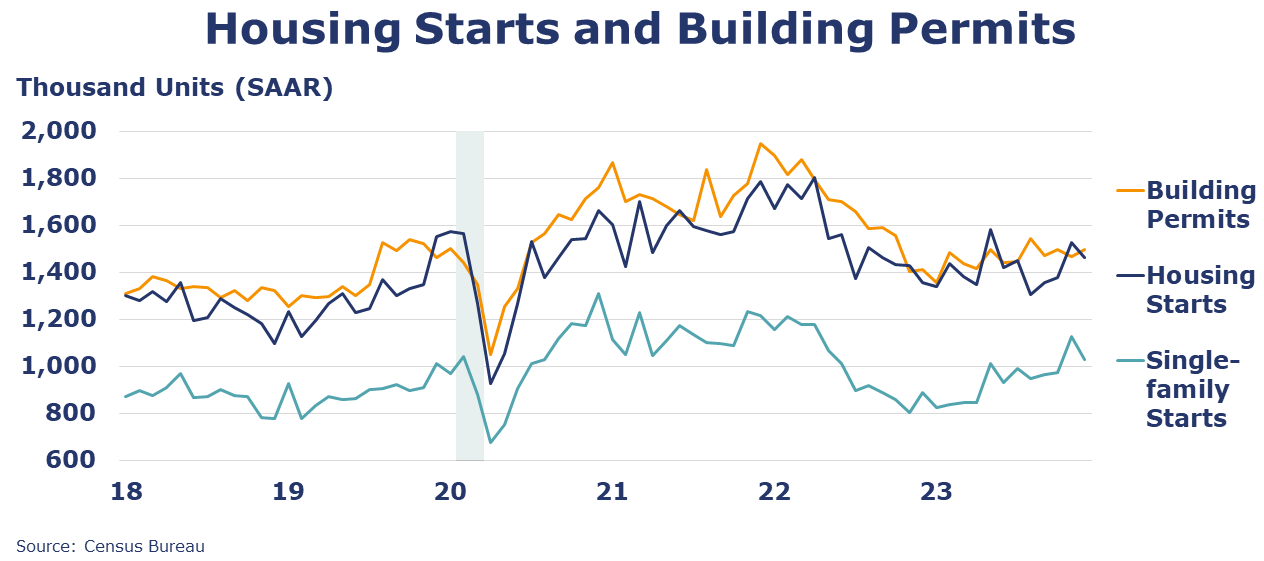
Following a jump in November, housing starts slid in December, down 4.3% to a 1.46 million seasonally adjusted annual pace. This brings the preliminary 2023 total to 1.41 million, down from 1.55 million in 2022, but higher than projected earlier in the year. Chemistry intensive single-family starts fell 8.6%, with declines across all regions, except the West. Forward-looking building permits rose 1.9% with a similar gain in single-family. Compared to a year ago, both building permits and housing starts were up by 6.1% and 7.6%. Separately, the NAHB/Wells Fargo Housing Market Index (HMI) suggests that homebuilders were less pessimistic going into the end of the year. The HMI came in at 44 in December (compared to 37 in November). As with the PMIs, a reading above 50 suggests an expansion in confidence while a reading below 50 suggests pessimism. While buyer traffic remained weak and current sales close to neutral, sales expectations over the next six months were higher. The National Association of REALTORS® (NAR) reported existing home sales fell 1.0% in December to a SAAR of 3.78 million, a level down 6.2% Y/Y. Inventories declined 11.5% resulting in a 3.2-month supply. The median home sale price was up 4.4%. Higher mortgage rates continue to erode homebuilder confidence in the new build market.
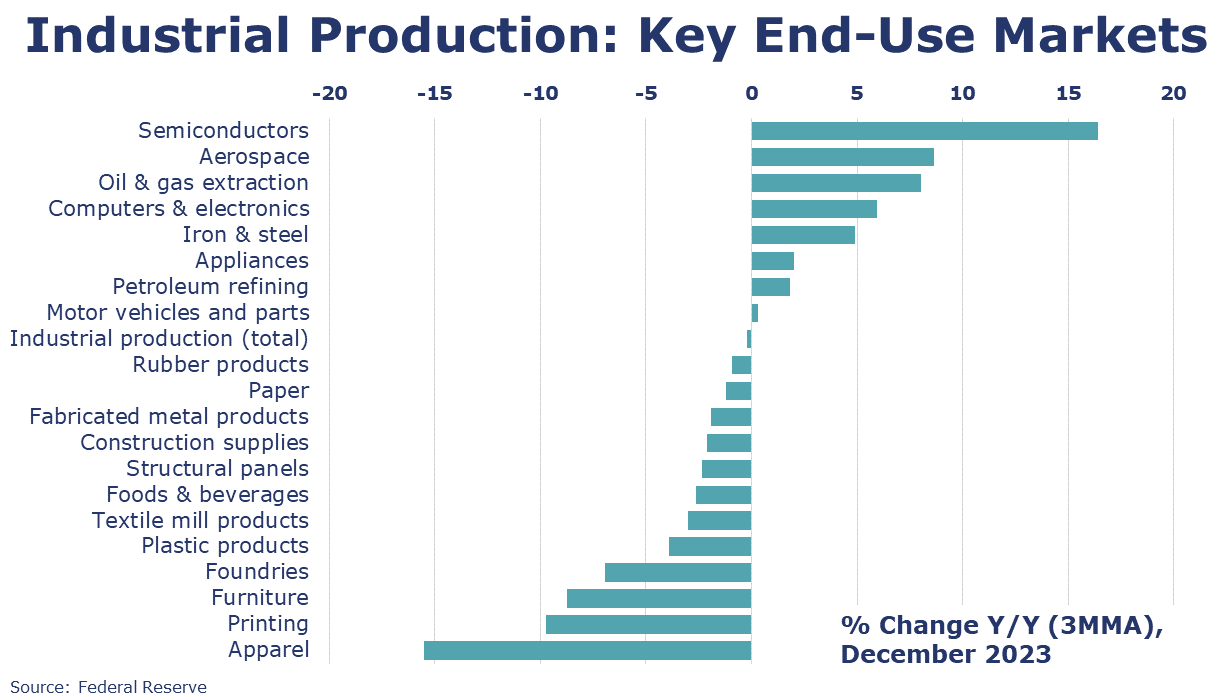
Industrial production edged higher by 0.1% in December. Manufacturing output was also 0.1% higher, with a gain in nondurables offsetting declines among durable goods segments. The largest gains were in furniture, petroleum products, food & beverages, and plastics & rubber products. The largest declines were in wood products, fabricated metal products, machinery, electrical equipment, and paper. Compared to a year ago, overall industrial production was up 1.0% (1.3% for manufacturing). Capacity utilization was steady at 78.6% (compared to November) and was down from 78.9% a year ago. Over the same time period, overall industrial capacity was higher by 1.2%.
Combined business sales for manufacturers, retailers and wholesalers fell 0.1% in November to a level up 0.2% Y/Y. Business inventories were down 0.1% over the month but were 0.4% higher on a Y/Y basis. As a result, the business inventories-to-sales ratio was 1.37 in November, slightly lower than 1.38 which was the ratio over the same time last year.
U.S. import prices were flat in December. Fuel import prices declined for the third month while nonfuel import prices were flat. Imported fuel prices eased 9.4% over 2023 (compared to 15.9% gain over 2022). Overall, the import price index declined 1.6% over 2023. U.S. export prices fell 0.9% in December, the third month of declines. Export prices declined 3.2% over 2023.
Fed Beige Book
A compilation of anecdotal information on the regional economies in the 12 districts, the Beige Book is published eight times per year. Interesting excerpts follow here:
- A majority of the twelve Federal Reserve Districts reported little or no change in economic activity since the prior Beige Book period. Of the four Districts that differed, three reported modest growth and one reported a moderate decline.
- Consumers delivered some seasonal relief over the holidays by meeting expectations in most Districts and by exceeding expectations in three Districts, including in New York, which noted strong holiday spending on apparel, toys, and sporting goods. In addition, seasonal demand lifted airfreight volume from ecommerce in Richmond and credit card lending in Philadelphia.
- Several Districts noted increased leisure travel, and a tourism contact described New York City as bustling.
- Contacts from nearly all Districts reported decreases in manufacturing activity.
- Districts continued to note that high interest rates were limiting auto sales and real estate deals; however, the prospect of falling interest rates was cited by numerous contacts in various sectors as a source of optimism.
- In contrast, concerns about the office market, weakening overall demand, and the 2024 political cycle were often cited as sources of economic uncertainty.
- Overall, most Districts indicated that expectations of their firms for future growth were positive, had improved, or both.
SURVEY OF ECONOMIC FORECASTERS
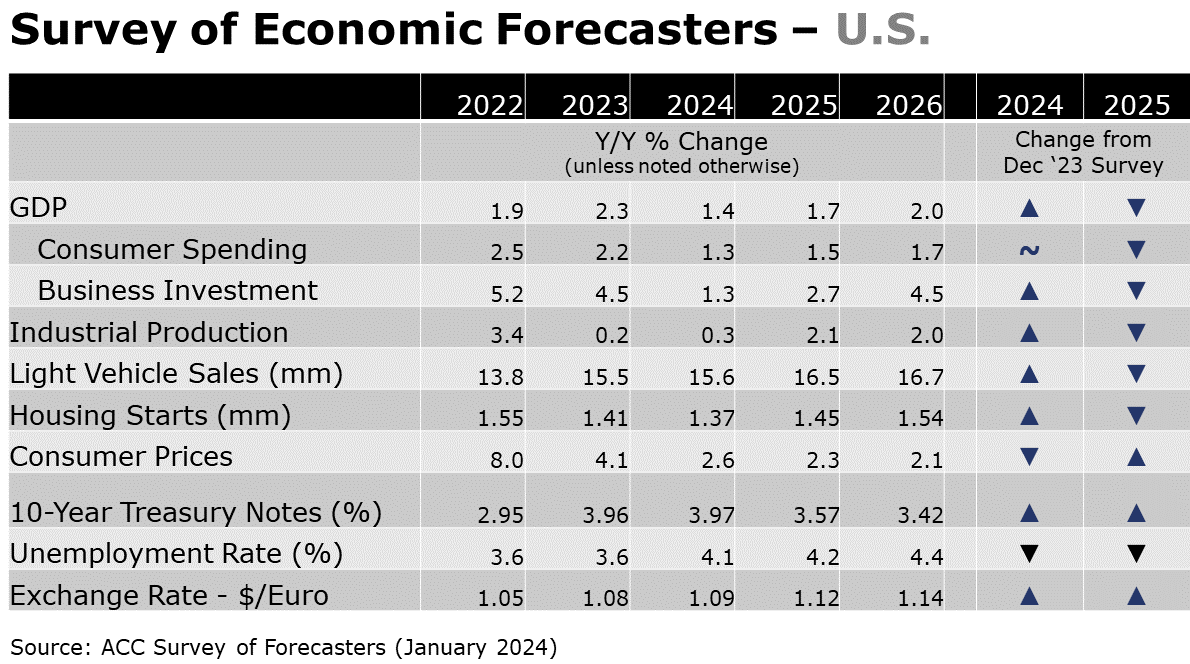
- Heading into the new year, the probability of a recession has fallen, though headwinds to growth persist as higher interest rates continue to dampen demand across the economy and consumers slow their consumption.
- U.S. GDP is expected to grow by 1.4% in 2024 and by 1.7% in 2025.
- Consumer spending growth is expected to downshift to a 1.5% Y/Y pace in 2024 (from 2.2% in 2023) and slow further to a 1.5% gain in 2025.
- Higher borrowing costs and heightened uncertainty are cooling growth in business investment which is expected to decelerate to a 1.3% pace in 2024 before accelerating to a 2.7% gain in 2025.
- Following a 0.2% gain in 2023, we look for industrial production to edge only slightly higher (by 0.3%) in 2024 before strengthening to a 2.1% pace in 2025.
- Following several years of below-trend vehicle sales, availability has improved, but demand is tempered somewhat by higher borrowing costs. As a result, sales of autos and light trucks are expected to grow to 15.6 million in 2024 (still below trend) before rising to a 16.5 million pace in 2025.
- Struggling with high prices, labor costs, and mortgage rates, new homebuilding has found limited support from historically low inventories of existing homes. Housing starts are expected to ease further to 1.37 million in 2024 before rising to a 1.45 million pace in 2025 as mortgage rates come down.
- The unemployment rate is expected to move higher from 50-year lows to average 4.1% in 2024 and 4.2% in 2025.
- Recent data suggests that inflation is slowing, though it remains above the Fed’s target and the Fed has indicated that they are taking a cautious approach to rate cuts. Growth in consumer prices is expected to decelerate to a 2.6% pace in 2024 and 2.3% in 2025.
- Expectations for interest rates (10-year Treasury) were slightly higher for 2024 but easing in 2025 as rate cuts are expected to start in mid-2024.
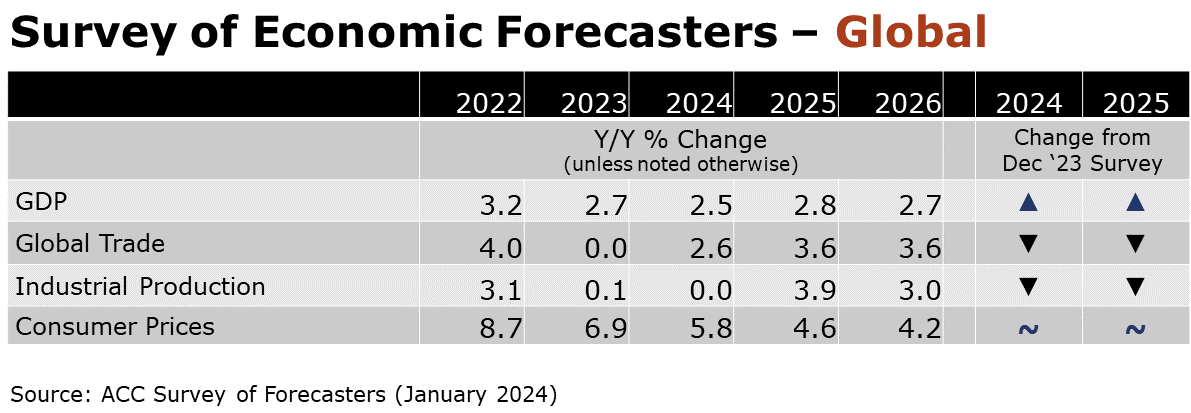
- Our forecast for Global GDP growth was revised up to 2.5% for 2024 and 2.8% for 2025. Global activity is forecast to expand at a 2.7% pace in 2026.
- Global inflation will have increased 6.9% in 2023, a relief from 8.7% in 2022. Inflationary pressures will moderate over the forecast period with a 5.8% pace projected this year (2024) and further easing toward an average 3.9% pace over the 2027-2031 period.
- World trade was flat in 2023 reflecting weakened demand for goods exports. Trade volumes are forecast to recover this year and through 2025.
- Growth in the industrial sector was nearly flat (0.1%) last year (2023). Expectations for expansion in global manufacturing are muted (0% growth expected for 2024) this year coming year but, a recovery is anticipated to emerge by 2025 when annual growth will reach 3.9%.
ENERGY
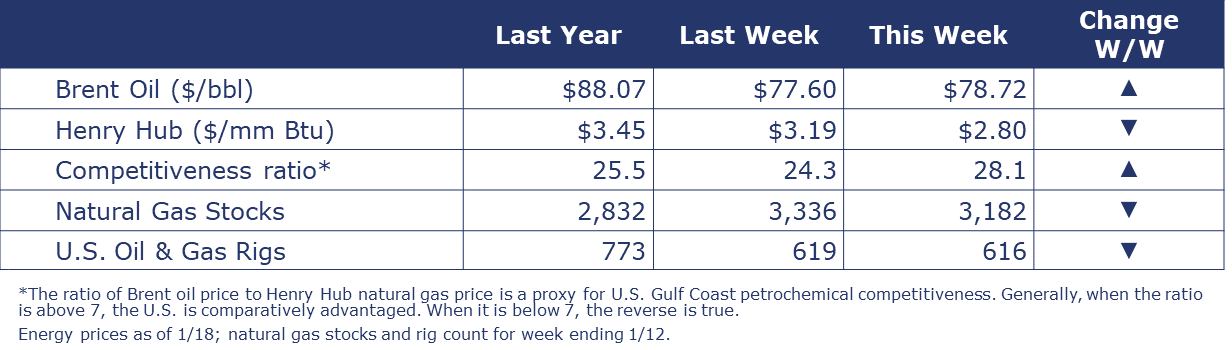
Oil prices were higher compared to a week ago on upwardly revised estimates of oil demand from both IEA and OPEC. After the warmest December on record in many parts of the country that allowed inventories to build, U.S. natural gas prices remained below $3/mmbtu despite frigid temperatures across much of the U.S. this week. The combined oil and gas rig count fell by three to 616.
CHEMICALS
Indicators for the business of chemistry bring to mind a yellow banner.
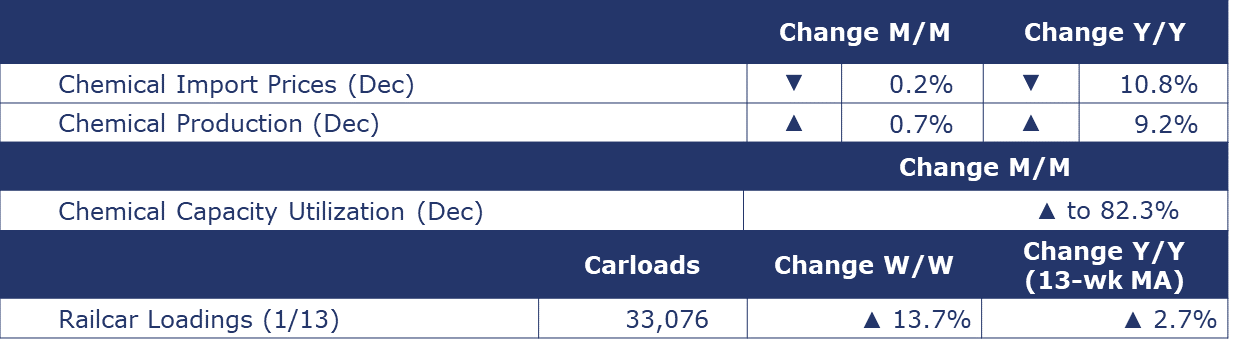
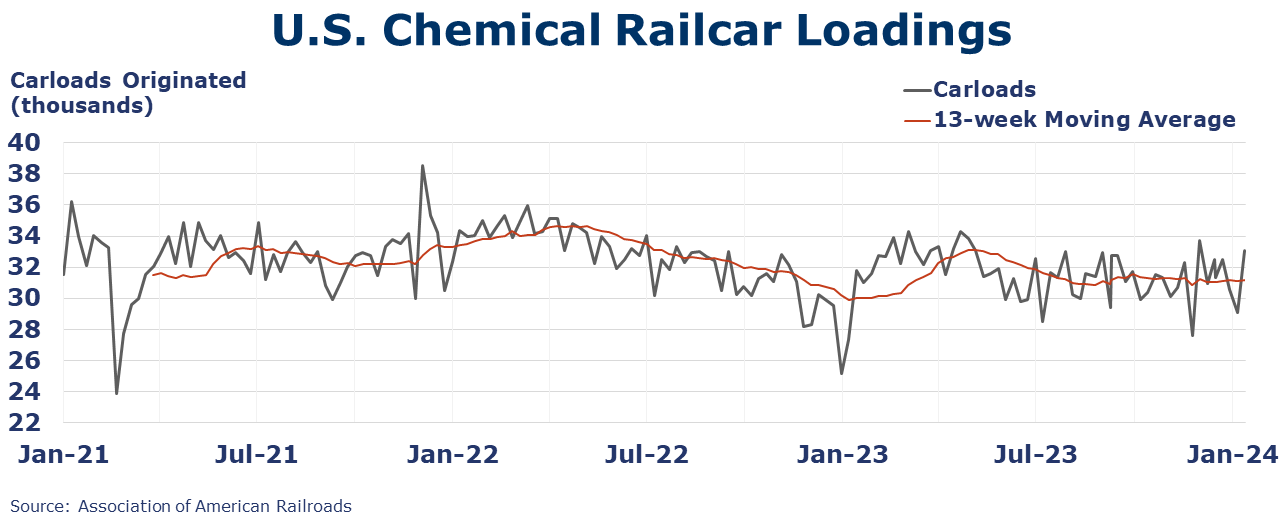
According to data released by the Association of American Railroads, chemical railcar loadings were up to 33,076 for the week ending January 13th. Loadings were up 2.7% Y/Y (13-week MA), up (9.6%) YTD/YTD and have been on the rise for 6 of the last 13 weeks.
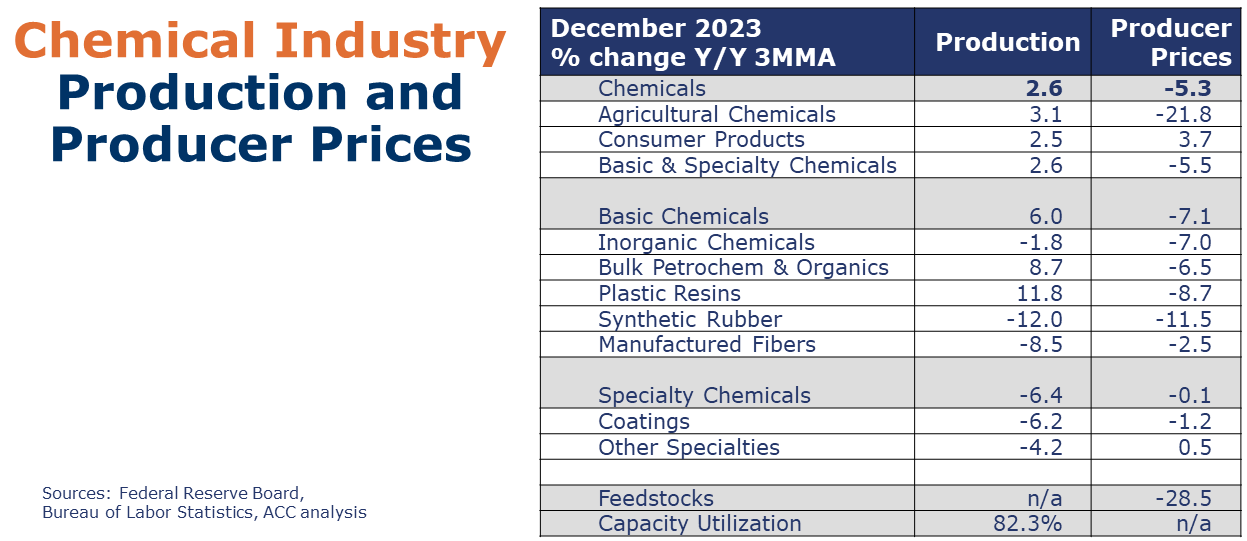
Chemical production ended the year on an upswing with a 0.7% gain in December on the heels of a 1.2% increase in November. Output volumes were higher for organic chemicals, inorganic chemicals, synthetic rubber, manufactured fibers, coatings, and other specialty chemicals. Production of resins and consumer products were lower. Compared to December 2022 when output was constrained due to a late-year weather event, production was up 9.2% Y/Y. Chemical capacity utilization rose to 82.3% up from 73.1% a year ago.
Chemical import prices eased over the last two months of 2023, declining 0.2% in December to a level down 10.8% Y/Y. Chemical export prices held steady in December and were down 11.0% Y/Y.
Note On the Color Codes
Banner colors reflect an assessment of the current conditions in the overall economy and the business chemistry of chemistry. For the overall economy we keep a running tab of 20 indicators. The banner color for the macroeconomic section is determined as follows:
Green – 13 or more positives
Yellow – between 8 and 12 positives
Red – 7 or fewer positives
There are fewer indicators available for the chemical industry. Our assessment on banner color largely relies upon how chemical industry production has changed over the most recent three months.
For More Information
ACC members can access additional data, economic analyses, presentations, outlooks, and weekly economic updates through ACCexchange.
In addition to this weekly report, ACC offers numerous other economic data that cover worldwide production, trade, shipments, inventories, price indices, energy, employment, investment, R&D, EH&S, financial performance measures, macroeconomic data, plus much more. To order, visit http://store.americanchemistry.com/.
Every effort has been made in the preparation of this weekly report to provide the best available information and analysis. However, neither the American Chemistry Council, nor any of its employees, agents or other assigns makes any warranty, expressed or implied, or assumes any liability or responsibility for any use, or the results of such use, of any information or data disclosed in this material.
Contact us at ACC_EconomicsDepartment@americanchemistry.com.


