- 0.2% Chemical Shipments
- 15.3M Light Vehicle Sales (SAAR)
- 3.1% Chemical Exports
MACROECONOMY & END-USE MARKETS
Running tab of macro indicators: 8 out of 20
The U.S. economy added 199,000 jobs in November. Gains were strongest in healthcare, government, manufacturing, and leisure and hospitality. Employment in manufacturing rose by 28,000, reflecting auto workers returning from strike. The unemployment rate edged down 0.2 points to 3.7% in November as the number of unemployed held steady and the labor force count expanded. The labor force participation rate, up 0.1 point to 62.8% in November, has essentially held steady since August. Average hourly earnings were up 0.4% in November and have increased 4.0% over the past 12 months. Wage growth has been gradually moderating toward a sustainable pace.
The Labor Department’s job openings data showed a considerable drop in October. Job openings declined 617,000 to 8.7 million, the lowest level since March 2021. Hires were little changed. Separations (including layoffs, quits, discharges, etc.) were also stable. In manufacturing, both hires and separations continued to decline.
The number of new jobless claims rose by 1,000 to 220,000 during the week ending December 2. Continuing claims fell by 102,263 to 1.6 million, and the insured unemployment rate for the week ending November 25 was down 0.1 percentage point to 1.2%.
Consumer credit growth slowed in October, expanding at a 1.2% annual rate (down from a 3.0% pace in September). Both revolving (credit cards, etc.) and nonrevolving (auto, student loans, etc.) credit slowed.
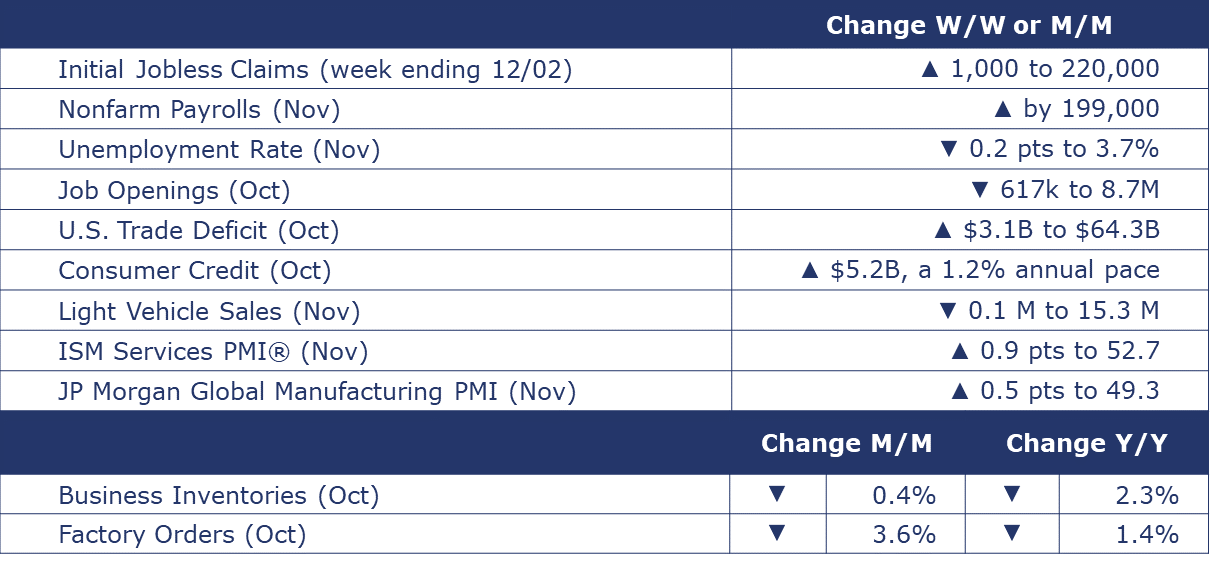
Light vehicle sales edged lower by 100,000 to a 15.3 million seasonally adjusted annual rate (SAAR) in November, with declines in both the passenger car and light truck (including SUVs and minivans) categories. The share of “light trucks” rose to a record 80.5% in November. The share has been steadily increasing for decades.
The U.S. trade deficit in goods and services widened 5.1% up to $64.3 billion in October as U.S. exports fell 1.0% and imports rose 0.2%. Exports of services were the highest on record. Exports of goods declined overall but across sectors it was mixed with gains in industrial supplies and materials and capital goods while exports of consumer goods, autos and auto parts fell. Capital goods exports were the highest on record. Imports of capital goods increased (including gains in computers and drilling and oilfield equipment) while imports of autos fell.
Factory orders fell 3.6% in October, following a 2.3% gain in September. The drop in October reflects a steep decline in civilian aircraft orders in addition to weakness in other categories, including motor vehicles (reflecting the UAW strike), consumer goods, and construction materials and supplies. Core business orders (nondefense capital goods excluding aircraft) declined for a second straight month, down 0.3%. Total factory orders were off 1.4% Y/Y while core business orders were ahead by 0.8% Y/Y. Unfilled orders (a measure of the manufacturing pipeline) rose by 0.3%. Manufacturing shipments fell by 1.4% and inventories edged higher by 0.1%. The inventories-to-sales ratio for manufacturing rose to 1.48 in October from 1.46 in September.
J.P. Morgan’s Global Manufacturing PMI® rose 0.5 points to 49.3 in November. The reading marked a 15th consecutive month of contraction though it moved closer to stability (50). The readings for output, new orders and new export orders declined. Sentiment improved and growth is expected in future output. Employment contracted but at a slower rate. Ten of the 31 countries tracked – including the US, China, and India - saw expansion in production.
Economic activity in the services sector expanded for the 11th consecutive month in November, and it was the 41st month to reflect growth over the past 42 months, according to the ISM Services PMI®. Fifteen of the 17 industries reported growth with the largest gains in agriculture, forestry, fishing and hunting, health care and social assistance, real estate, rental and leasing and arts, entertainment, and recreation. Among those reporting a decline were information, mining, and professional, scientific, and technical services.
Wholesale inventories declined 0.4% in October to levels down 2.3% Y/Y. Inventories were lower across most categories but higher for electrical, machinery and farm products. Sales at the wholesale level fell 1.3% in October to a level down 0.4% Y/Y. The wholesale inventories-to-sales ratio fell to 1.34 in October from 1.37 a year prior.
ENERGY
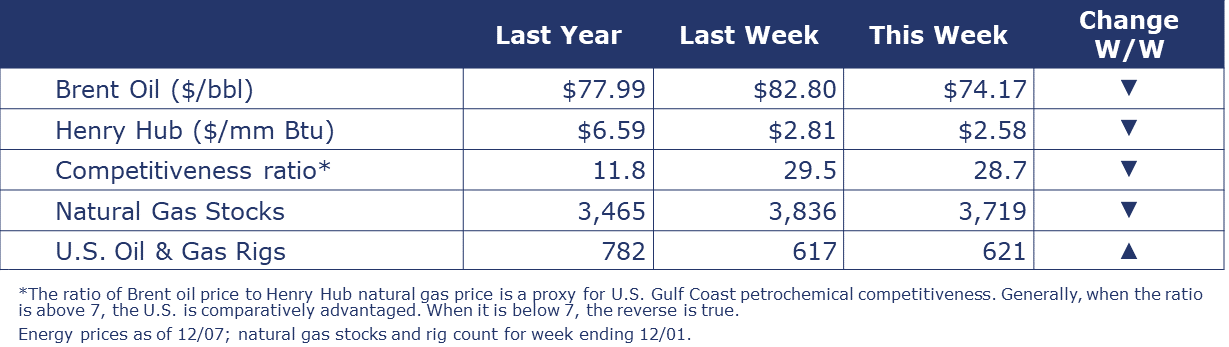
Despite the OPEC+ announcement of more production cuts in Q1, oil prices were lower than last week due to a combination of factors, including a high dollar, record U.S. oil output, and an unexpected build in U.S. gasoline inventories, a sign that demand is flagging. U.S. natural gas prices were also lower compared to a week ago, reflecting ample inventories and milder than usual weather for the beginning of December. The combined oil and gas rig count rose for a third week (up by 4) to 621.
CHEMICALS
Indicators for the business of chemistry bring to mind a red banner.
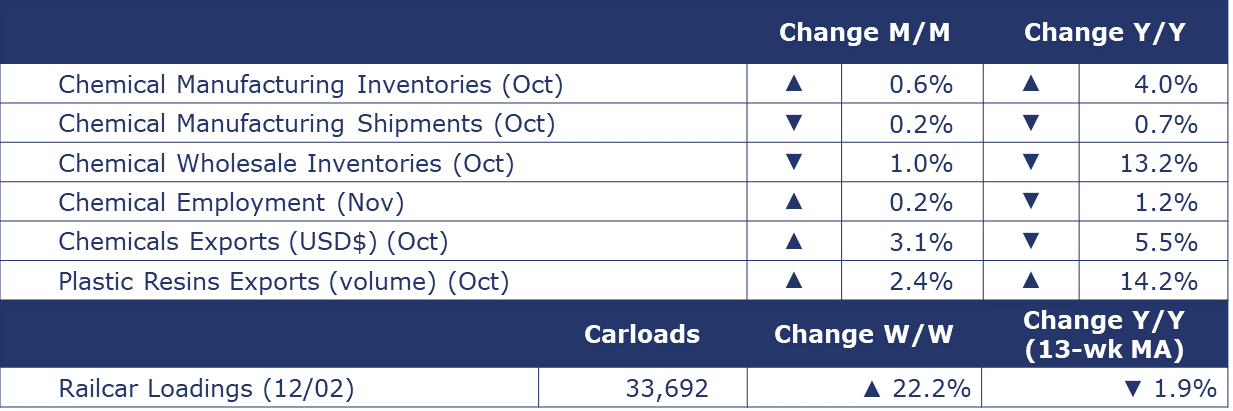
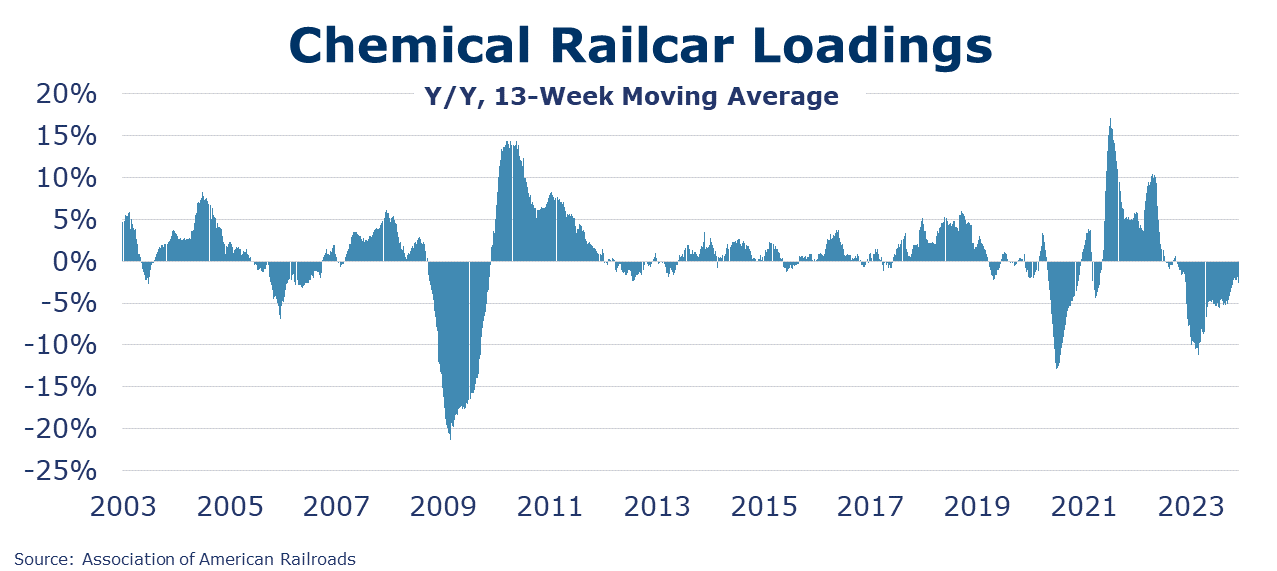
According to data released by the Association of American Railroads, chemical railcar loadings were up to 33,692 for the week ending December 2. Loadings were down 1.9% Y/Y (13-week MA), down (1.3%) YTD/YTD and have been on the rise for 8 of the last 13 weeks.
Chemical industry and pharmaceutical employment fell by 1,800 (0.2%) in November to a level down 1.1% Y/Y. Jobs declined in production, supervisory, and non-supervisory roles. The average workweek rose from 41.4 hours per week in October to 41.5 hours in November. The total labor input into the chemical industry rose in November. Average hourly earnings of non-supervisory and production workers rose at an 8.3% Y/Y pace.
Chemical shipments eased 0.2% to $52.6 billion in October, with declines across all major categories. Chemical manufacturing inventories were 0.6% higher than September levels, the first increase since last April. Shipments were down 0.7% Y/Y while inventories were up 4.0% Y/Y. The inventories-to-sales ratio ticked up from 1.22 in September to 1.23 in October. A year ago, the ratio was 1.28.
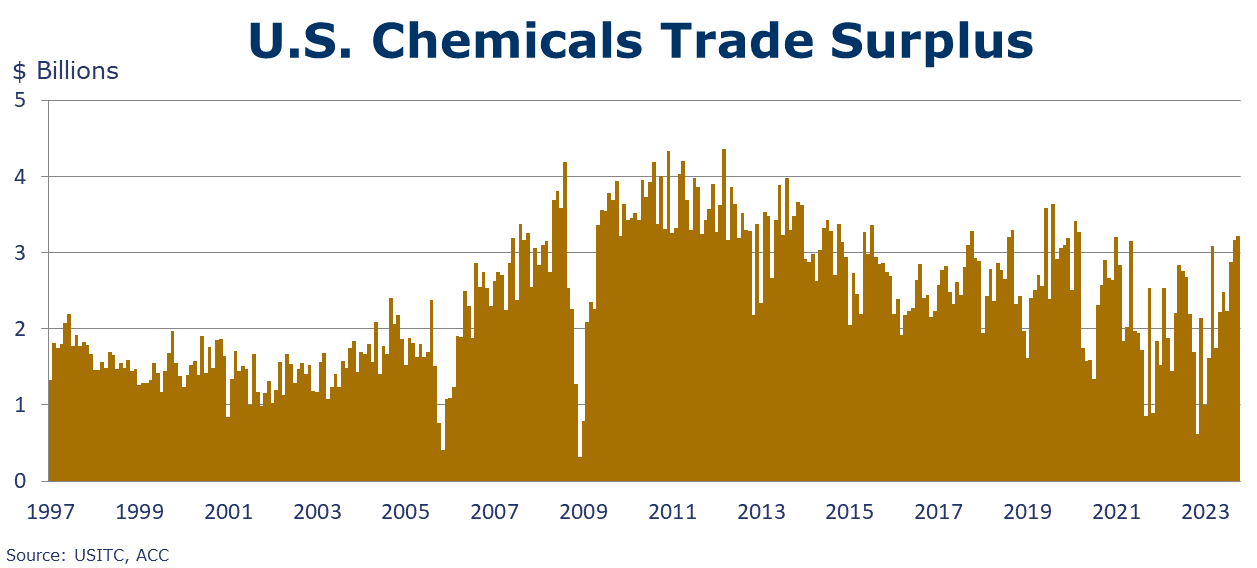
U.S. chemical exports rose by 3.1% to $14.0 billion in October, a level down 5.5% Y/Y and down 8.9% YTD/YTD. Exports of specialties and petrochemicals rose. Exports of plastic resins rose 1.5% to $3.2 billion in October. On a volume basis, plastic resins exports rose 2.4% to 2,085 thousand metric tons, a level up 14.2% Y/Y. U.S. chemical imports increased 3.6% in October reflecting gains in agricultural chemicals, consumer products, inorganics, petrochemical derivatives, adhesives and sealants and coatings. The U.S. chemical trade surplus rose modestly to $3.2 billion in October.
Chemical wholesale inventories fell 1.0% in October, following a 1.2% decline in September. Sales of chemicals at the wholesale level decreased 2.9%. The inventories-to-shipments ratio moved up to 1.14 in October. Inventories were off 13.2% Y/Y while sales were off 9.6% Y/Y.
Note On the Color Codes
Banner colors reflect an assessment of the current conditions in the overall economy and the business chemistry of chemistry. For the overall economy we keep a running tab of 20 indicators. The banner color for the macroeconomic section is determined as follows:
Green – 13 or more positives
Yellow – between 8 and 12 positives
Red – 7 or fewer positives
There are fewer indicators available for the chemical industry. Our assessment on banner color largely relies upon how chemical industry production has changed over the most recent three months.
For More Information
ACC members can access additional data, economic analyses, presentations, outlooks, and weekly economic updates through ACCexchange.
In addition to this weekly report, ACC offers numerous other economic data that cover worldwide production, trade, shipments, inventories, price indices, energy, employment, investment, R&D, EH&S, financial performance measures, macroeconomic data, plus much more. To order, visit http://store.americanchemistry.com/.
Every effort has been made in the preparation of this weekly report to provide the best available information and analysis. However, neither the American Chemistry Council, nor any of its employees, agents or other assigns makes any warranty, expressed or implied, or assumes any liability or responsibility for any use, or the results of such use, of any information or data disclosed in this material.
Contact us at ACC_EconomicsDepartment@americanchemistry.com.


