US chemical railcar loadings for the week ended April 15 totaled 33,206, down 6.7% year-over-year; US Chemical Production Regional Index increased 2.6% in March, reflecting recovery from a challenging Q4: ACC

Sample article from our Chemicals Industry

April 21, 2023 (press release) –

1.2% Leading Economic Index®
0.8% Housing Starts
2.3% U.S. CPRI (Y/Y)

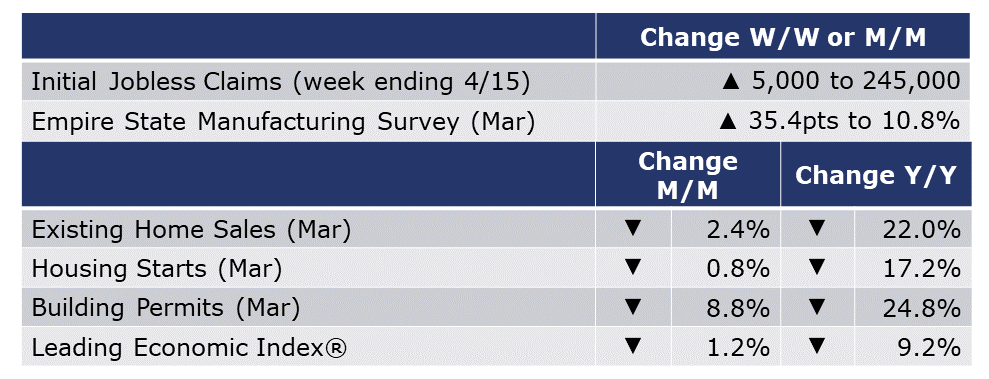
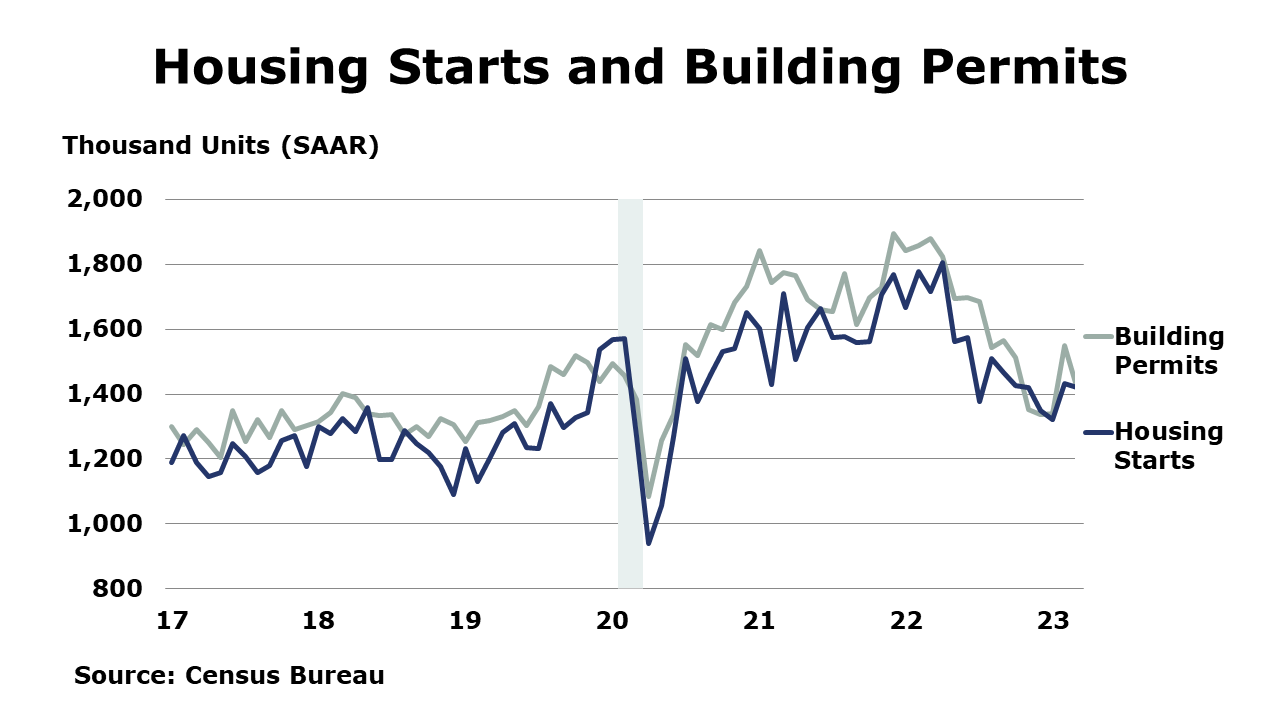
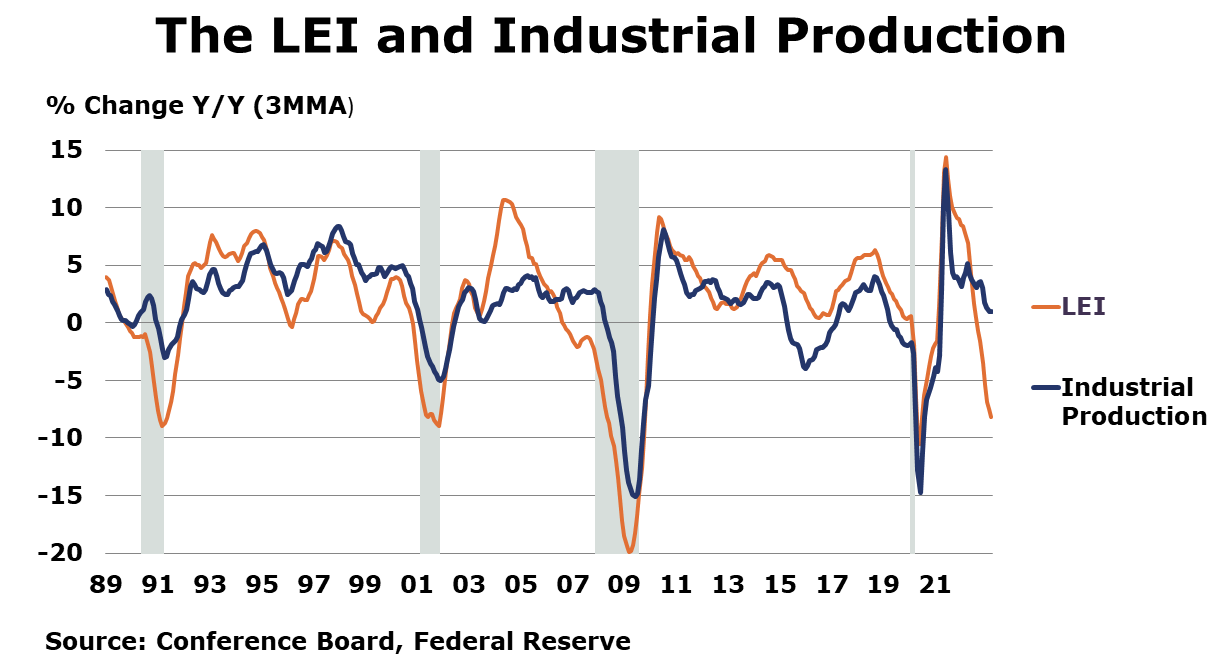
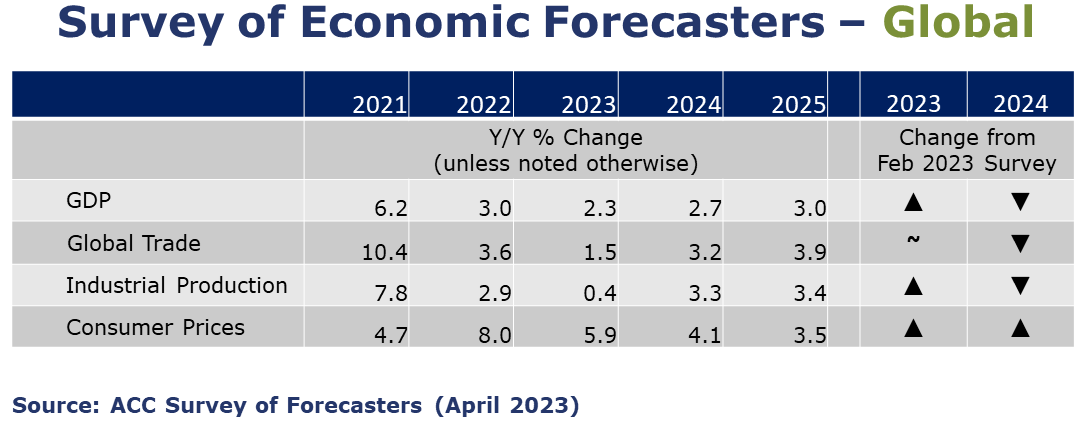
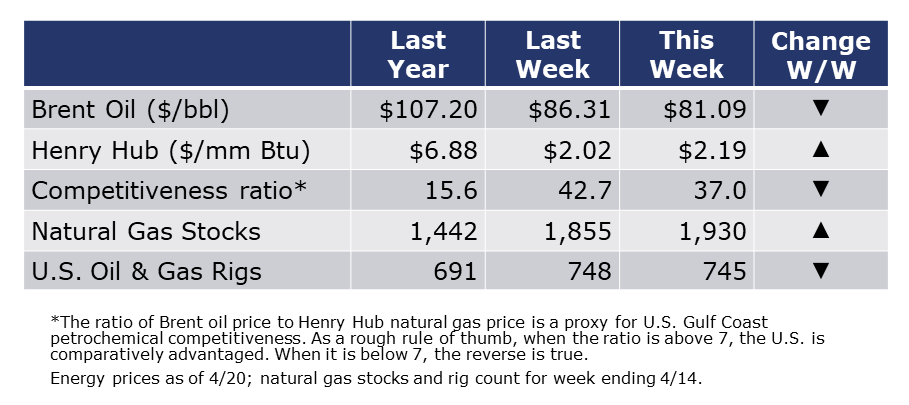
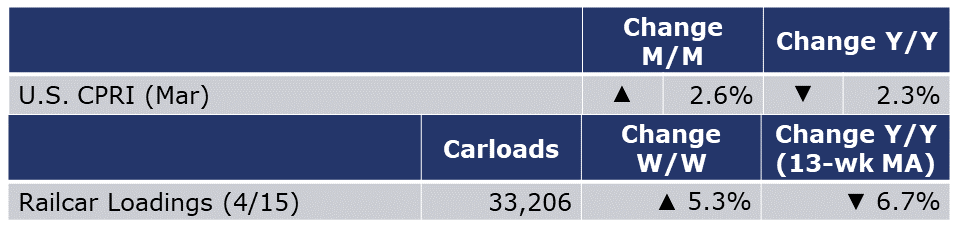
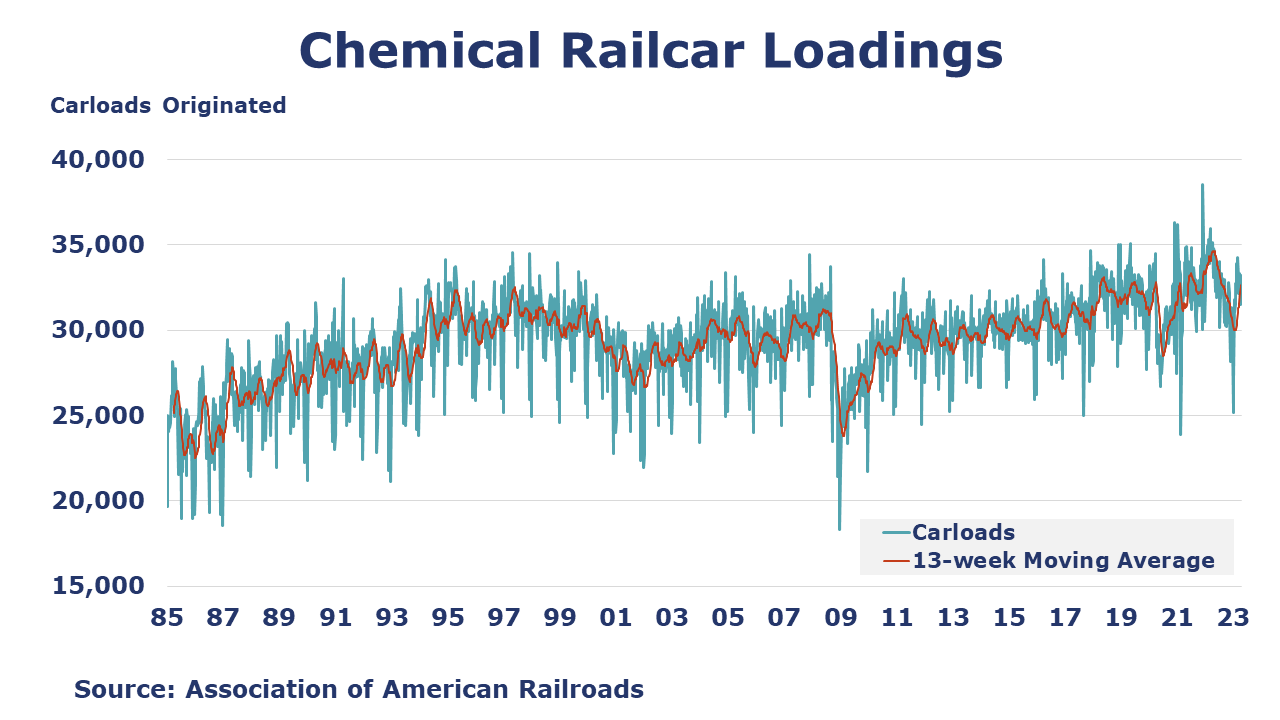
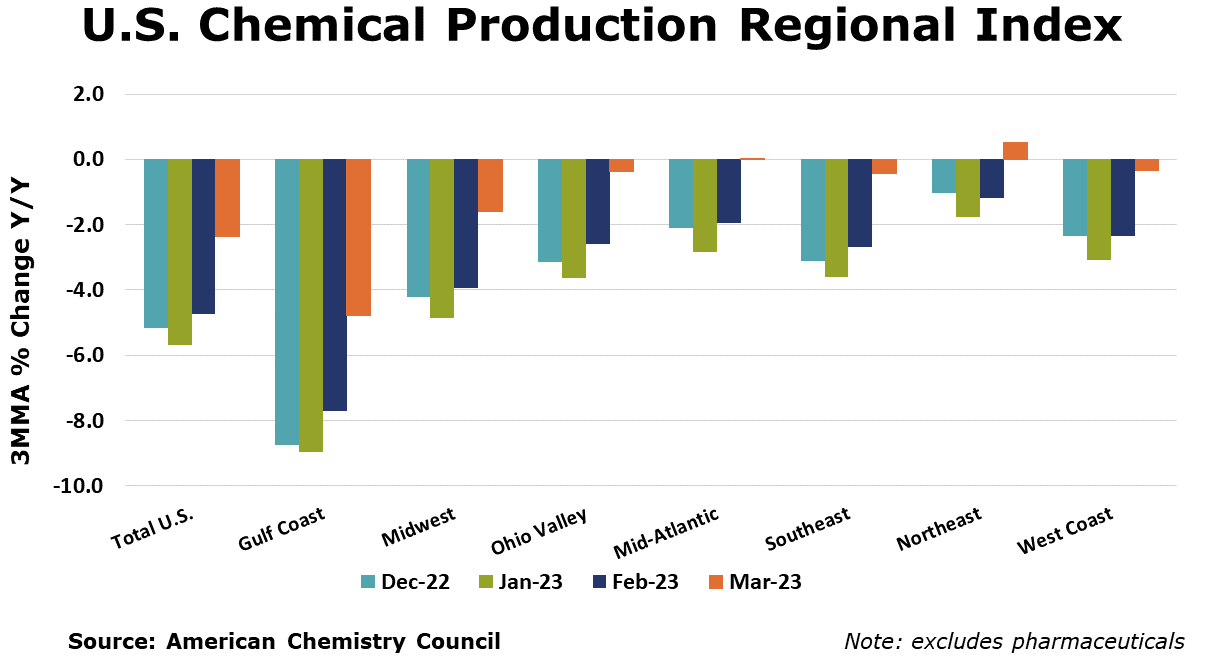
Running tab of macro indicators: 7 out of 20

The number of new jobless claims rose by 5,000 to 245,000 during the week ending April 15. Continuing claims increased by 61,000 to 1.87 million, and the insured unemployment rate for the week ending April 8 was up 0.1 at 1.3%. 

Seasonally adjusted housing starts fell slightly in March, by 0.8%. Chemistry-intensive single family starts, however, were up by 2.7% compared to the previous month. After a strong February, forward-looking building permits were down 8.8% in March, but single‐family authorizations were up by 4.1%. Permits for buildings with five or more units fell by nearly one-quarter (24.3%). Both starts and permits remained sharply lower than a year ago. According to data from the National Association of Realtors®, existing-home sales fell 2.4% in March to 4.44 million; this is down 22.0% Y/Y. Existing homes inventory was up slightly M/M (1.0%), or the equivalent of 2.6 months' supply at the current monthly sales pace.

The Conference Board’s Leading Economic Index® fell for a 12th straight month in March, down 1.2% from February’s reading. Of the 10 components, only two provided weak positive contributions. The LEI was off 9.2% Y/Y. The Conference Board expects that “economic weakness will intensify and spread more widely throughout the US economy over the coming months, leading to a recession starting in mid-2023”.

For the first time in five months, business conditions moved up, according to the April Empire State Manufacturing Survey, which reflects conditions in New York state. The general business conditions index increased thirty-five points to 10.8. New orders and shipments surged, and inventories increased. However, looking ahead six months, the region’s manufacturers do not anticipate improvement in business conditions.


Federal Reserve Beige Book

The Fed’s Beige Book is a compilation of regional assessments of economic conditions in each of the 12 Federal Reserve Districts. Some key take-aways follow here:

  • Overall economic activity was little changed in most districts (9 of 12) in recent weeks.
  • Expectations for future growth were mostly unchanged as well; however, two Districts saw outlooks deteriorate. 
  • Consumer spending was generally seen as flat to down slightly amid continued reports of moderate price growth.
  • Auto sales remained steady overall, with only a couple of Districts reporting improved sales and inventory levels. 
  • Travel and tourism picked up across much of the country in recent weeks. 
  • Manufacturing activity was widely reported as flat or down even as supply chains continued to improve. 
  • Transportation and freight volumes were also flat to down, according to several Districts. 
  • On balance, residential real estate sales and new construction activity softened modestly. Nonresidential construction was little changed while sales and leasing activity was generally flat to down. 
  • Lending volumes and loan demand generally declined across consumer and business loan types. 
  • Several Districts noted that banks tightened lending standards amid increased uncertainty and concerns about liquidity. 
  • The majority of Districts reported steadily increasing demand and sales for nonfinancial services. 
  • Agriculture conditions were mostly unchanged in recent weeks, while some softening was reported in energy markets.


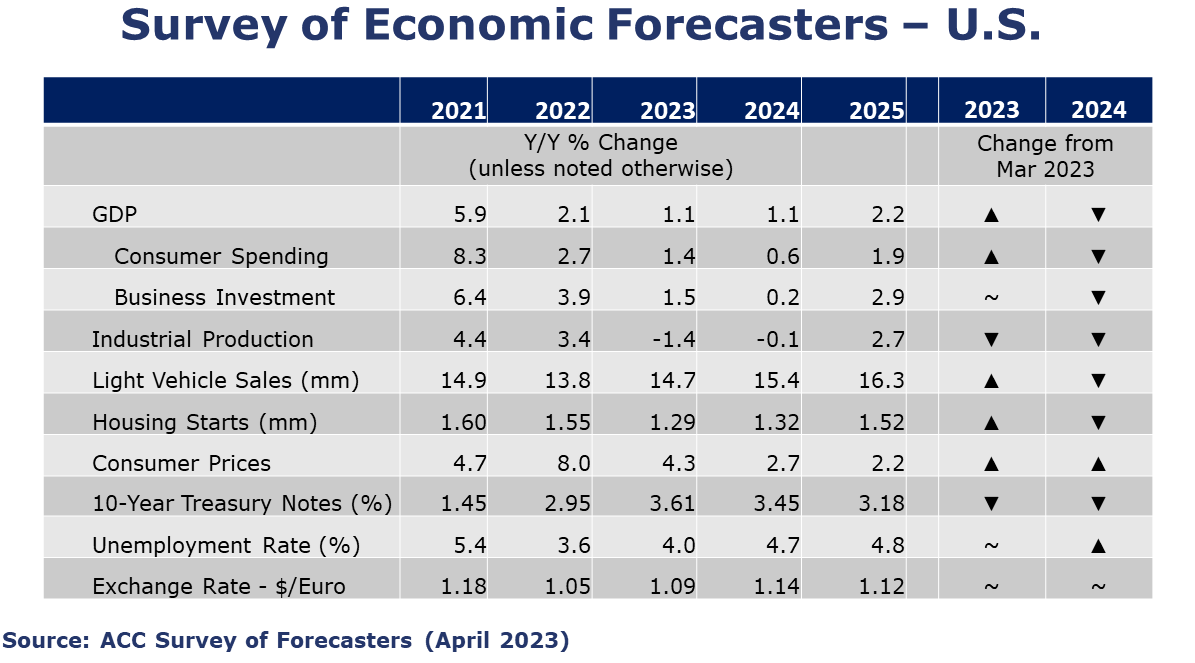
ACC Survey of Economic Forecasters

  • Going into Q2, the outlook for the U.S. economy remains weak with a short and mild recession expected to emerge during the second half of the year.
  • With the expected downturn pushed back several quarters, the outlook for 2024 has softened with ongoing weakness in consumer spending and business investment. 
  • U.S. GDP is expected to grow by a modest 1.1% in both 2023 and 2024.
  • Consumer spending growth is expected to slow to a 1.4% Y/Y pace in 2023 and slow further to a 0.6% gain in 2024.
  • Business investment is also expected to grow modestly, by 1.5% in 2023 and 0.2% in 2024.
  • The deterioration in industrial production that began in late-2022 is expected to continue through the start of 2024. Industrial production is expected to contract by 1.4% in 2023 and ease a further 0.1% in 2024.
  • While assemblies and dealer inventories have expanded, higher borrowing costs and economic uncertainty will temper pent-up demand that has accrued over the past three years. As a result, sales of autos and light trucks are expected to grow to 14.7 million in 2023 (well below trend) and 15.4 million in 2024. 
  • As mortgage rates remain above 6%, expectations for interest rate-sensitive housing continue to show a lower level of homebuilding. Housing starts are expected to come in at 1.29 million in 2023, before edging higher to 1.32 million in 2024. 
  • The unemployment rate is expected to move higher from 50-year lows to 4.0% in 2023 and 4.7% in 2024.
  • Following an 8.0% surge in consumer prices in 2022, growth in consumer prices is expected to decelerate to a 4.3% pace in 2023 and 2.7% in 2024.
  • Compared to last month, expectations for interest rates (10-year Treasury) were lower, reflecting recent bank turmoil.
  • Following an estimated 3.0% pace of expansion in 2022, global economic growth is projected to rise by 2.3% this year – an upward revisions as economic indicators through the first quarter have signaled resilience.
  • General weak economic growth worldwide and continued inflationary pressure will pull down demand for industrial output this year. Additionally, high energy and feedstock costs are expected to continue to hamper manufacturing activity. Forecasters estimate global industrial production rose 2.9% last year and over the course of 2023, will expand by 0.4% before rising 3.3% in 2024 and 3.4% in 2025. 
  • Global trade flows are likely to lag overall economic growth this year. World trade will slow to a 1.5% gain this year and then grow 3.2% in 2024 and 3.9% in 2025. 
  • After rising to an 8.0% pace in 2022, global inflation is expected to remain high through 2023 (estimated 5.9%) before moderating to 4.1% in 2024 and 3.5% in 2025.

Oil prices eased over the past week but remain higher than before OPEC’s recent surprise announcement to remove an additional 1 million bpd from the market. The lower prices reflected weaker economic news this week and renewed concerns about oil demand from the world’s largest consumer. U.S. natural gas prices were a little higher than a week ago but remain relatively low. Inventories remain robust, with the first inventory build of the year last week. The combined oil and gas rig count continued to slide for a third week in a row, down by three to 745.

For the business of chemistry, the indicators bring to mind a red banner for basic and specialty chemicals. 

According to data released by the Association of American Railroads, chemical railcar loadings were up 5.3% to 33,206 for the week ending 15 April (week 15). Loadings were down 6.7% Y/Y (13-week MA), down 6.6% YTD/YTD and have been on the rise for 9 of the last 13 weeks. 

The U.S. Chemical Production Regional Index (U.S. CPRI) jumped by 2.6% in March following a 0.7% decline in January and a 0.9% gain in February, according to the American Chemistry Council (ACC). 

  • The gain in March reflects a bump in chemical production that followed a tough Q4 when producers were challenged by customer destocking and winter-weather related disruptions. 
  • Chemical output trends rallied in March and were higher than a month ago in all regions, with the largest gain in the Gulf Coast, home to much of the nation’s basic industrial chemical and synthetic materials capacity.
  • Output of plastic resins, organic chemicals, industrial gases, coatings, adhesives, crop protection chemicals, synthetic dyes & pigments, synthetic rubber, consumer products, and other specialty chemicals were higher. 
  • Gains were offset by lower production of synthetic rubber and fertilizers. 

As nearly all manufactured goods are produced using chemistry in some form, manufacturing activity is an important indicator for chemical demand. 

U.S. manufacturing output rose 0.5% in March on a 3MMA basis. The 3MMA trend in manufacturing production was mixed, with output in several chemistry-consuming segments continuing to contract. Output continued to expand, however, in food & beverage, appliances, motor vehicles & parts, construction supplies, machinery, electronics, semiconductors, refining, iron & steel products, foundries, plastic products, paper, printing and apparel.

Note On the Color Codes

The banner colors represent observations about the current conditions in the overall economy and the business chemistry. For the overall economy we keep a running tab of 20 indicators. The banner color for the macroeconomic section is determined as follows:

Green – 13 or more positives
Yellow – between 8 and 12 positives
Red – 7 or fewer positives

For the chemical industry there are fewer indicators available. As a result, we rely upon judgment whether production in the industry (defined as chemicals excluding pharmaceuticals) has increased or decreased three consecutive months.

For More Information

ACC members can access additional data, economic analyses, presentations, outlooks, and weekly economic updates through ACCexchange.

In addition to this weekly report, ACC offers numerous other economic data that cover worldwide production, trade, shipments, inventories, price indices, energy, employment, investment, R&D, EH&S, financial performance measures, macroeconomic data, plus much more. To order, visit http://store.americanchemistry.com/.

Every effort has been made in the preparation of this weekly report to provide the best available information and analysis. However, neither the American Chemistry Council, nor any of its employees, agents or other assigns makes any warranty, expressed or implied, or assumes any liability or responsibility for any use, or the results of such use, of any information or data disclosed in this material.

Contact us at ACC_EconomicsDepartment@americanchemistry.com

American Chemistry Council

The American Chemistry Council (ACC) represents the leading companies engaged in the multibillion-dollar business of chemistry. ACC members apply the science of chemistry to make innovative products, technologies and services that make people's lives better, healthier and safer. ACC is committed to improved environmental, health, safety and security performance through Responsible Care®; common sense advocacy addressing major public policy issues; and health and environmental research and product testing. ACC members and chemistry companies are among the largest investors in research and development, and are advancing products, processes and technologies to address climate change, enhance air and water quality, and progress toward a more sustainable, circular economy.


* All content is copyrighted by Industry Intelligence, or the original respective author or source. You may not recirculate, redistrubte or publish the analysis and presentation included in the service without Industry Intelligence's prior written consent. Please review our terms of use.

See our dashboard in action - schedule an demo
Dan Rivard
Dan Rivard
- VP Market Development -

We offer built-to-order chemicals industry coverage for our clients. Contact us for a free consultation.

About Us

We deliver market news & information relevant to your business.

We monitor all your market drivers.

We aggregate, curate, filter and map your specific needs.

We deliver the right information to the right person at the right time.

Our Contacts

1990 S Bundy Dr. Suite #380,
Los Angeles, CA 90025

+1 (310) 553 0008

About Cookies On This Site

We collect data, including through use of cookies and similar technology ("cookies") that enchance the online experience. By clicking "I agree", you agree to our cookies, agree to bound by our Terms of Use, and acknowledge our Privacy Policy. For more information on our data practices and how to exercise your privacy rights, please see our Privacy Policy.