July 14, 2023
(press release)
–
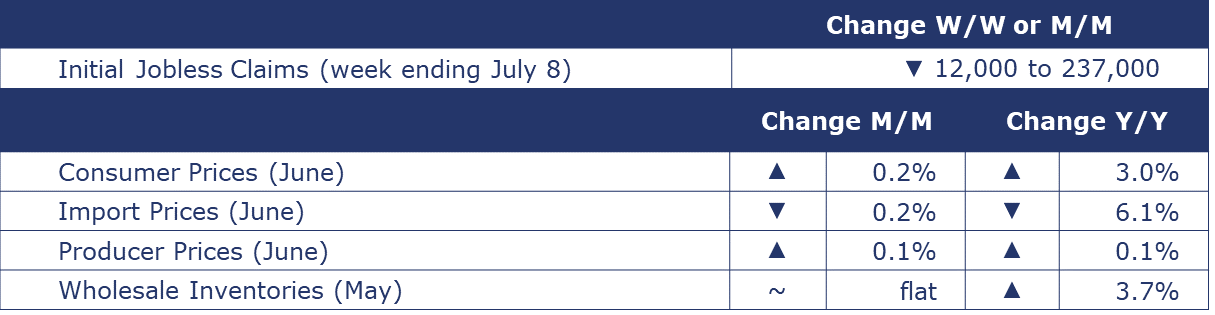
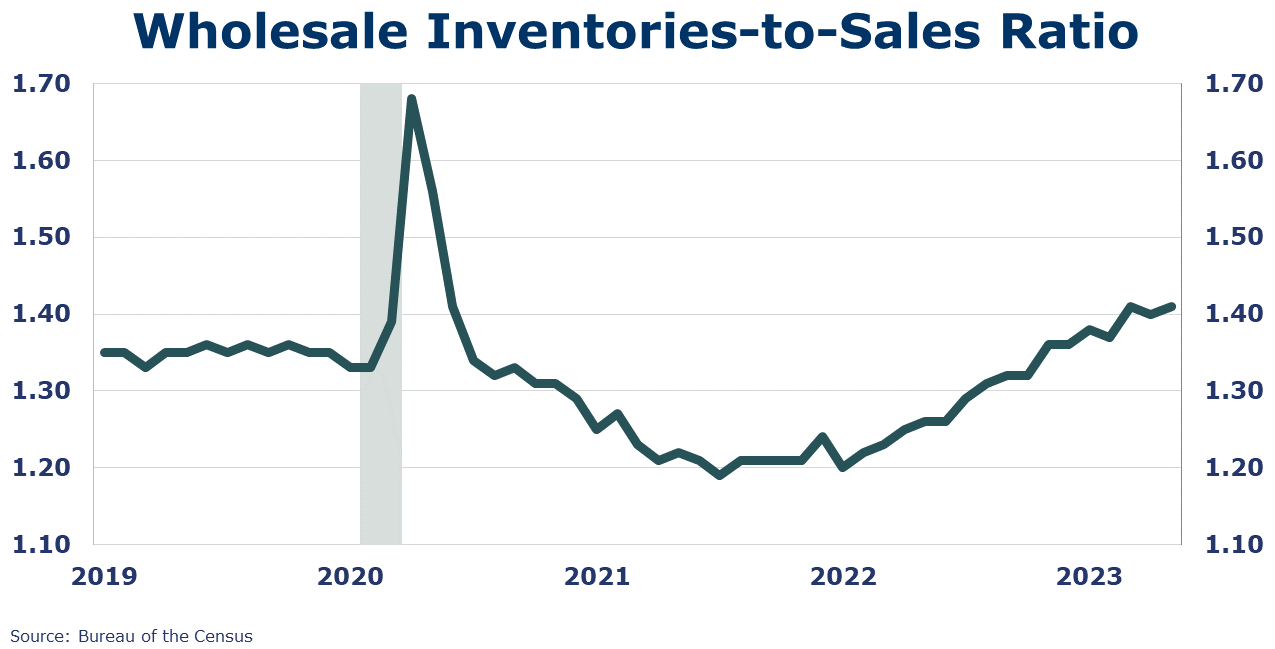
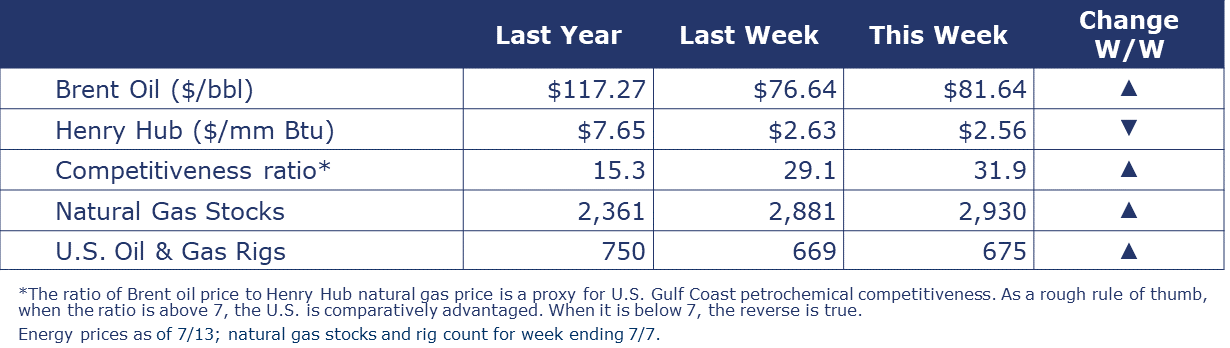
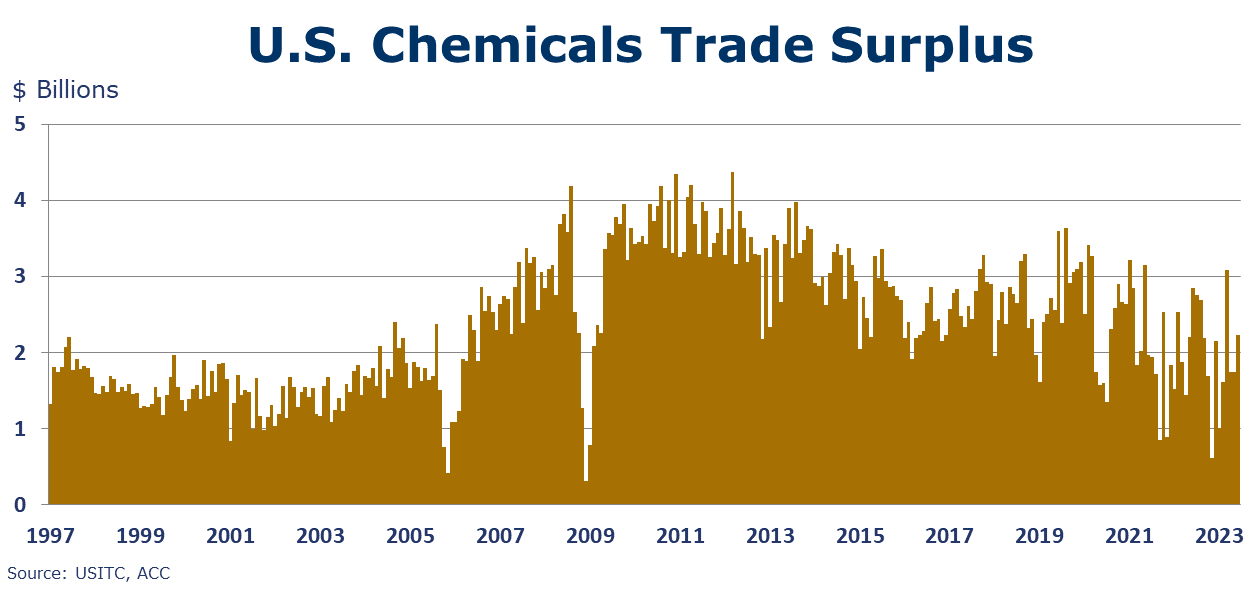
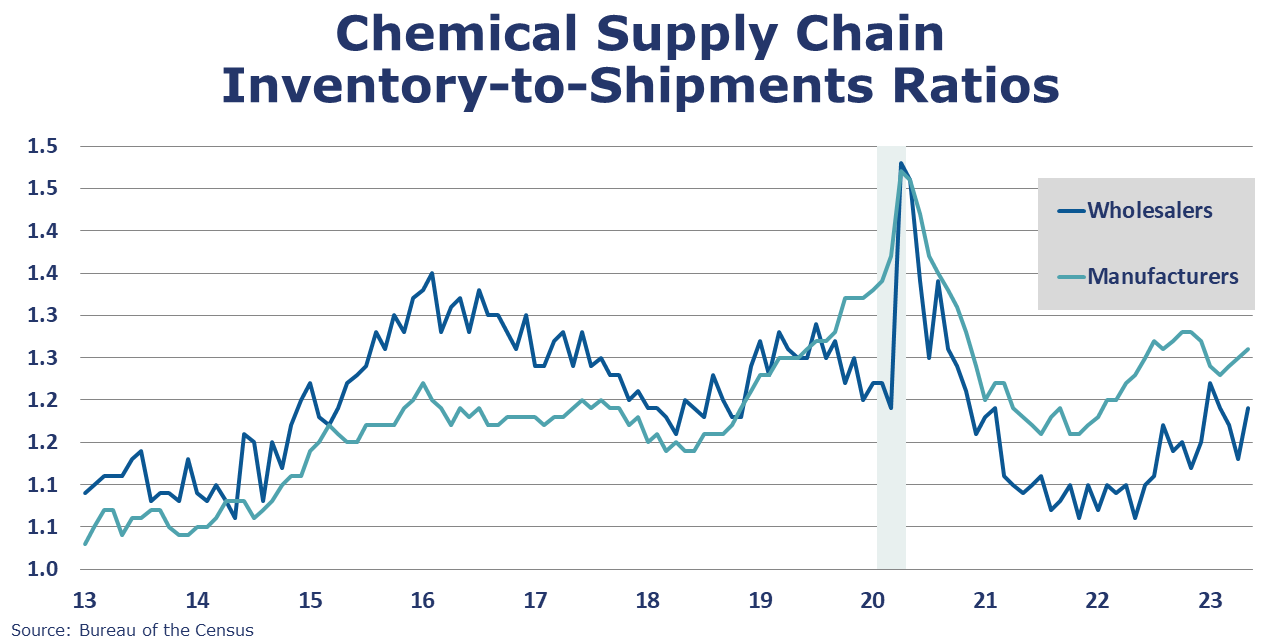
Running tab of macro indicators: 12 out of 20 The number of new jobless claims fell by 12,000 to 237,000 during the week ending July 8. Continuing claims increased by 11,000 to 1.729 million, and the insured unemployment rate for the week ending July 1 was unchanged at 1.2%. Headline consumer prices rose 0.2% in June and were up 3.0% Y/Y. The rise in the headline consumer price index (CPI) was largely due to an increase in the index for shelter, while motor vehicles also contributed. Core CPI (all items less food and energy) rose 0.2% in June and was up 4.8% Y/Y. Producer prices rose less than expected in June, up just 0.1%. Prices for gasoline and electricity were higher, in addition to beef, eggs, and medical devices. Prices for iron & steel scrap, diesel and residual fuel oil, and oilseeds were lower. Core final goods prices (excluding food & energy) were flat while prices for services continued to advance. Producer prices were up just 0.1% Y/Y while core producer prices were up 2.6% Y/Y. Both measures are improving. Import prices fell 0.2% in June, following a decline in May. Imported fuel prices rose during the month but were offset by lower prices for nonfuel imports. Export prices also fell, down 0.9% with declines in both agricultural and nonagricultural exports. Compared to a year ago, import prices were off 6.1% and import prices were 12.0% lower. The NFIB Small Business Optimism Index increased in June but the index reading – for the 18th consecutive month – was below the historical average. Inflation and labor quality were the top concerns. Of the small business owners surveyed, 42% reported openings they could not fill—a concern reflected mostly in the manufacturing sector. In May, consumer credit increased at a seasonally adjusted annual rate of 1.8%. Revolving credit increased at an annual rate of 8.2%, while nonrevolving credit decreased at an annual rate of 0.4%. Wholesale sales fell slightly (by 0.2%) in May to the lowest level since December 2021, following flat growth in April. The largest monthly declines were in petroleum, chemicals, and metals while furniture and automotive sales improved compared to the previous month. Wholesale inventories remained flat compared to April with gains in machinery and metals offset by declines in farm products and paper. Sales were down 4.0% Y/Y, while inventories were up 3.7% Y/Y. The inventories-to-sales ratio has remained consistent over the past three months, at 1.41 in May, 1.40 in April and 1.41 in March. A year ago, the ratio was 1.30. A compilation of anecdotal information on the regional economies in the 12 districts, the Beige Book is published eight times per year. Interesting excerpts follow here: “Overall economic activity increased slightly since late May. Five Districts reported slight or modest growth, five noted no change, and two reported slight and modest declines. Reports on consumer spending were mixed; growth was generally observed in consumer services, but some retailers noted shifts away from discretionary spending. Tourism and travel activity was robust, and hospitality contacts expected a busy summer season. Auto sales remained unchanged or exhibited moderate growth across most Districts. Manufacturing activity edged up in half of the Districts and declined in the other half. Transportation activity was down or flat in most Districts that reported on it, as some contacts reported reduced demand due to high inventory levels and others noted continued challenges from labor shortages. Banking conditions were mostly subdued, as lending activity continued to soften. Despite higher mortgage rates, demand for residential real estate remained steady, although sales were constrained by low inventories. Construction for both residential and commercial units was slightly lower on balance. Agricultural conditions were mixed geographically but softened slightly on balance, with some contacts expecting further softening for the remainder of 2023. Energy activity decreased. Overall economic expectations for the coming months generally continued to call for slow growth.” Oil prices continued to gain this week as announced Saudi and Russian production cuts may finally be having an impact. U.S. natural gas prices have eased in recent days as gas production continues to hit record highs. Following nine consecutive weeks of declines, the combined oil and gas rig rose by six to 675. Indicators for the business of chemistry bring to mind a red banner. According to data released by the Association of American Railroads, chemical railcar loadings were down 12.4% to 28,512 for the week ending July 8 (which included the Independence Day holiday). Loadings were down 5.5% Y/Y (13-week MA), down (4.4%) YTD/YTD and have been on the rise for 8 of the last 13 weeks. U.S. chemical exports – at $14.1 billion in May – were up 2.1% compared to April but down 12.0% Y/Y. The May gain was driven by higher exports of inorganic chemicals. U.S. chemical imports fell by 1.6% in May and were down 14.1% Y/Y. The trade surplus in chemicals expanded by $479 million and is at $10 billion YTD (through May). Chemical producer prices continued to ease in June, down by 0.8% on the heels of a 0.5% decline in May. Except for consumer products, prices were lower across all other individual chemical segments. The largest monthly declines were in synthetic rubber, resins, and organic chemicals. Chemical prices were down 4.6% Y/Y. Chemical import prices edged slightly higher, up by 0.1% in June, while prices for exported chemicals fell 1.4%. Chemical import prices were off 9.6% Y/Y while chemical export prices were off 9.2% Y/Y. Wholesale chemical sales fell 3.7% in May following a downwardly adjusted 1.7% increase in April. Chemical wholesale inventories were up 1.2% following a revised 2.1% decline in April. Sales were down 9.9% Y/Y while inventories were down 1.1% Y/Y. The inventories-to-sales ratio for chemicals was up to 1.19 in May from 1.13 in April. A year ago, the ratio was 1.08. The banner colors represent observations about the current conditions in the overall economy and the business chemistry. For the overall economy we keep a running tab of 20 indicators. The banner color for the macroeconomic section is determined as follows: Green – 13 or more positives For the chemical industry there are fewer indicators available. As a result, we rely upon judgment whether production in the industry (defined as chemicals excluding pharmaceuticals) has increased or decreased three consecutive months. ACC members can access additional data, economic analyses, presentations, outlooks, and weekly economic updates through ACCexchange. In addition to this weekly report, ACC offers numerous other economic data that cover worldwide production, trade, shipments, inventories, price indices, energy, employment, investment, R&D, EH&S, financial performance measures, macroeconomic data, plus much more. To order, visit http://store.americanchemistry.com/. Every effort has been made in the preparation of this weekly report to provide the best available information and analysis. However, neither the American Chemistry Council, nor any of its employees, agents or other assigns makes any warranty, expressed or implied, or assumes any liability or responsibility for any use, or the results of such use, of any information or data disclosed in this material. Contact us at ACC_EconomicsDepartment@americanchemistry.com.MACROECONOMY & END-USE MARKETS

Fed Beige Book
ENERGY
CHEMICALS

Note On the Color Codes
Yellow – between 8 and 12 positives
Red – 7 or fewer positivesFor More Information


* All content is copyrighted by Industry Intelligence, or the original respective author or source. You may not recirculate, redistrubte or publish the analysis and presentation included in the service without Industry Intelligence's prior written consent. Please review our terms of use.


