November 10, 2023
(press release)
–
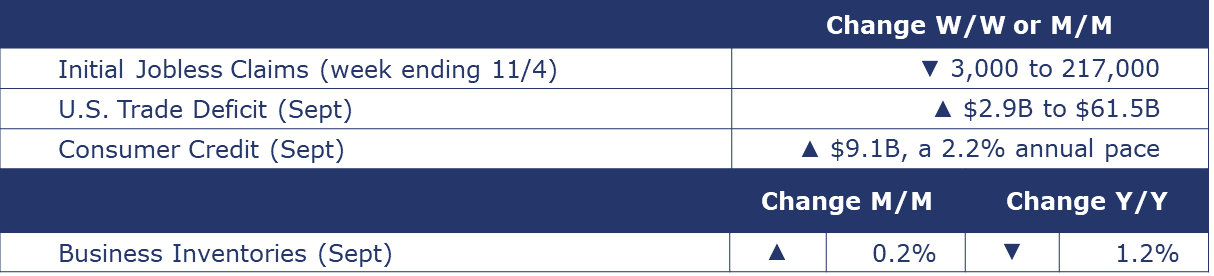
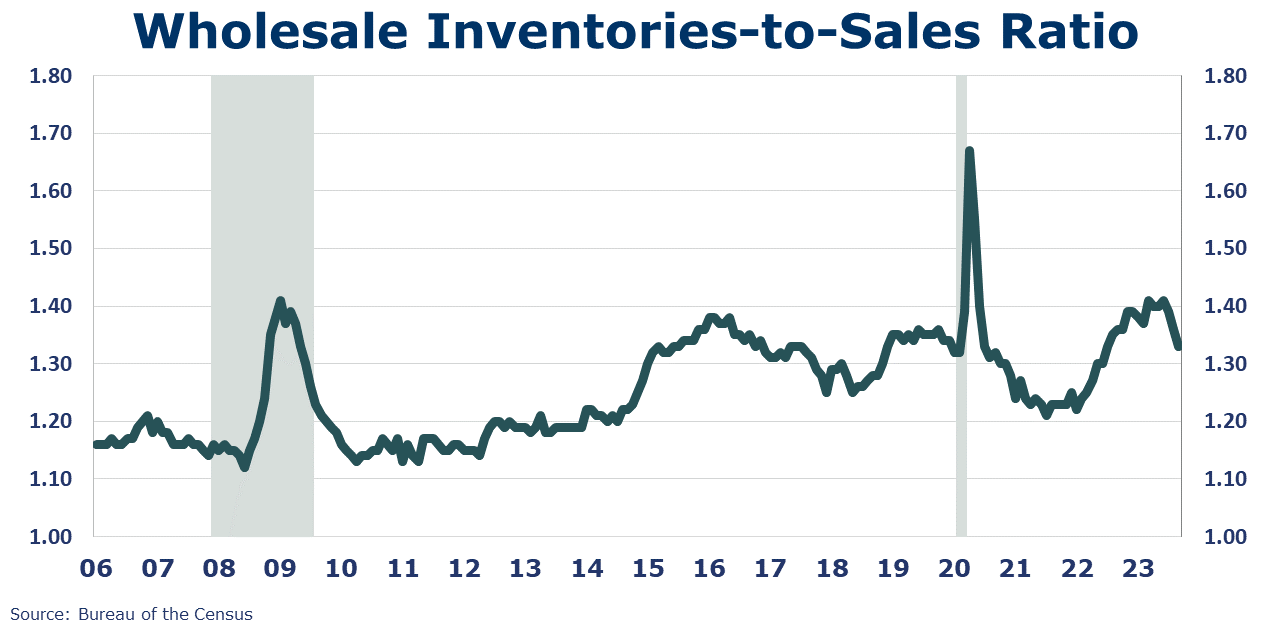
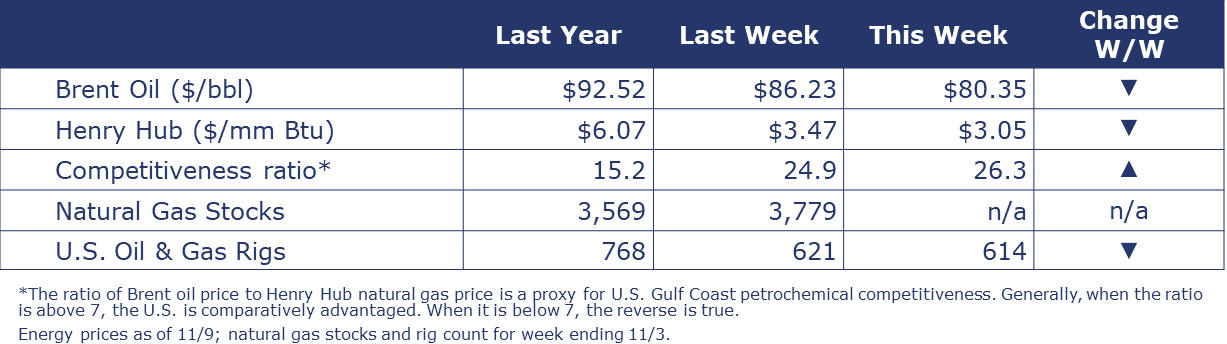
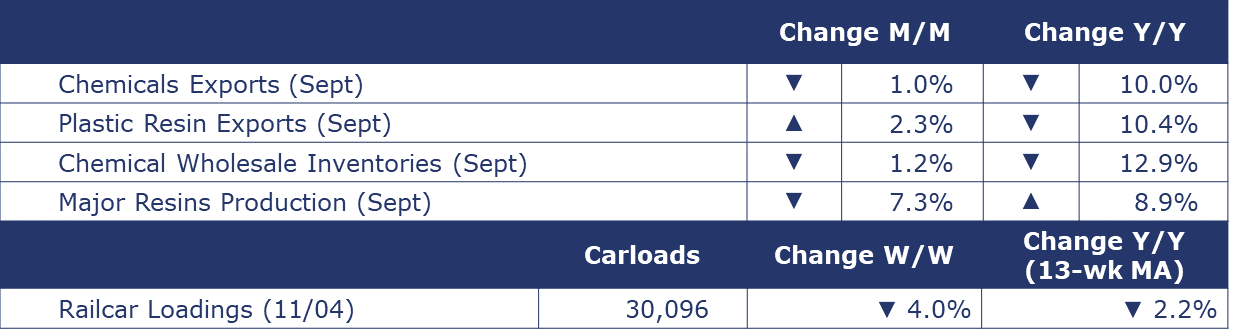
Running tab of macro indicators: 10 out of 20 The number of new jobless claims fell by 3,000 to 217,000 during the week ending Nov 4. Continuing claims increased by 2,000 to 1.600 million, and the insured unemployment rate for the week ending Oct 28 was unchanged at 1.2%. Consumer credit rose $9.1 billion in September (increasing at a 2.2% annual rate) following a one-off $15.8 billion dip in August when loan repayments pulled down the headline balance. The pace of revolving debt growth dropped notably from 13.7% in August to 2.9% in September. Nonrevolving debt, which includes student loans and car loans had declined at a 9.8% pace in August but resumed to growth at a 1.9% pace in September. Separately, the New York Fed data reported credit card delinquencies are rising. The U.S. trade deficit widened 4.9% (or $2.9 billion) in September to $61.5 billion as imports grew 2.7% and exports grew 2.2%. Exports of goods rose in industrial supplies and materials (including gains in crude oil and other petroleum products), foods, feeds, and beverages (including gains in soybeans and corn), and in other goods. Imports were higher for consumer goods (especially cell phones and household goods), autos and parts (especially passenger cars), capital goods (including computer accessories, aircraft parts, other industrial machinery, and materials handling equipment), and in industrial supplies and materials (largely reflecting a gain in crude oil). Wholesale inventories rose 0.2% in September but were 1.2% lower than levels a year-ago. Inventories were lower across most categories but higher for autos, lumber, computer equipment, machinery, pharma, groceries, and petroleum. Sales at the wholesale level rose 2.2% in September to a level up 0.9% Y/Y. The wholesale inventories-to-sales ratio fell from 1.36 in August to 1.33 in September. Oil prices fell to their lowest level in three months on renewed concerns about economic recovery in China and the U.S. Natural gas prices were also lower in the U.S. on record output and forecasts for milder weather through late November. Following three straight weeks of gains, the combined oil and gas rig count fell by seven to 614. Indicators for the business of chemistry bring to mind a yellow banner. According to data released by the Association of American Railroads, chemical railcar loadings were down to 30,096 for the week ending Nov 4. Loadings were down 2.2% Y/Y (13-week MA), down (2.1%) YTD/YTD and have been on the rise for 7 of the last 13 weeks. Chemical wholesale inventories fell 1.2% in September, following a 2.3% decline in August. Sales of chemicals at the wholesale level decreased 0.7%. The inventories-to-shipments ratio was unchanged at 1.11 in September. Inventories were off 12.9% Y/Y while sales were off 7.5% Y/Y. U.S. chemical exports fell 1.0% in September to a level down 10.0% Y/Y. Exports fell in consumer products, agricultural chemicals, inorganics, bulk petrochemicals, and specialties. Exports of plastic resins rose 2.3% but were down 10.4% Y/Y. Chemical imports fell 3.9% in September and were down 19.3% Y/Y. Imports were down in most categories. The U.S. chemicals trade surplus expanded by $3.2 billion in September. U.S. production of major plastic resins totaled 7.9 billion pounds in September, down 7.2% M/M, and up 8.9% Y/Y, according to ACC statistics. Year-to-date production was 71.9 billion pounds, up 1.7% Y/Y. Sales and captive (internal) use of major plastic resins rose 6.4% to 8.1 billion pounds in September, a level up 4.7% Y/Y. Year-to-date sales and captive use were 71.2 billion pounds, a 1.3% increase as compared to the same period in 2022. Banner colors reflect an assessment of the current conditions in the overall economy and the business chemistry of chemistry. For the overall economy we keep a running tab of 20 indicators. The banner color for the macroeconomic section is determined as follows: Green – 13 or more positives There are fewer indicators available for the chemical industry. Our assessment on banner color largely relies upon how chemical industry production has changed over the most recent three months. ACC members can access additional data, economic analyses, presentations, outlooks, and weekly economic updates through ACCexchange. In addition to this weekly report, ACC offers numerous other economic data that cover worldwide production, trade, shipments, inventories, price indices, energy, employment, investment, R&D, EH&S, financial performance measures, macroeconomic data, plus much more. To order, visit http://store.americanchemistry.com/. Every effort has been made in the preparation of this weekly report to provide the best available information and analysis. However, neither the American Chemistry Council, nor any of its employees, agents or other assigns makes any warranty, expressed or implied, or assumes any liability or responsibility for any use, or the results of such use, of any information or data disclosed in this material. Contact us at ACC_EconomicsDepartment@americanchemistry.com. The American Chemistry Council’s mission is to advocate for the people, policy, and products of chemistry that make the United States the global leader in innovation and manufacturing. To achieve this, we: Champion science-based policy solutions across all levels of government; Drive continuous performance improvement to protect employees and communities through Responsible Care®; Foster the development of sustainability practices throughout ACC member companies; and Communicate authentically with communities about challenges and solutions for a safer, healthier and more sustainable way of life. Our vision is a world made better by chemistry, where people live happier, healthier, and more prosperous lives, safely and sustainably—for generations to come.
MACROECONOMY & END-USE MARKETS
ENERGY
CHEMICALS


Note On the Color Codes
Yellow – between 8 and 12 positives
Red – 7 or fewer positivesFor More Information
About the Author
American Chemistry Council
American Chemistry Council
* All content is copyrighted by Industry Intelligence, or the original respective author or source. You may not recirculate, redistrubte or publish the analysis and presentation included in the service without Industry Intelligence's prior written consent. Please review our terms of use.


