June 23, 2023
(press release)
–
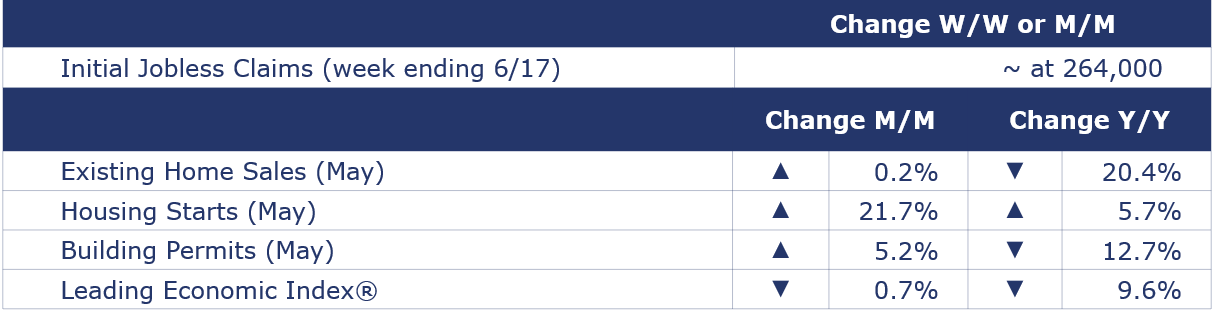
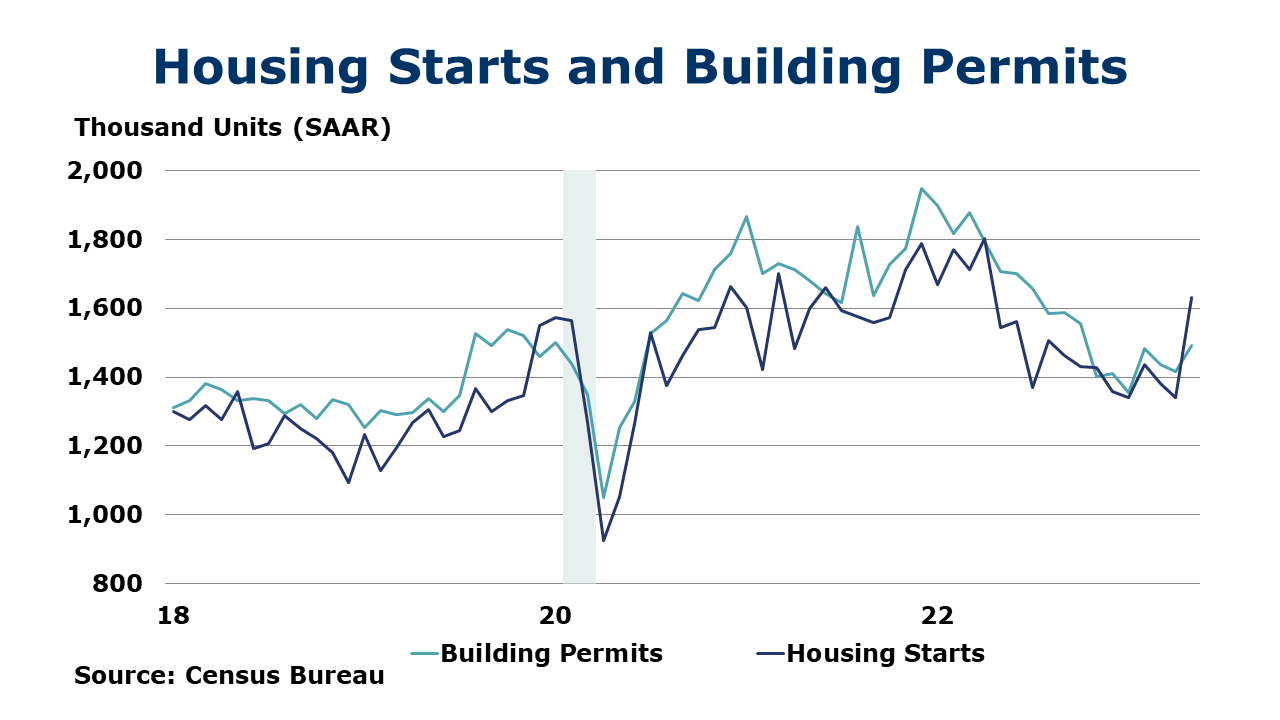
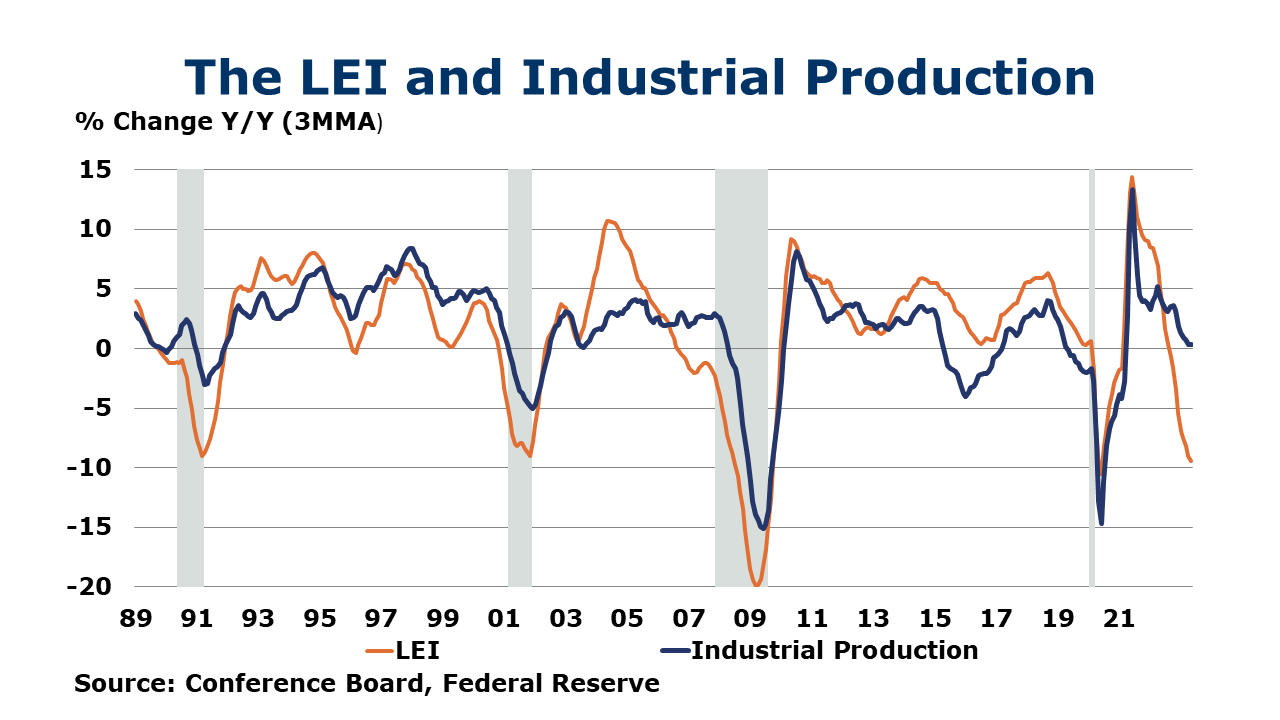
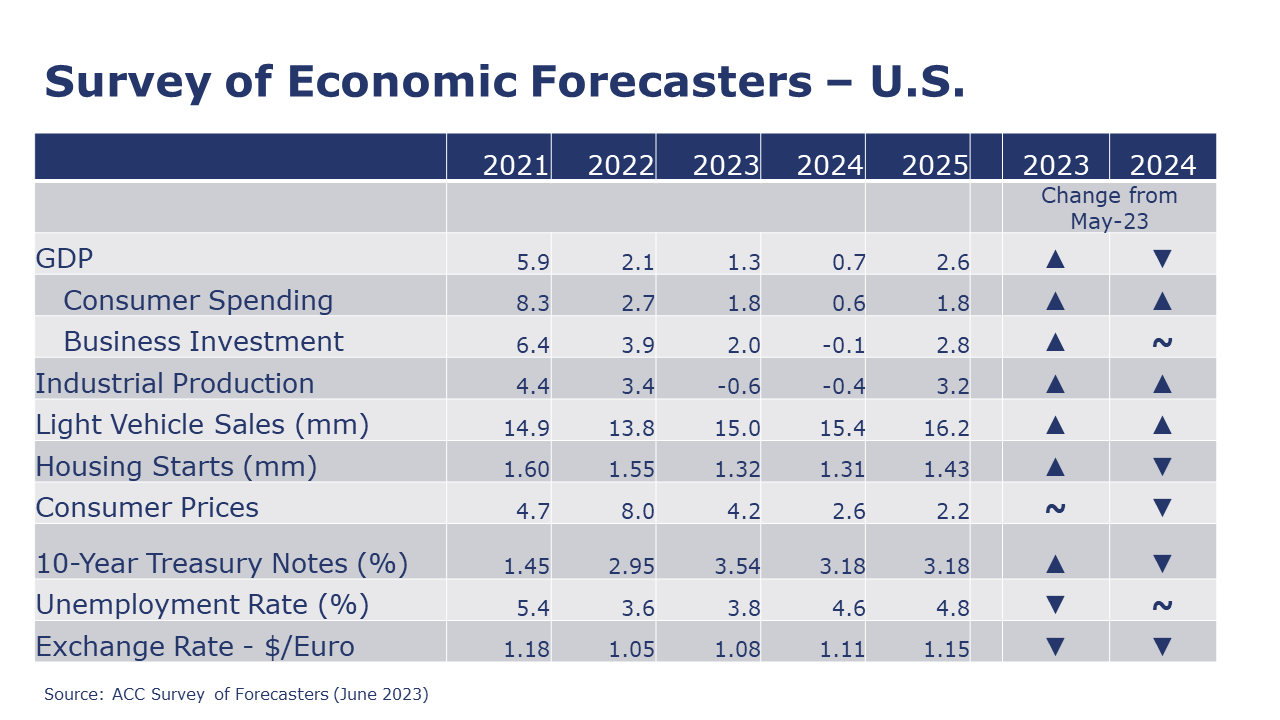
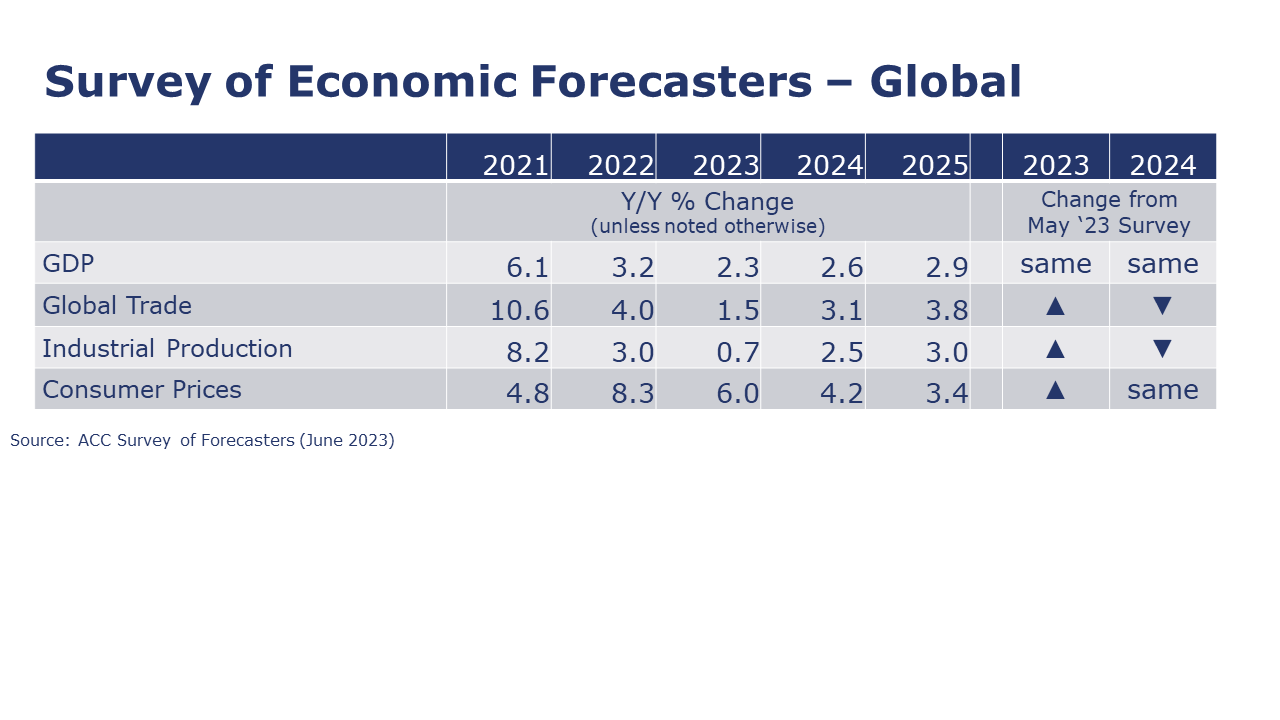
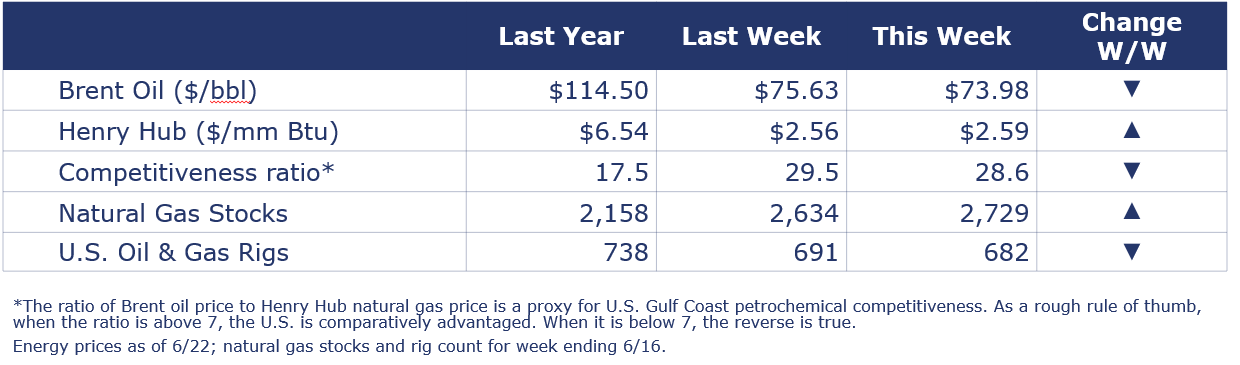
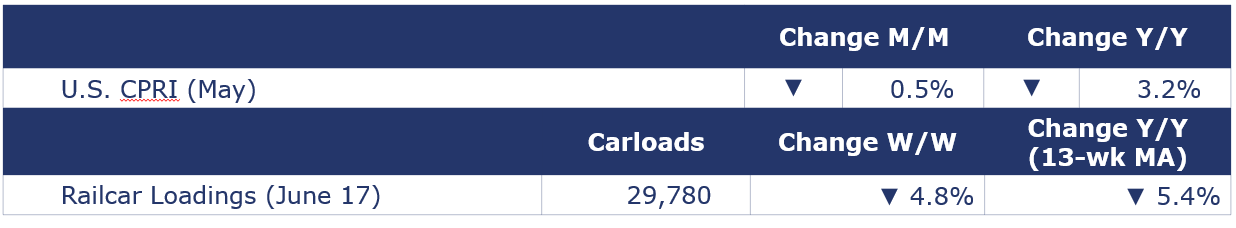
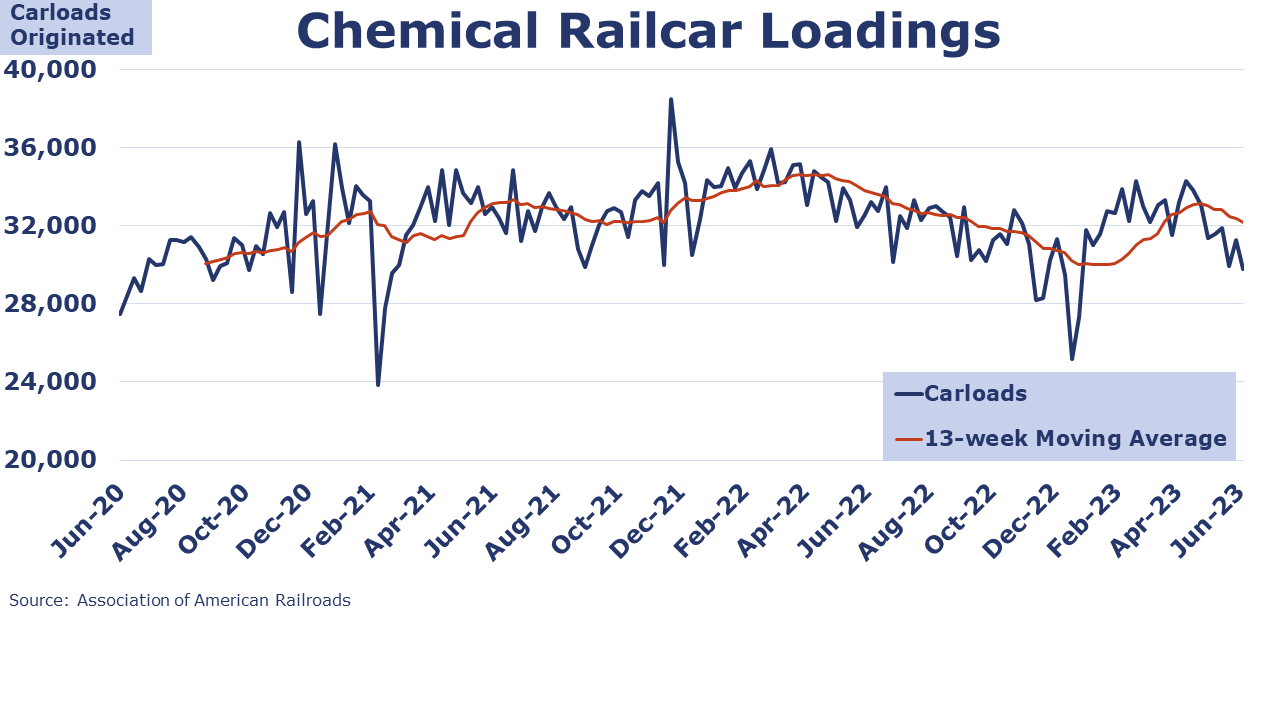
21.7% Housing Starts 0.5% U.S. CPRI 0.7% Leading Economic Index® Running tab of macro indicators: 10 out of 20 The number of new jobless claims was unchanged (compared to the previous week’s upwardly revised level) at 264,000 during the week ending June 17. Continuing claims fell by 13,000 to 1.76 million, and the insured unemploymentrate for the week ending June 10 was unchanged at 1.2%. According to data from the National Association of Realtors®, existing-home sales rose 0.2% in May to 4.3 million; this is down 20.4% Y/Y. Existing homes inventory was up M/M (3.8%), or the equivalent of 3 months' supply at the current monthly sales pace. Existing home prices fell 3.1% Y/Y. Seasonally adjusted housing starts rose in May by 21.7%. Chemistry-intensive single-family starts were up by 18.5% compared to the previous month. Following a decline in April, forward-looking building permits rose 5.2% in May, and single‐family authorizations were up by 4.8%. Multifamily permits were also higher in May. While permits remained lower than a year ago, housing starts were 5.7% above the May 2022 rate. Following the improvement in May, NAHB/Wells Fargo homebuilder confidence moved into positive territory in June, registering 55. This is the highest reading since last July and the first time in 11 months that sentiment levels surpassed the midpoint of 50. All the subcomponents (current sales, sales expectations, and buyer traffic) recorded gains. The Conference Board’s Leading Economic Index®, a reliable recession indicator, continued to decline for a 14th consecutive month in May, down by 0.7%. The decline reflects further deterioration in the gauges of consumer expectations, ISM new orders index, a negative yield spread and worsening credit conditions. The trend in the index continues to point to weaker economic activity ahead. The Conference Board expects the U.S. economy will contract over the Q3 2023 to Q1 2024 time frame. Compared to a year ago, the LEI was down 9.6% Y/Y. The Kansas City Fed's monthly Survey of Tenth District (which includes Colorado, Oklahoma, Nebraska, Kansas, and Wyoming). Manufacturers showed that regional factory activity declined further in June. Firms’ expectations for future activity fell to their lowest levels since April 2020, although firms were still fairly optimistic about employment levels. The Chicago Fed Survey of Economic Conditions (CFSEC) showed further deterioration in June suggesting economic growth was well below trend in the Seventh Federal Reserve District that includes Illinois, Indiana, Michigan, Wisconsin, and Iowa. ACC Survey of Economic Forecasters Each month, ACC’s Economics & Data Analytics Department collects forecasts from a number of economic professionals who have a track record for accuracy and expert knowledge of manufacturing. The following are some of the most recent results. The Survey of Economic Forecasters is available to members on ACCExchange, ACC’s members-only platform. U.S. Survey of Economic Forecasters – Global Oil prices eased compared to a week ago on renewed concerns about global demand and Fed Chairman Powell’s comments to Congress that further rate hikes might be necessary to bring inflation down. U.S. natural gas prices were slightly higher than a week ago, reflecting scorching temperatures in the U.S. Southwest. Down for a seventh consecutive week, the combined oil & gas rig count fell by nine to 682. Indicators for the business of chemistry bring to mind a [red] banner. According to data released by the Association of American Railroads, chemical railcar loadings were down 1,487 to 29,780 for the week ending June 17. Loadings were down 5.4% Y/Y (13-week MA), down 4.7% YTD/YTD and have been on the rise for 7 of the last 13 weeks. The U.S. Chemical Production Regional Index (U.S. CPRI) fell by 0.5% in May. Chemical output declined in all regions of the U.S. except for the West Coast where output ticked slightly higher. The largest declines were in the Gulf Coast region, home to much of the nation’s basic industrial chemical and synthetic material capacity. Compared to a year ago, chemical output was lower by 3.2% Y/Y with declines in all regions. Note On the Color Codes The banner colors represent observations about the current conditions in the overall economy and the business chemistry. For the overall economy we keep a running tab of 20 indicators. The banner color for the macroeconomic section is determined as follows: Green – 13 or more positives For the chemical industry there are fewer indicators available. As a result, we rely upon judgment whether production in the industry (defined as chemicals excluding pharmaceuticals) has increased or decreased three consecutive months. For More Information ACC members can access additional data, economic analyses, presentations, outlooks, and weekly economic updates through ACCexchange. In addition to this weekly report, ACC offers numerous other economic data that cover worldwide production, trade, shipments, inventories, price indices, energy, employment, investment, R&D, EH&S, financial performance measures, macroeconomic data, plus much more. To order, visit http://store.americanchemistry.com/. Every effort has been made in the preparation of this weekly report to provide the best available information and analysis. However, neither the American Chemistry Council, nor any of its employees, agents or other assigns makes any warranty, expressed or implied, or assumes any liability or responsibility for any use, or the results of such use, of any information or data disclosed in this material. Contact us at ACC_EconomicsDepartment@americanchemistry.com. The American Chemistry Council (ACC) represents the leading companies engaged in the multibillion-dollar business of chemistry. ACC members apply the science of chemistry to make innovative products, technologies and services that make people's lives better, healthier and safer. ACC is committed to improved environmental, health, safety and security performance through Responsible Care®; common sense advocacy addressing major public policy issues; and health and environmental research and product testing. ACC members and chemistry companies are among the largest investors in research and development, and are advancing products, processes and technologies to address climate change, enhance air and water quality, and progress toward a more sustainable, circular economy. MACROECONOMY & END-USE MARKETS
ENERGY
CHEMICALS

Yellow – between 8 and 12 positives
Red – 7 or fewer positivesAbout the Author
American Chemistry Council
American Chemistry Council
* All content is copyrighted by Industry Intelligence, or the original respective author or source. You may not recirculate, redistrubte or publish the analysis and presentation included in the service without Industry Intelligence's prior written consent. Please review our terms of use.


