MACROECONOMY & END-USE MARKETS
Running tab of macro indicators: 13 out of 20 (while technically green, it’s tinged with a good bit of yellow)

The number of new jobless claims fell by 11,000 to 239,000 during the week ending August 12. Continuing claims increased by 32,000 to 1.72 million, and the insured unemployment rate for the week ending August 5 was up slightly at 1.2%.
Nominal retail sales rose for a fourth consecutive month in July, accelerating by 0.7%, better than expected. The results were led by strong spending in sporting goods & bookstores, online retailers, bars & restaurants, and clothing stores. Those gains were partially offset by lower sales of furniture & furnishings, electronics & appliances, and motor vehicles & parts. Retail sales were up 3.2% Y/Y, roughly the pace of inflation.
Prices for U.S. imports were up 0.4% in July following a 0.1% decline the previous month. The increase was driven by higher fuel prices (up 8.2%) and natural gas (up 12.1%). U.S. export prices rose 0.7% following a 0.7% decline the previous month; the largest increase was in fuels & lubricants (up 6.7%). On a Y/Y basis, import prices were down 4.4% and export prices were down 5.8%.
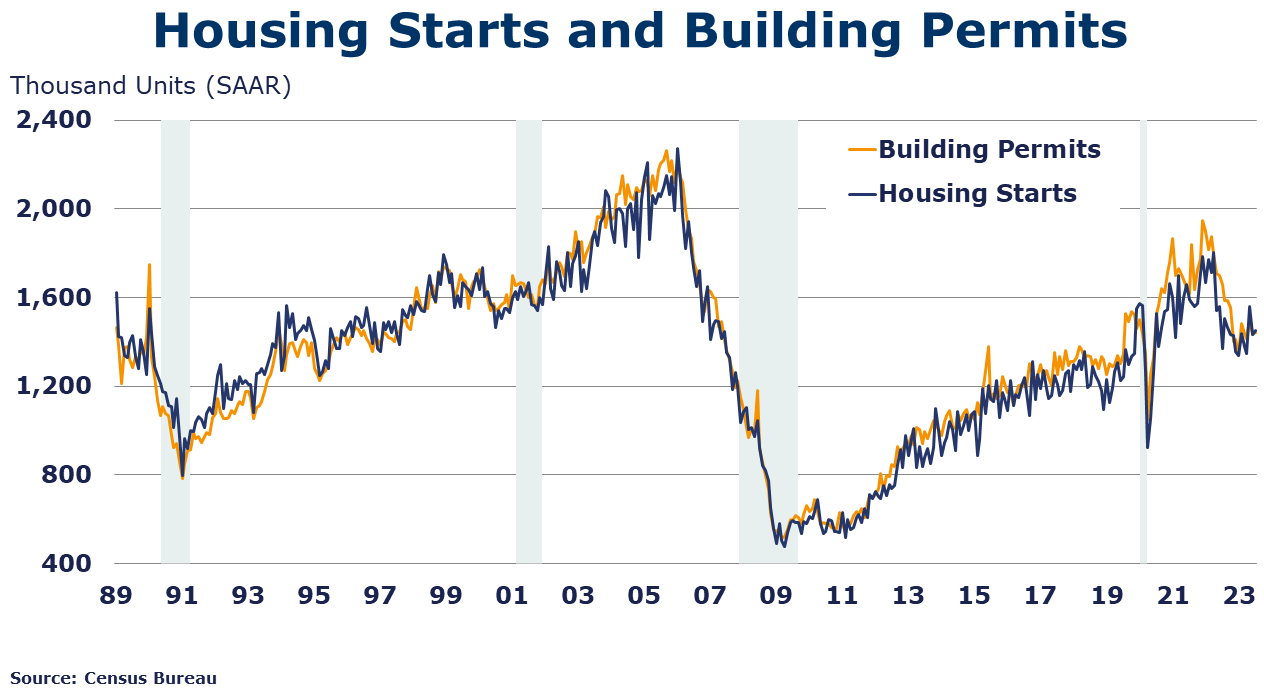
Seasonally adjusted housing starts rose 3.9% in July. Chemistry-intensive single-family starts were up by 5.9% compared to the previous month. Forward-looking building permits edged up 0.1% in June, but single‐family authorizations were up by 0.6%. Permits for buildings with five or more units fell by 0.6%. Starts are up on a Y/Y comparison but forward-looking permits are down 13.0% Y/Y. Homebuilder confidence fell in August for the first time in 2023. The NAHB/Wells Fargo Housing Market Index dropped by six points to 50 (neither expanding or contracting) as rising mortgage rates, a shortage of workers, and high construction costs create headwinds for homebuilders.
The Conference Board’s Leading Economic Index®, a reliable recession indicator, declined for a 16th consecutive month in July, down by 0.4%. The July reading reflects further deterioration in the gauges of consumer expectations, ISM new orders index, a negative yield spread and worsening credit conditions. The trend in the index continues to point to weaker economic activity ahead. The Conference Board expects the U.S. economy will contract over the Q4 2023 to Q1 2024 time frame.
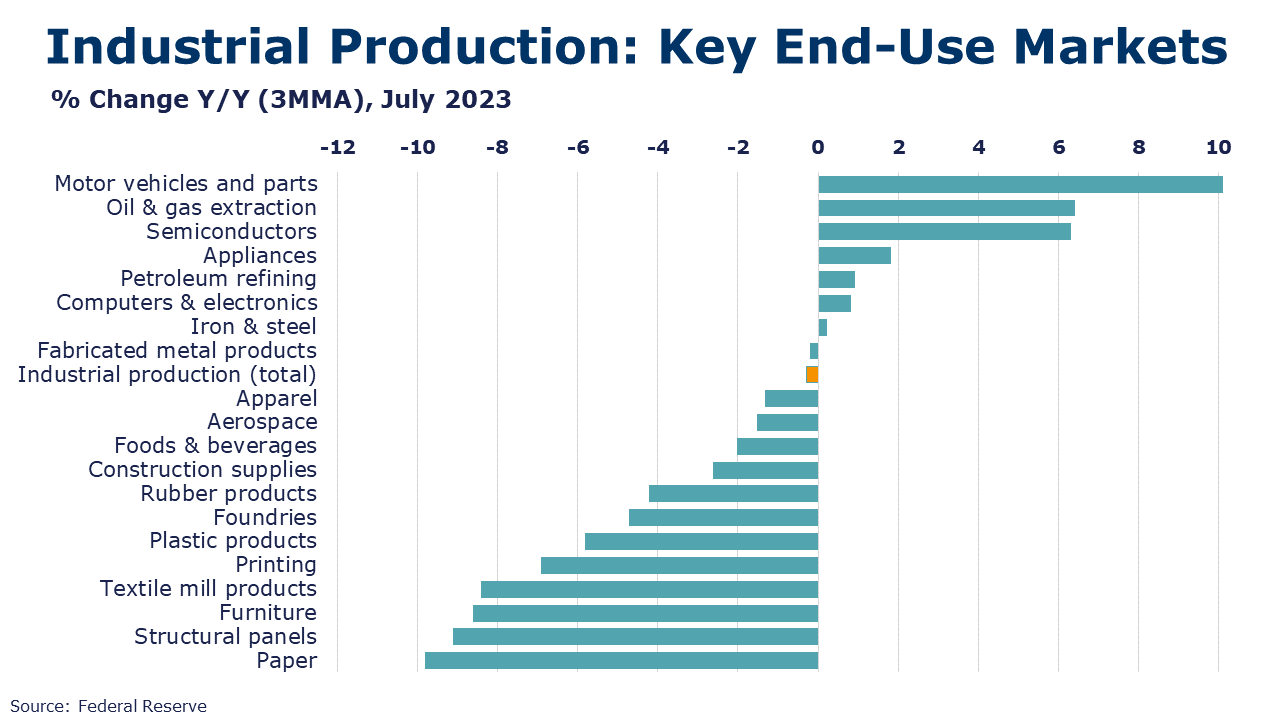
Industrial production surged by 1.0% in July, well above expectations. The hottest July on record boosted utility output and following contractions in May and June, both mining and manufacturing output rose. Manufacturing output rose by 0.5%, led by sharply higher production of motor vehicles and parts. Motor vehicle assemblies jumped to an 11.87 million pace, the highest in three years. There were also gains in the output of machinery, computers & electronics, appliances, textile mill products, semiconductors, rubber products, and aerospace. These gains were partially offset by lower output of furniture, plastic products, paper, fabricated metal products and construction supplies. Overall industrial production remained lower than a year ago by 0.2%. Capacity utilization tightened in July, up 0.7 points to 79.3%, still below last July’s 80.7%. Over the past year, overall industrial capacity was 1.6% higher.
Combined business sales were $1,818.6 billion in June, slightly lower (by 0.1%) than the previous month and down 3.1% Y/Y. Business inventories stayed flat from May to June, at $2,541.1 billion; inventories were up 2.0% Y/Y and the total business inventories-to-sales ratio was up Y/Y to 1.40 in June, compared to 1.33 a year ago. Motor vehicles inventories were 25.5% higher than June 2022.
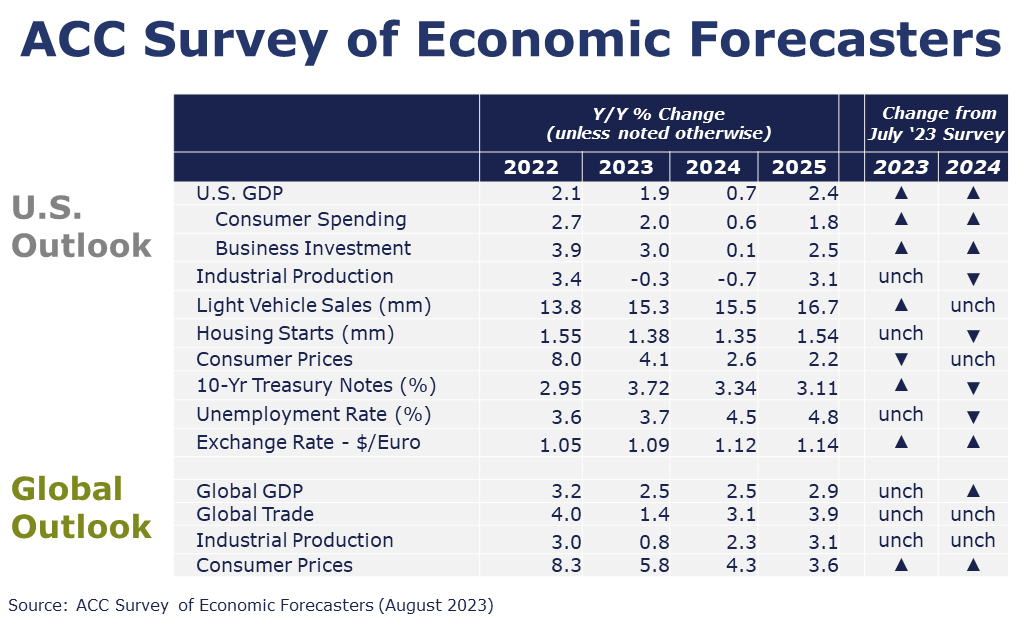
Each month, ACC’s Economics & Data Analytics Department collects forecasts from economic professionals who have a track record for accuracy and expert knowledge of manufacturing. The following are some of the most recent results.
U.S. Forecasts:
- While resilient consumer spending and stronger-than-expected investment have improved the odds of a “soft landing”, we continue to expect a short, shallow recession in the U.S. economy, but delayed until the end of this year into Q1. As a result, we have raised our 2023 forecast and downgraded 2024.
- Compared to July, our expectations for 2023 have improved for GDP consumer spending, business investment and vehicle sales.
- U.S. GDP is expected to grow by 1.9% in 2023 and to weaken (+0.7%) in 2024.
- Consumer spending growth is expected to slow to a 2.0% Y/Y pace in 2023 (from 2.7% in 2022) and slow further to a 0.6% gain in 2024.
- Dampened by higher borrowing costs, growth in business investment is also expected to decelerate to a 3.0% pace in 2023 before essentially stalling in 2024.
- We still look for industrial production to contract by 0.3% in 2023 and ease a further 0.7% in 2024.
- Despite higher borrowing costs, vehicle production continues to be a relatively bright spot in an otherwise lackluster outlook. As a result, sales of autos and light trucks are expected to grow to 15.3 million in 2023 (still below trend) and 15.5 million in 2024.
- While it has struggled with high prices, labor costs, and mortgage rates, new homebuilding is finding some support from historically low inventories of existing homes. Housing starts are expected to come in at 1.38 million in 2023 before weakening to a 1.35 million pace in 2024.
- The unemployment rate is expected to move higher from 50-year lows to average 3.7% in 2023 and 4.5% in 2024.
- Recent data suggests that inflation is slowing, though it has a way to go to get back to the Fed’s target. Growth in consumer prices is expected to decelerate to a 4.1% pace in 2023 and 2.6% in 2024 (down from 8.0% in 2022).
- Expectations for interest rates (10-year Treasury) were slightly higher for 2023, but lower for 2024.
Global Forecasts:
- The consensus assessment of the global economic situation this year and in the near-term was hardly changed from last month. The forecasts for world economic activity this year held steady at 2.5%. Expectations for 2024 global GDP growth pushed up slightly to a 2.5% pace.
- Estimates on the pace of inflation this year and next were revised upwardly. Global inflation is forecast to grow at a 5.8% pace this year and moderate further to a 4.3% pace in 2024.
- Global trade growth forecasts were unchanged from July. Trade volumes are expected to have grown at an average 1.4% pace this year and improve to a 3.1% pace in 2024. The industrial sector will eek out 0.8% growth overall this year and pick up some steam, growing by 2.3% in 2024.
ENERGY
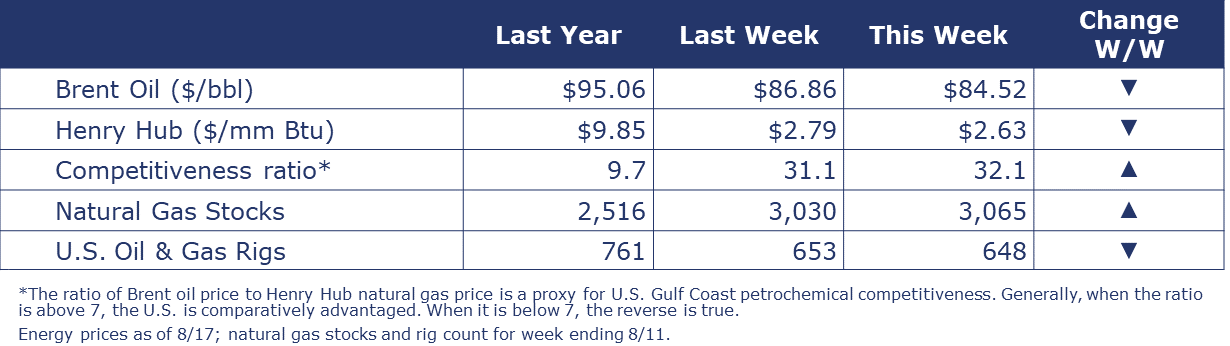
Following several weeks of steadily higher prices, oil prices eased this week on worries about the Chinese economy. U.S. natural gas prices eased from last week as summer cooling season starts to wind down. The combined oil and gas rig count fell by five to 648 at the end of last week.
CHEMICALS
Indicators for the business of chemistry bring to mind a red banner.
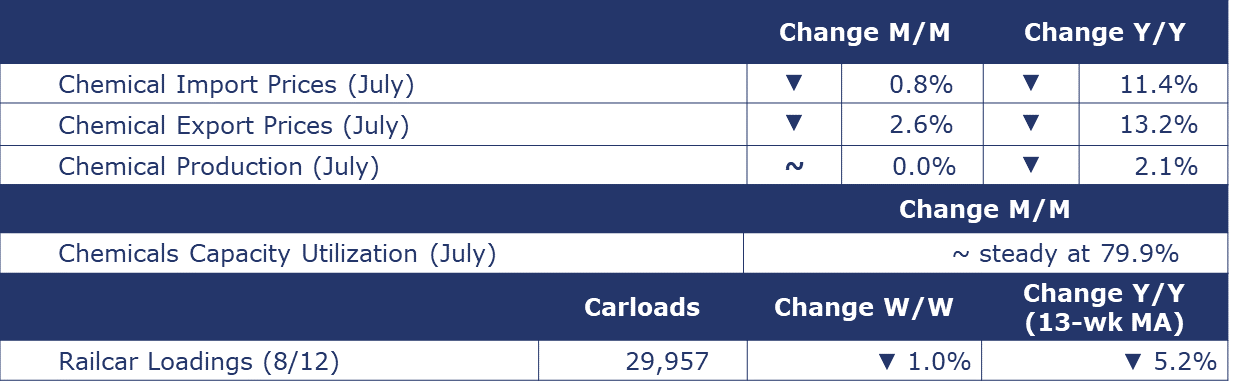
Chemical production was essentially flat in July, following a 1.3% gain in June. Output of basic industrial chemicals was sharply higher (up 3.1%) with strong gains in organic and inorganic chemicals. Plastic resin output was also higher, but production of synthetic rubber and manufactured fibers was lower. Those gains were partially offset by lower production of coatings, adhesives, and other specialty chemicals, fertilizers, crop protection chemicals and consumer products. Compared to last July, chemicals output was off 2.1% Y/Y.
Chemicals import prices fell 0.8% in July, the sixth consecutive month of declines. Chemicals export prices declined 2.6% in July following a 1.0% decrease the previous month. On a Y/Y basis, import prices are down 11.4% and export prices are down 13.2%
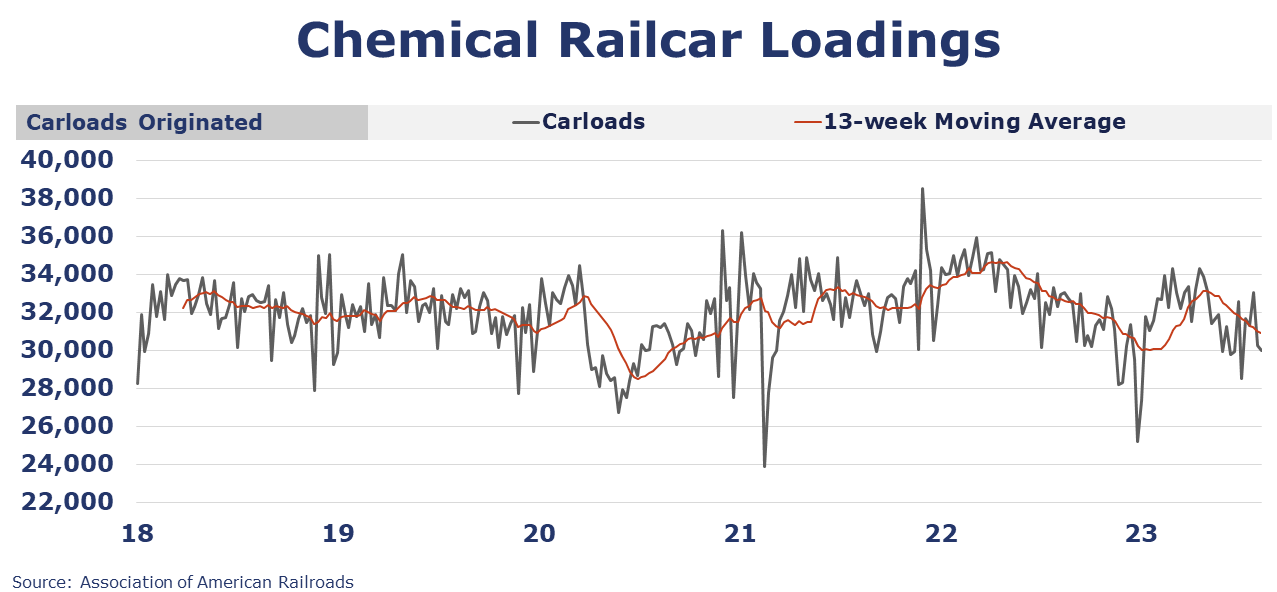
According to data released by the Association of American Railroads, chemical railcar loadings were down 307 to 29,957 for the week ending August 12. Loadings were down 5.2% Y/Y (13-week MA), down 3.8% YTD/YTD and have been on the rise for 7 of the last 13 weeks.
Note On the Color Codes
The banner colors represent observations about the current conditions in the overall economy and the business chemistry. For the overall economy we keep a running tab of 20 indicators. The banner color for the macroeconomic section is determined as follows:
Green – 13 or more positives
Yellow – between 8 and 12 positives
Red – 7 or fewer positives
For the chemical industry there are fewer indicators available. As a result, we rely upon judgment whether production in the industry (defined as chemicals excluding pharmaceuticals) has increased or decreased three consecutive months.
For More Information
ACC members can access additional data, economic analyses, presentations, outlooks, and weekly economic updates through ACCexchange.
In addition to this weekly report, ACC offers numerous other economic data that cover worldwide production, trade, shipments, inventories, price indices, energy, employment, investment, R&D, EH&S, financial performance measures, macroeconomic data, plus much more. To order, visit http://store.americanchemistry.com/.
Every effort has been made in the preparation of this weekly report to provide the best available information and analysis. However, neither the American Chemistry Council, nor any of its employees, agents or other assigns makes any warranty, expressed or implied, or assumes any liability or responsibility for any use, or the results of such use, of any information or data disclosed in this material.
Contact us at ACC_EconomicsDepartment@americanchemistry.com.


