April 7, 2023
(press release)
–
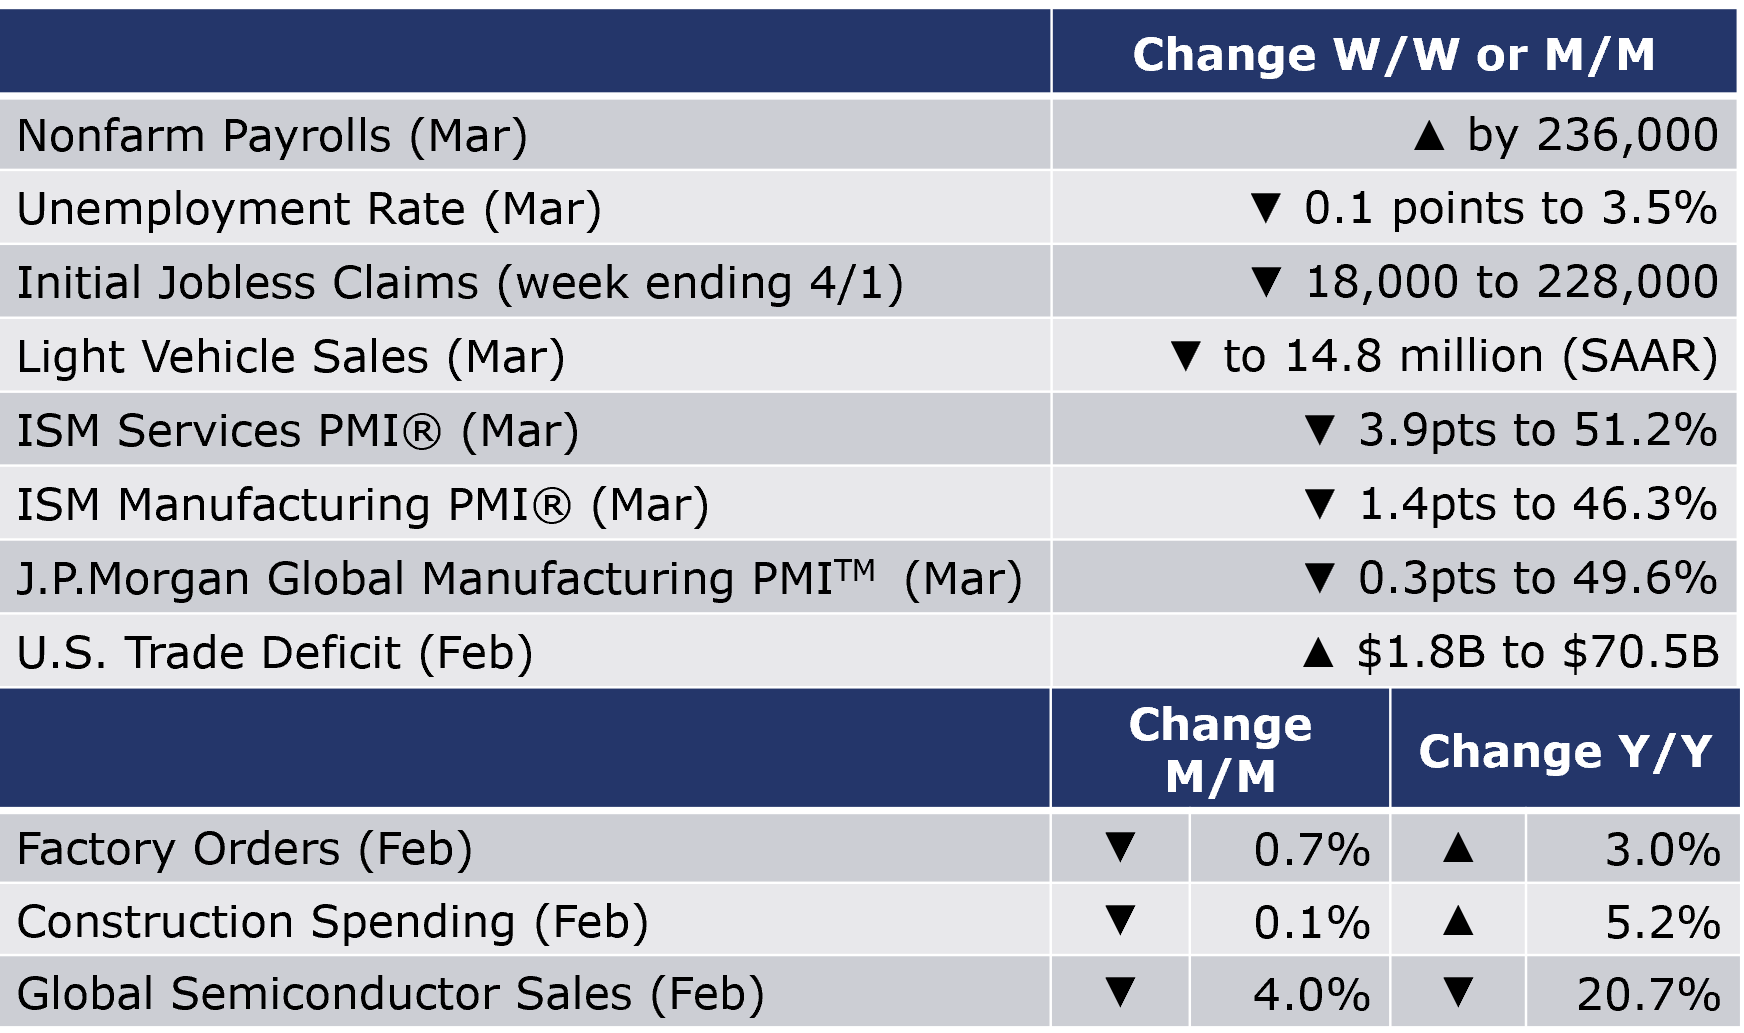
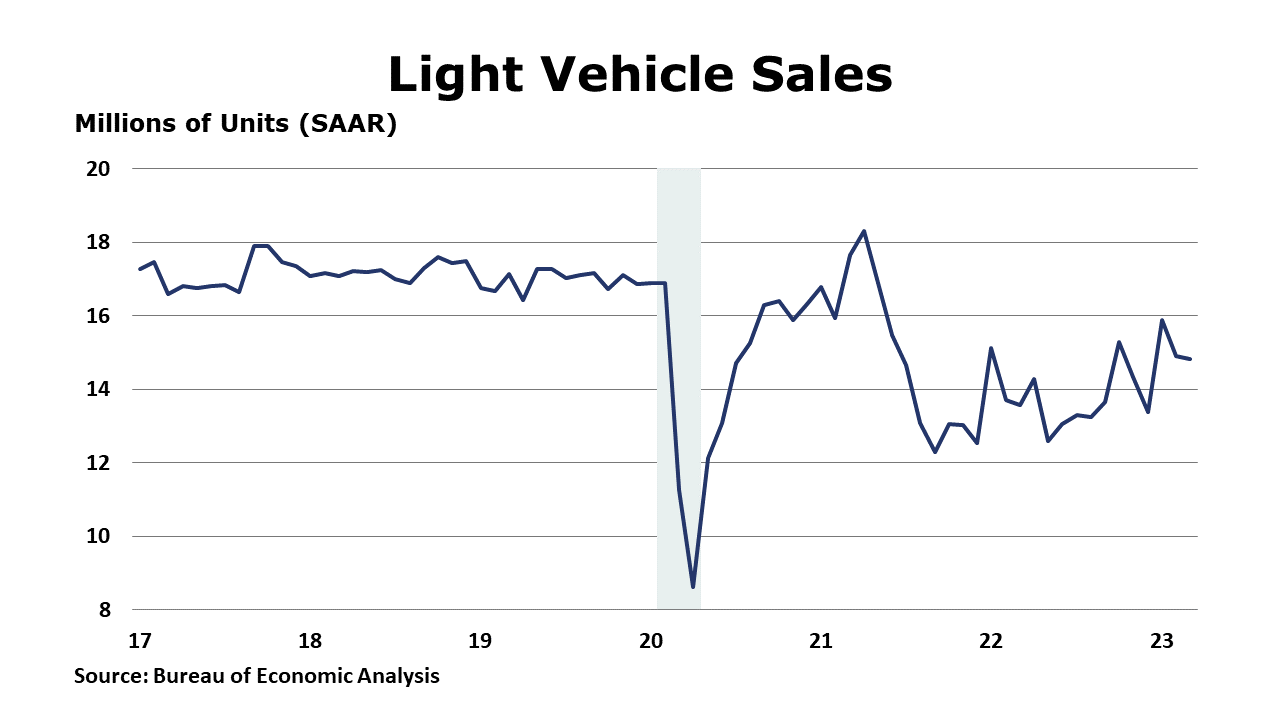
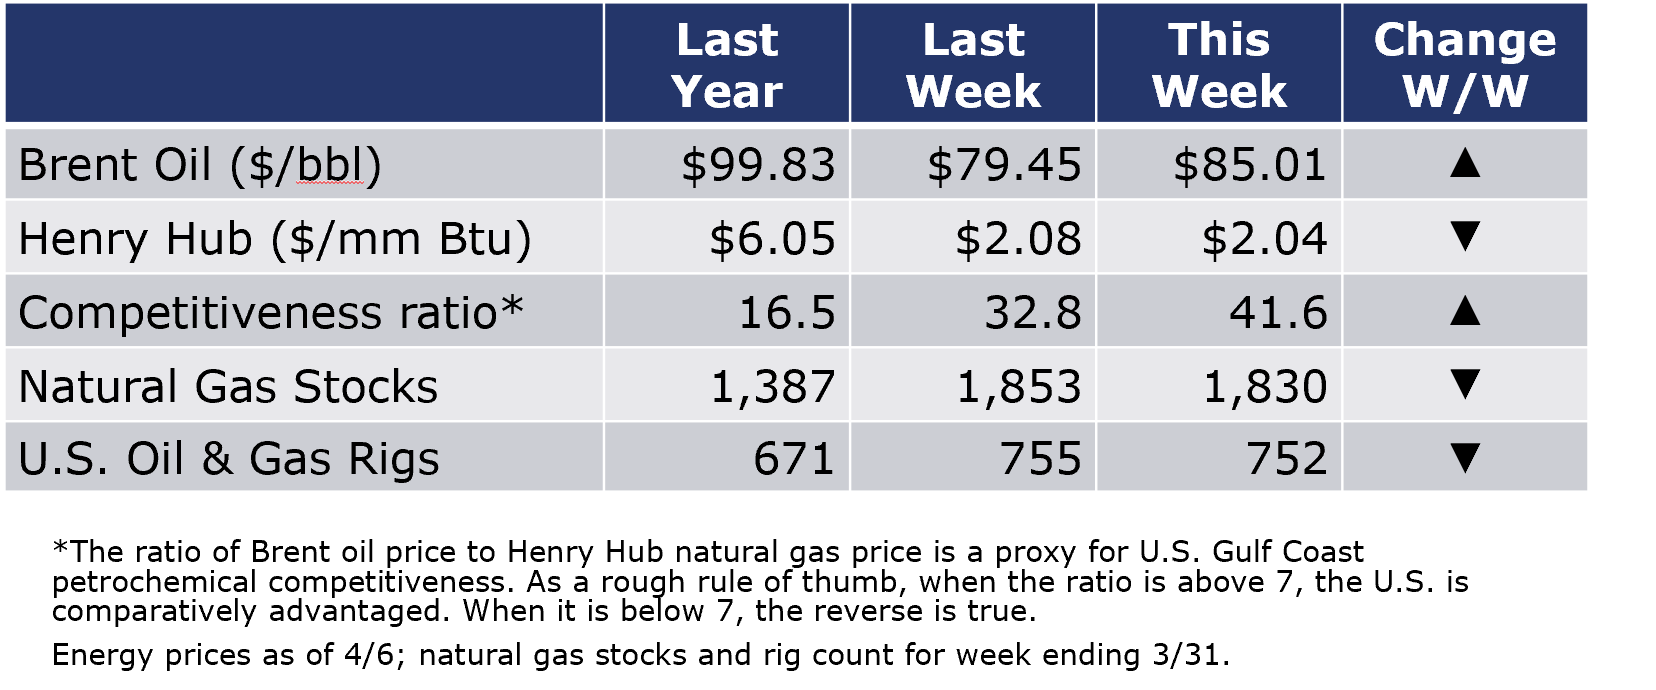
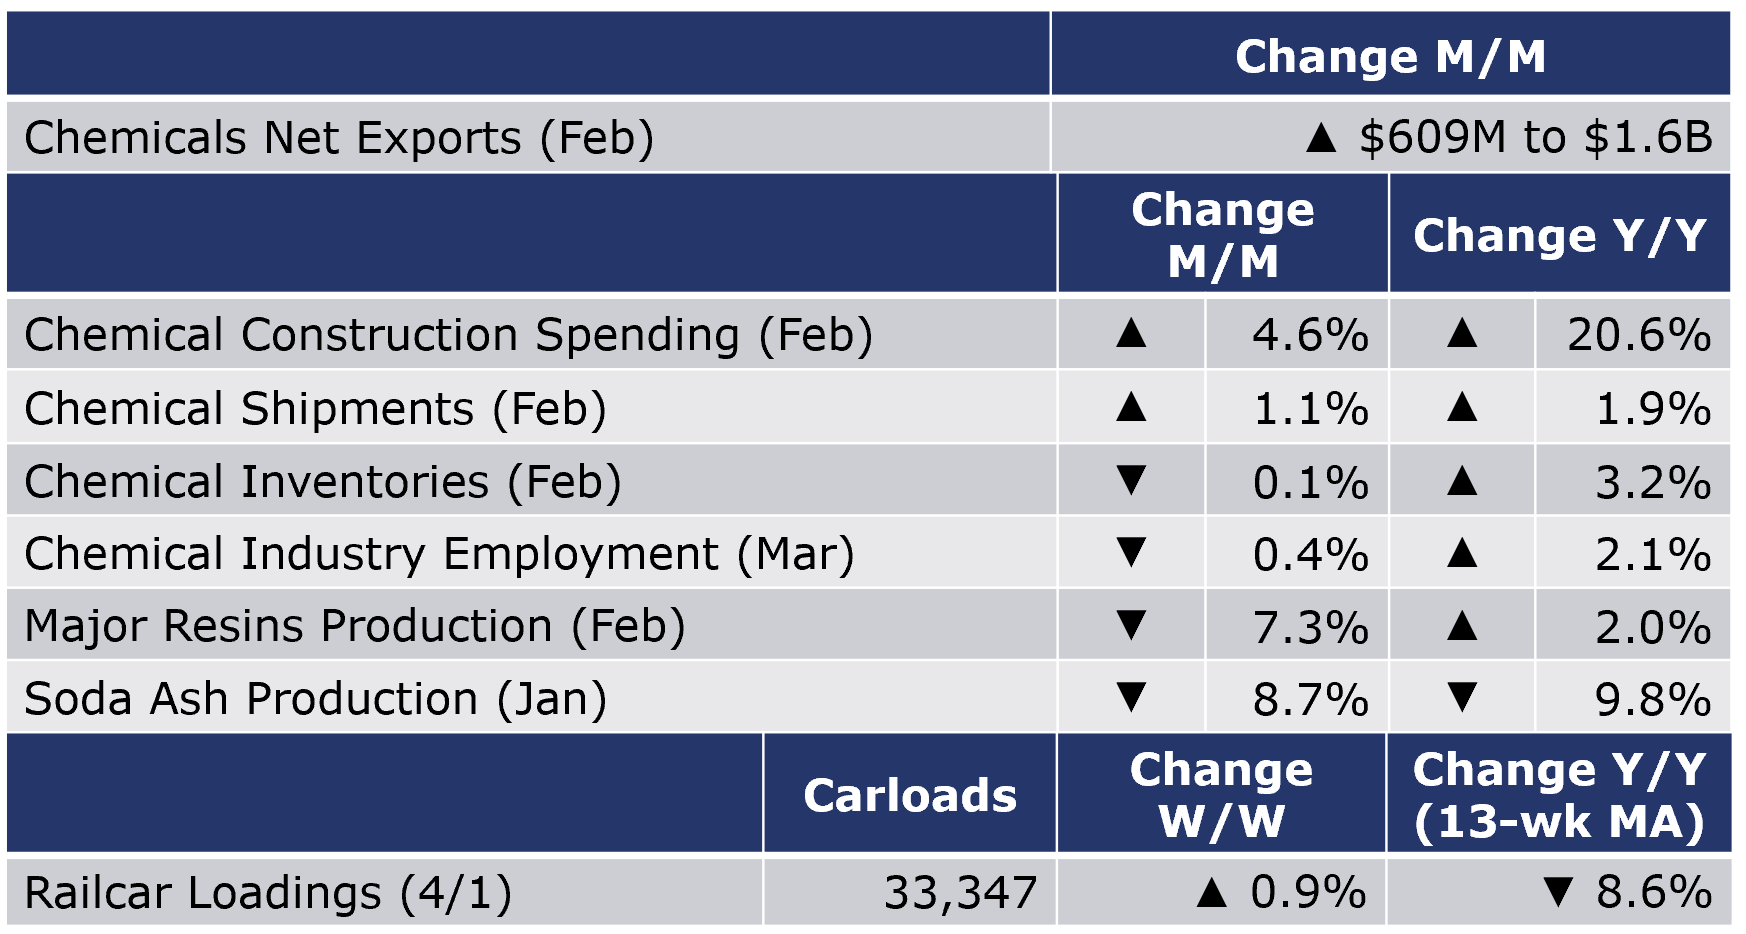
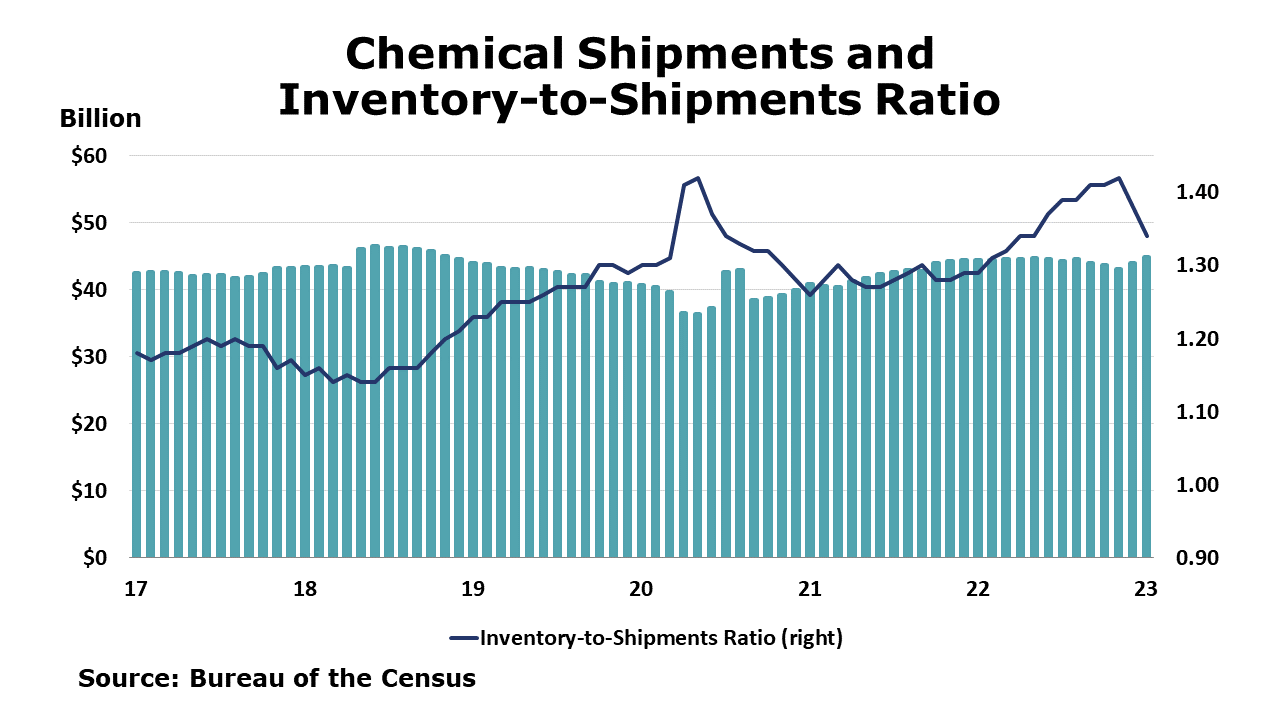
Running tab of macro indicators: 7 out of 20 Job growth slowed in March as nonfarm payrolls rose by 236,000, as expected. While employment in many service sectors continued to expand, jobs declined in construction, manufacturing and retail trade. Employment in temporary help services (a bellwether for broader employment trends) also fell in March. Hourly wages rose by 4.2% Y/Y, down from the 4.6% pace last month. Weekly hours worked also edged lower. The civilian labor force continued to expand and new entrants were absorbed into the ranks of the employed. As a result, the number of unemployed people fell and the unemployment rate eased to 3.5%, near its 50-year low. The participation rate (share of the working age population that wants to work) rose to 62.6%, the highest level since the pandemic began. The number of new jobless claims decreased by 18,000 to 228,000 during the week ending 1 April. Continuing claims increased by 6,000 to 1.82 million, and the insured unemployment rate for the week ending 25 March was 1.3%, unchanged from the previous week’s revised rate. Another sign of a cooling labor market, job openings fell 6% in February to 9.9 million, the lowest level in nearly two years. There were 1.7 jobs available for every unemployed person. The gap between the number of jobs available in the economy (the number of employed people + job openings) and the number of workers available in the economy (civilian labor force) fell below 4 million for the first time since September 2021. The ISM Services PMI® was 3.9 points lower in March at 51.2%, indicating the U.S. services sector continues to expand at a slower pace. Except for a contraction in December, services have grown 33 of the last 34 months. The report for March indicated that there was a pullback in the growth rate due to a cooling off in the new orders growth rate, employment growth that varies by industry, and continued improvements in capacity and logistics, which is a positive impact on supplier performance. Sales of light vehicles (autos & light-duty trucks) eased for a second straight month in March to a 14.8 million seasonally adjusted annual rate (SAAR). Sales were lower in both passenger cars and light trucks. Sales were ahead of last March’s 13.6 million (SAAR). Sales remain well below pre-pandemic levels as some remaining shortages of materials and higher lending rates constrain the market. Construction spending declined 0.1% in February but was up 5.2% Y/Y. Residential construction remained the same. Spending on multi-family home construction rose 1.4% while spending on chemistry-intensive single family home construction fell 1.8%. Higher non-residential spending was influenced by a 2.7% increase in manufacturing which was up 53.8% Y/Y. Public spending on construction fell by 0.2% but was 12.8% higher Y/Y. The US deficit in goods and services trade widened by 2.7% to $70.5 billion in February. Both exports and imports fell over the month. Good exports were down across all major categories. Exports declined in natural gas, cars, pharmaceuticals, and aircraft. Imported goods were down as well. Imports declined in consumer goods, autos and other vehicles. Led by a decline in transportation equipment, headline factory orders fell by 0.7% in February. The only increases were in transmission power equipment, iron foundries, and mining & oil and gas field machinery. Core business orders (nondefense capital goods excluding aircraft) fell by 0.1%, virtually the same as the last three months. Unfilled orders (a measure of the manufacturing pipeline) were down 0.1%. Manufacturing shipments declined 0.5% while inventories declined 0.1% in February, the same as January. The manufacturing inventories-to-sales ratio was 1.49, virtually unchanged from January and December. The ISM Manufacturing PMI® was down 1.4 points to 46.3% in March as activity in the U.S. industrial contracted for the fifth month in a row. New orders were down for a seventh month, new export orders were down for an eight month, and production was down for a fourth month. The employment index was down again as panelists indicate the gap between hiring and holding staff is narrowing. Manufacturers projecting growth later this year may be hesitant to let go of hard-to-find workers. Faster supplier deliveries are alleviating pressure across supply chains. Manufacturers continue to work down inventories. Customer inventories are just about “right” which would be less accommodative to future demand. Input/ raw materials costs are declining. Manufacturers are working off order backlogs as new demand has been soft. The J.P.Morgan Global Manufacturing PMITM fell 0.3 points to 49.6% in March, indicating two months in a row of contraction. Output expanded though at a slightly lower rate. Both new orders and export orders declined in March. Inflationary pressures are easing and manufacturers are facing slower gains in input costs and slower gains in selling price inflation. Supply chain conditions continue to improve. Global semiconductor sales fell by 4.0% in February to $39.7 billion. Sales were lower across all regions. Compared to last February, sales were down by 20.7%. SIA noted that the global semiconductor market cooled off over the last six months because of short-term cyclicality and macroeconomic headwinds. Oil prices moved sharply higher on a surprise announcement from Saudi Arabia and OPEC+ to cut an additional 1 million bpd of production beginning in May. Naphtha prices also moved higher. U.S. natural gas prices remained subdued. Spring is in the air. The combined oil and gas rig count fell by three to 752. For the business of chemistry, the indicators bring to mind a yellow banner for basic and specialty chemicals. According to data released by the Association of American Railroads, chemical railcar loadings were up 0.9% to 33,347 for the week ending April 1. Loadings were down 8.6% Y/Y (13-week MA), down 6.8% YTD/YTD and have been on the rise for 8 of the last 13 weeks. US chemicals trade flows contacted in February. US chemical exports declined by 3.5% to $13.0 billion in February, a level down 2.7% Y/Y. Exports of petrochemicals which are typically about 60% of total monthly exports, fell 5.3% to $7.5 billion. Imports were also down in February. Overall, chemical imports fell by 8.7% in the month. Declines were across all categories except for inorganics. The US trade surplus in chemicals increased by $609 million to $1.6 billion in February. Chemical industry construction spending rose 4.6% in February and was up 20.6% Y/Y. Chemical construction spending as a percent of total manufacturing construction spending was 24.4% in February. The comparison has been softening gradually after climbing to a sustained high proportion (around 46%) during 2014-2017. Chemical shipments rose in February, up by 1.1%. Increases in coatings and adhesives were offset by lower sales in agricultural chemicals and all other categories. Chemical inventories continued to move lower for a fifth consecutive month, down by 0.1%, with declines across all segments (except a small gain in coatings & adhesives). Compared to a year ago, chemical shipments were up 2.3% while agricultural chemical inventories were 3.2% higher. The inventories-to-shipments ratio fell slightly from 1.34 in January to 1.33 in February. Inventories are still high relative to shipments but are moving toward a more balanced position. According to data from ACC, U.S. production of major plastic resins totaled 7.5 billion pounds during February, down 7.3% M/M and up 2.0% Y/Y. Year-to-date production was 15.6 billion pounds, a 1.0% increase Y/Y. Sales and captive (internal) use of major plastic resins totaled 7.4 billion pounds down 4.2% M/M and up slightly (0.3%) Y/Y. Year-to-date sales and captive use were 15.2 billion pounds, a 2.0% increase Y/Y. Details of the ISM Manufacturing PMI® report suggest, the chemical industry activity continued to contract through March. New orders and new exports were down and both production and employment declined in March. Chemical manufacturers have been working off order backlogs and working down inventories. Supplier deliveries have been faster reflecting reduced supply chain pressures. Inflationary pressures have eased as well as chemical manufacturers report declining input/raw material costs. Chemical industry (including pharmaceuticals) employment fell by 4,000 in March, following an increase in February. There were gains in both supervisory/non-production and production workers. The average workweek expanded by 12 minutes to 41.7 hours, the highest in nearly two years. The total labor input into chemical manufacturing fell suggesting that chemical industry output fell in March, consistent with the ISM Manufacturing PMI report. The U.S. Geological Survey reported that monthly production of soda ash in January was 884 thousand tons, down 8.7% compared to the previous month and down 9.8% Y/Y. Stocks fell 16.8% over December to 303 thousand tons at the end of the month, an 11day supply. Ending stocks were up 5.9% Y/Y. The banner colors represent observations about the current conditions in the overall economy and the business chemistry. For the overall economy we keep a running tab of 20 indicators. The banner color for the macroeconomic section is determined as follows: Green – 13 or more positives For the chemical industry there are fewer indicators available. As a result we rely upon judgment whether production in the industry (defined as chemicals excluding pharmaceuticals) has increased or decreased three consecutive months. ACC members can access additional data, economic analyses, presentations, outlooks, and weekly economic updates through ACCexchange. In addition to this weekly report, ACC offers numerous other economic data that cover worldwide production, trade, shipments, inventories, price indices, energy, employment, investment, R&D, EH&S, financial performance measures, macroeconomic data, plus much more. To order, visit http://store.americanchemistry.com/. Every effort has been made in the preparation of this weekly report to provide the best available information and analysis. However, neither the American Chemistry Council, nor any of its employees, agents or other assigns makes any warranty, expressed or implied, or assumes any liability or responsibility for any use, or the results of such use, of any information or data disclosed in this material. Contact us at ACC_EconomicsDepartment@americanchemistry.comMACROECONOMY & END-USE MARKETS

ENERGY
CHEMICALS

Note On the Color Codes
Yellow – between 8 and 12 positives
Red – 7 or fewer positivesFor More Information
* All content is copyrighted by Industry Intelligence, or the original respective author or source. You may not recirculate, redistrubte or publish the analysis and presentation included in the service without Industry Intelligence's prior written consent. Please review our terms of use.


