MACROECONOMY & END-USE MARKETS
Running tab of macro indicators: 13 out of 20
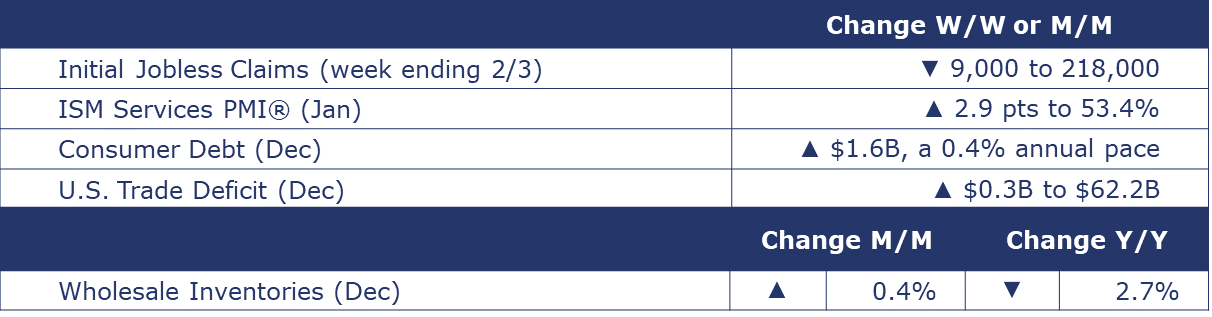
The number of new jobless claims fell by 9,000 to 218,000 during the week ending February 3. Continuing claims fell by 23,000 to 1.87 million, and the insured unemployment rate for the week ending January 27 was down 0.1% to 1.2%.
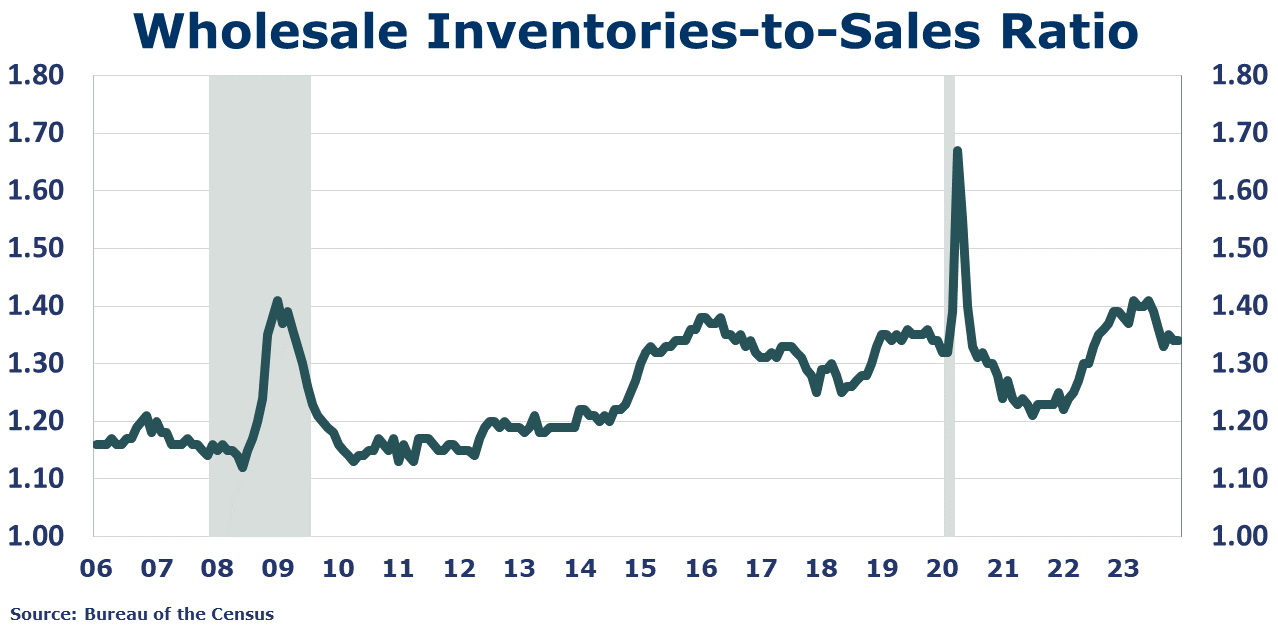
Wholesalers’ sales were $671 billion in December, up 0.7% from November and up 1.6% Y/Y. Wholesalers’ inventories were $897 billion, up 0.4% M/M and down 2.7% Y/Y. The inventory-to-sales ratio was 1.34, compared to 1.40 a year ago.
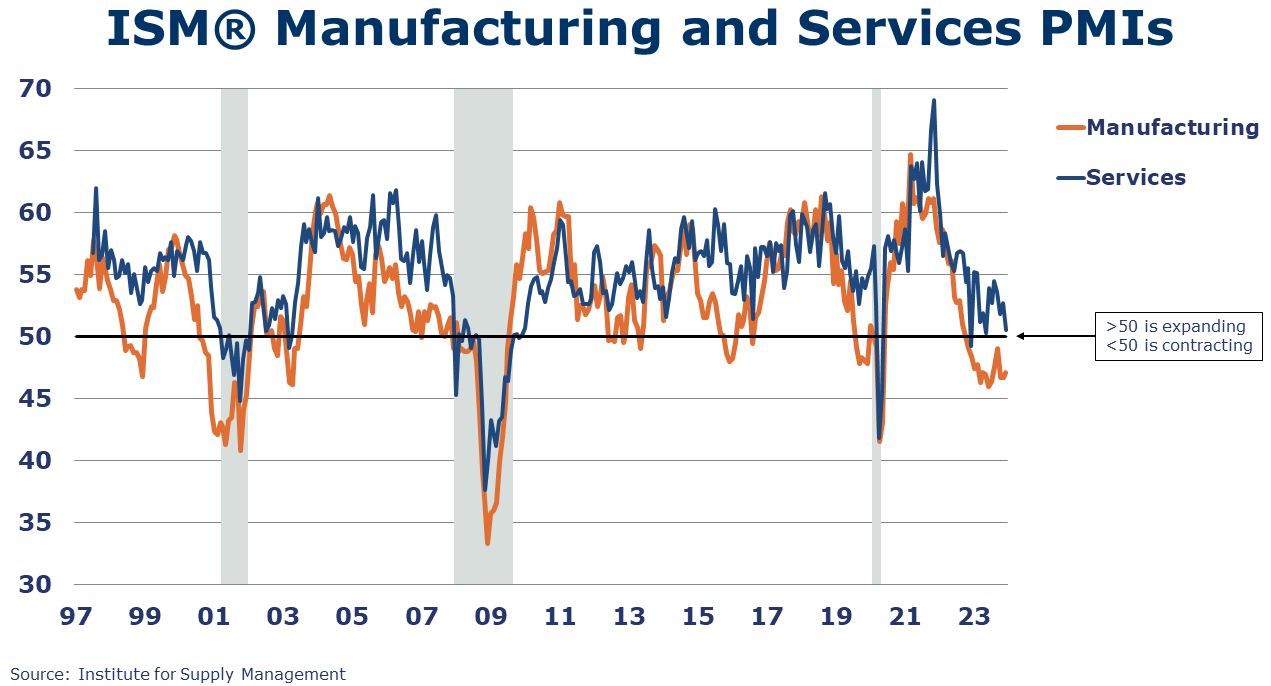
The ISM Services PMI® rose 2.9 percentage points to 53.4%, a reading indicating expansion in the services sector of the economy. The expansionary reading was the 13th consecutive. The index has pointed to expansion 43 of the last 44 months. The report about January included faster growth of new orders, growing employment (rebounded from contraction in December) and slower supplier deliveries. Respondents reported business was steady and optimism about the economy. However, prices paid and inflation are challenges.
The U.S. trade deficit in goods and services increased to $62.2 billion in December. Services exports and imports both rose. Both imports and exports of goods increased in December. Exports increased in consumer goods and industrial supplies and materials. Imports declined in automotive vehicles, parts, and engines; capital goods; and foods, feeds, and beverages.
Non-mortgage consumer debt rose again (more modestly) in December following a surge in November. Balances rose at a 0.4% annual pace to a new record $5.0 trillion. While non-revolving debt (e.g., car & student loans) continued to expand, the growth was driven by an increase in credit card balances (up by a 0.2% annual rate).
ENERGY
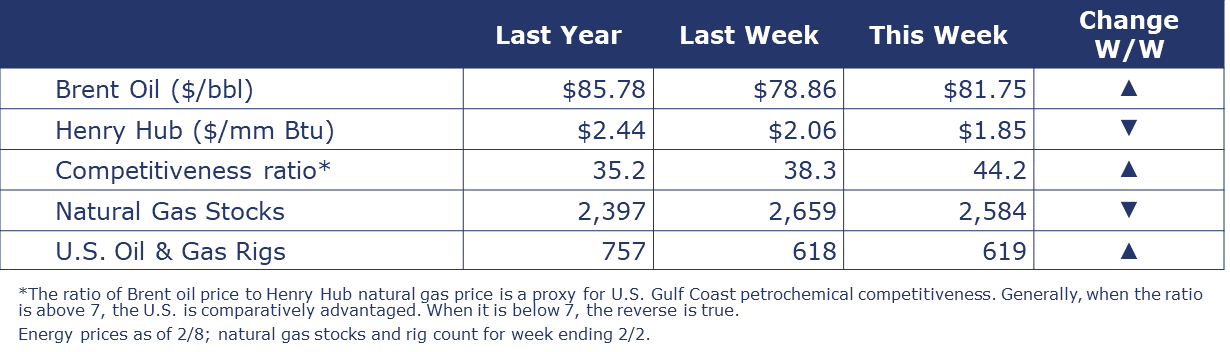
Oil prices, which fell at the end of last week on hopes of a truce in the Israel-Gaza war, reversed this week following Netanyahu’s rejection of a permanent ceasefire proposal from Gaza, and were on track for gains of almost 7% W/W. U.S. natural futures dipped below $2/mmbtu this week, the lowest level since the end of March 2023. Despite last month’s freeze, natural gas inventories remain near the top of the historic range. The combined oil and gas rig count was up one to 619.
CHEMICALS
Indicators for the business of chemistry bring to mind a yellow banner.

According to data released by the Association of American Railroads, chemical railcar loadings were up to 32,039 for the week ending February 3. Loadings were up 2.5% Y/Y (13-week MA), up (2.9%) YTD/YTD, and have been on the rise for 7 of the last 13 weeks.

Chemical wholesalers’ sales were $13.9 billion in December, up 0.1% compared to November but down 2.8% Y/Y. Chemical inventories were $14.5 billion, down 0.3% M/M and down 14.4% compared to a year ago. As a result, the chemicals inventories-to-sales ratio fell slightly from 1.05 in November to 1.04 in December, the lowest level in more than a decade.
U.S. chemicals exports rose 1.4% in December to $12.9 billion, a level down 5.9% Y/Y. Exports of agricultural chemicals and bulk petrochemicals and intermediates led the overall gain. Total chemicals exports were $164 billion in 2023, a level down 8.7% Y/Y. Plastic resin exports were down 1.7% in December. Plastic resin exports fell 11.6% over 2023 to a total of $38 billion. Chemical imports rose by 2.5% to $9.8 billion in December, a level down 15.2% Y/Y. The gain in December imports was driven by inorganics. Total chemical imports were $134 billion in 2023, down 13.4% Y/Y. The U.S. trade surplus in chemicals narrowed by 1.8% to $3.2 billion in December. The U.S. chemical trade surplus rose by nearly 20% over 2023, reaching an annual total of $30.1 billion.
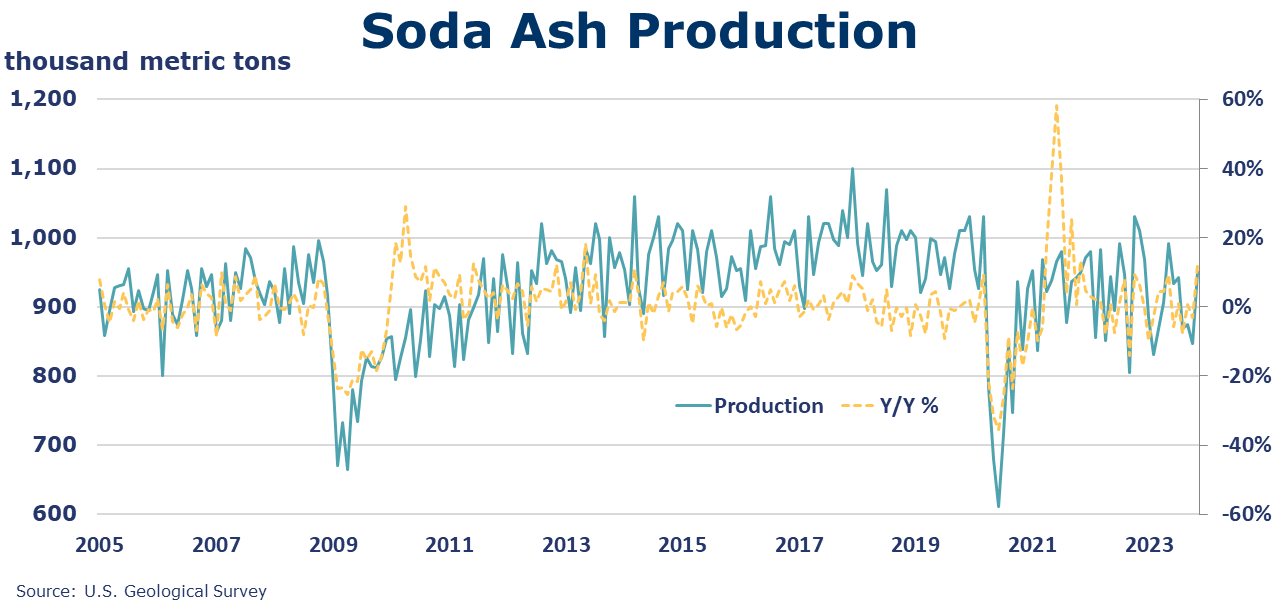
The U.S. Geological Survey reported that monthly production of soda ash in November was 951 thousand tons, up 12.3% compared to the previous month and down 5.8% Y/Y. Stocks rose 21.3% over October to 319 thousand tons at the end of the month, a 10-day supply. Ending stocks were down 7.8% Y/Y.
U.S. production of major plastic resins totaled 8.5 billion pounds during December, up 5.0% M/M and up 24.6% Y/Y according to ACC statistics. Year-to-date production was 96.7 billion pounds, up 5.0% Y/Y. Sales and captive (internal) use of major plastic resins totaled 8.2 billion pounds, up 4.4% M/M, and up 10.6% Y/Y. Year-to-date sales and captive use were 95.4 billion pounds, a 3.1% increase Y/Y.
Note On the Color Codes
Banner colors reflect an assessment of the current conditions in the overall economy and the business chemistry of chemistry. For the overall economy we keep a running tab of 20 indicators. The banner color for the macroeconomic section is determined as follows:
Green – 13 or more positives
Yellow – between 8 and 12 positives
Red – 7 or fewer positives
There are fewer indicators available for the chemical industry. Our assessment on banner color largely relies upon how chemical industry production has changed over the most recent three months.
For More Information
ACC members can access additional data, economic analyses, presentations, outlooks, and weekly economic updates through ACCexchange.
In addition to this weekly report, ACC offers numerous other economic data that cover worldwide production, trade, shipments, inventories, price indices, energy, employment, investment, R&D, EH&S, financial performance measures, macroeconomic data, plus much more. To order, visit http://store.americanchemistry.com/.
Every effort has been made in the preparation of this weekly report to provide the best available information and analysis. However, neither the American Chemistry Council, nor any of its employees, agents or other assigns makes any warranty, expressed or implied, or assumes any liability or responsibility for any use, or the results of such use, of any information or data disclosed in this material.
Contact us at ACC_EconomicsDepartment@americanchemistry.com.


