May 12, 2023
(press release)
–
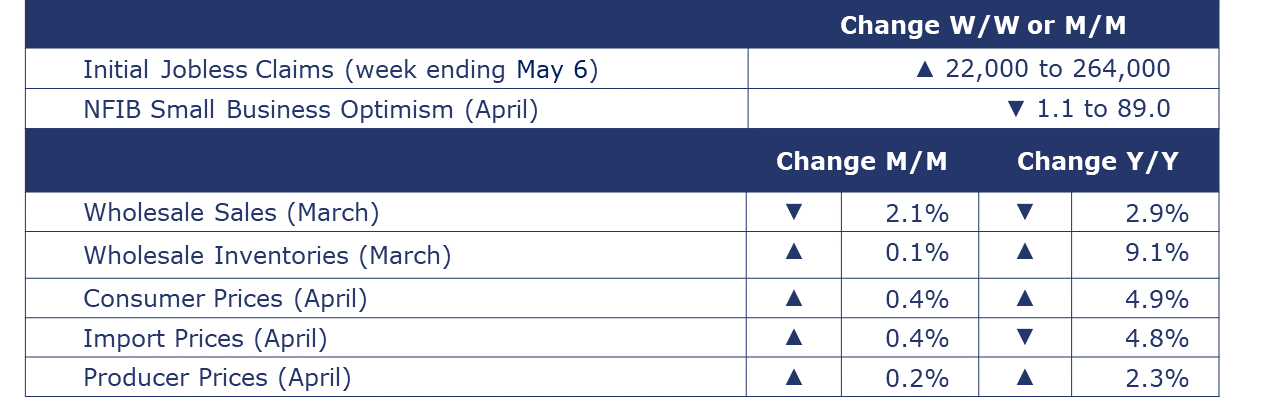
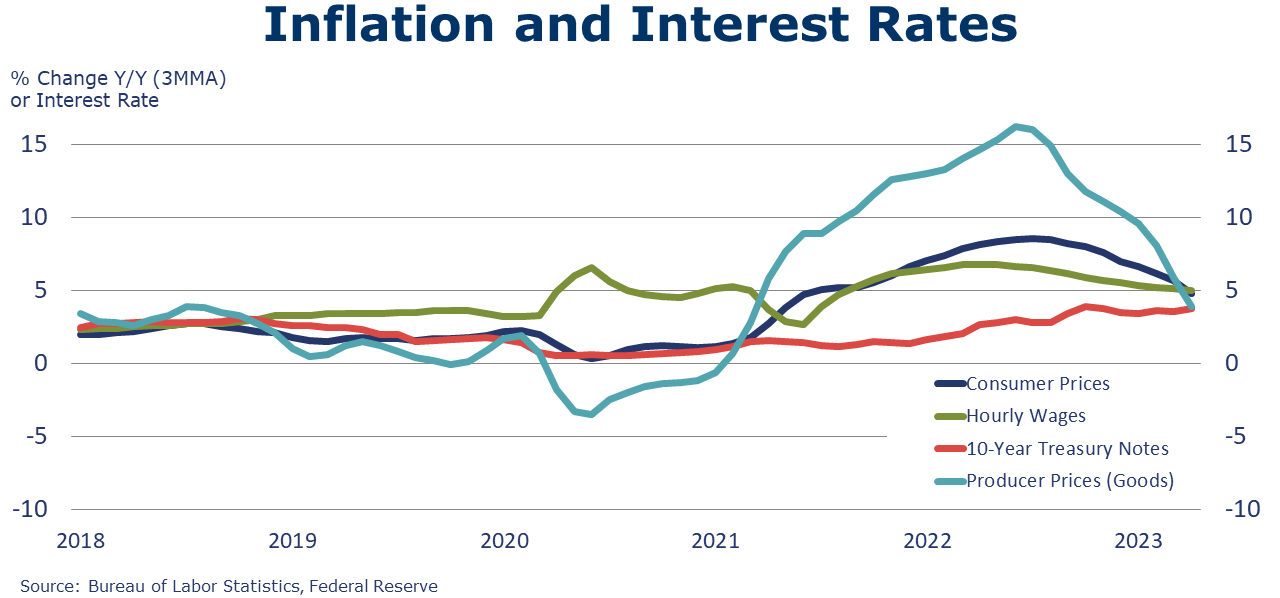
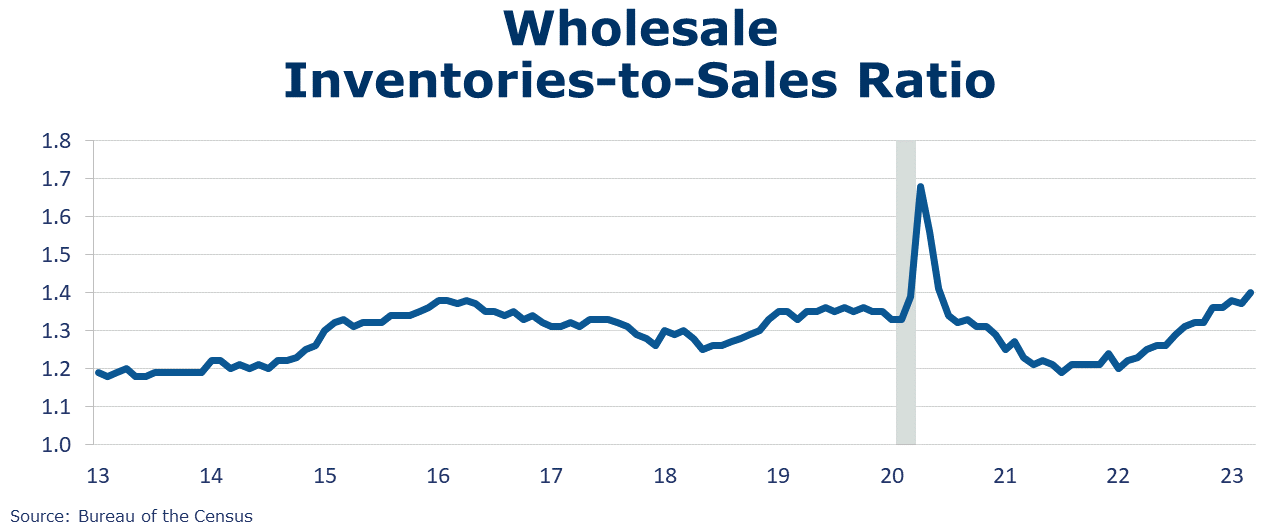
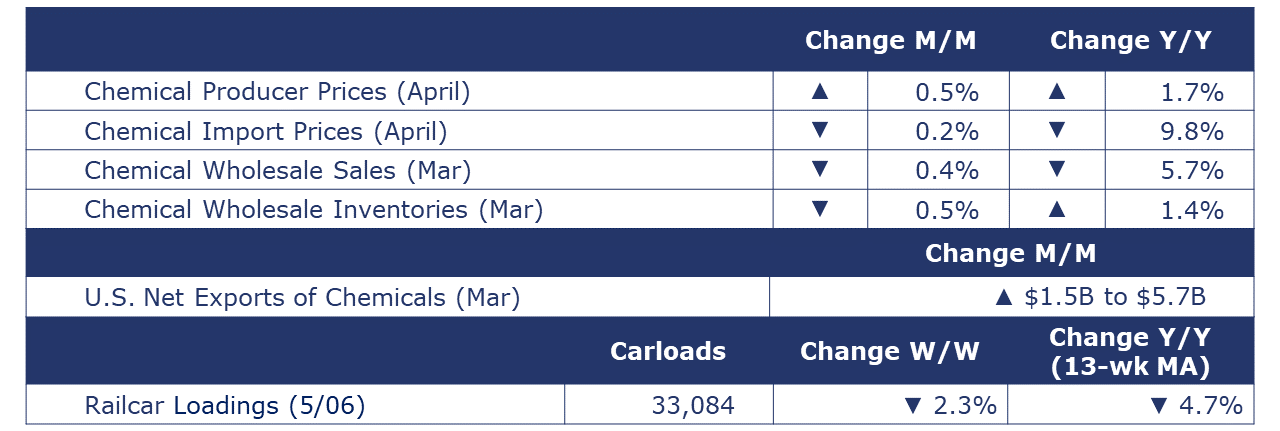
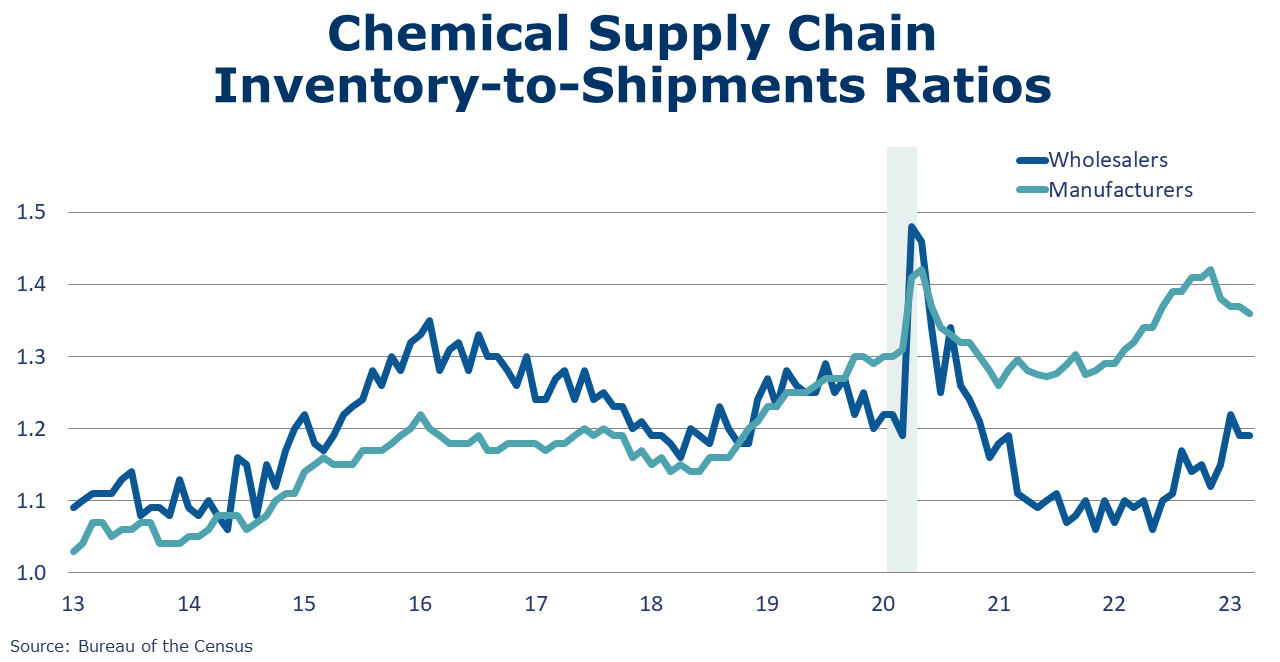
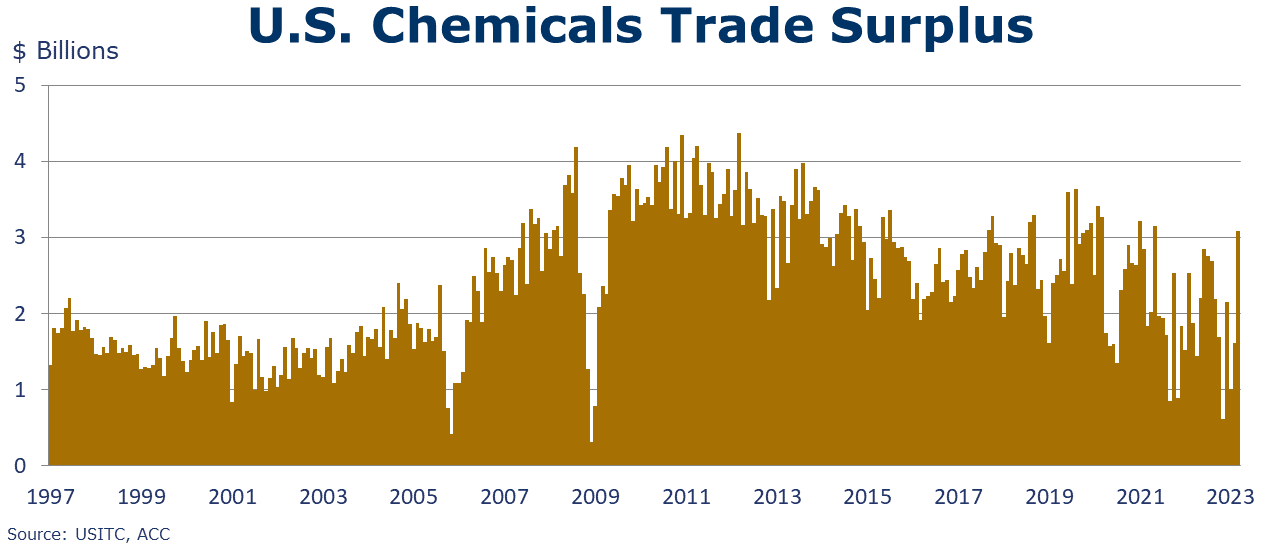
Running tab of macro indicators: 8 out of 20 The number of new jobless claims rose by 22,000 to 264,000 during the week ending May 6. Continuing claims increased/fell by 12,000 to 1.81 million, and the insured unemployment rate for the week ending April 29 was up/down/unchanged at 1.2%. Consumer prices increased (by 0.4%) in April and were up 4.9% from a year ago. Excluding the volatile food and energy components, core consumer prices were up 5.5% Y/Y. Both annual measures were their lowest since the latter part of 2021. Housing costs were the largest contributor to the monthly increase in the index for all items less food and energy. Headline producer prices increased slightly (by 0.2%) in April, driven by a rise in the index for final demand services. Core prices (prices less food, energy and trade services) also increased 0.2% in April, the largest increase since last November. Headline producer prices were up 2.3% Y/Y, the slowest pace in more than two years. For the 12 months ending in April, prices for processed goods for intermediate demand decreased 3.2%, the largest 12-month decline since falling 3.7% in July 2020. Following three months of declines, headline import prices were higher in April, up 0.4%, with higher prices for fuel imports offsetting flat growth in nonfuel exports. Export prices were also higher by 0.2%, with gains in prices for both agricultural and non-agricultural exports. Import prices were off 4.8% Y/Y while export prices were off 5.9% Y/Y. Wholesale sales declined 2.1% in March, following a 0.4% increase in February. Out of all categories, only furniture and drugs showed growth. Wholesale inventories increased by 0.1%, following a 0.6% decrease in February. Sales were down 2.9% Y/Y, while inventories were up 9.1% Y/Y. The inventories-to-sales ratio ticked up slightly to 1.40 compared to February and up from 1.25 in March 2022. Among the categories with the most significant monthly increase in the inventories-to-sales ratio were automotive, machinery, farm products, and alcohol. Oil prices, which had risen earlier in the week, dropped on Thursday as a political standoff over the U.S. debt ceiling continues. U.S. natural gas prices fluctuated throughout the week, as concern of an economic slowdown continues, but closed slightly higher than a week ago. Natural gas inventories continued to build as demand for natural gas declines, heading into the summer months. The combined oil and gas rig count fell by 7 to 745. Indicators for the business of chemistry bring to mind a yellow banner. According to data released by the Association of American Railroads, chemical railcar loadings were down 2.3% to 33,084 for the week ending May 6. Loadings were down 4.7% Y/Y (13-week MA), down 5.8% YTD/YTD and have been on the rise for 8 of the last 13 weeks. At the wholesale level, chemical sales were down 0.4% in March, following a 1.3% increase in February. Chemical wholesale inventories edged lower by 0.5% following a 1.2% decline in February. Compared to last March, sales were down 5.7% Y/Y while inventories were 1.4% Y/Y higher. The inventories-to-sales ratio for chemicals did not change (1.19) from February. Last March, the ratio was 1.10. U.S. chemical exports were up by 16.3% in March to $15.2 billion, a level down 4.7% Y/Y. Exports grew across all categories of chemicals. U.S. chemical imports also grew in March – by 5.8% to $12.1 billion, a level down 13.9% Y/Y. Imports were lower in most categories but expanded in consumer products, inorganics and coatings. The chemical trade surplus expanded by $1.5 billion to $3.1 billion in March and was up to $5.7 billion year-to-date. Chemical producer prices rose 0.5% in April as higher prices for plastic resins and synthetic rubber offset declines in inorganics and agricultural chemicals. Other chemical sectors showed slight increases (0.5% or less). Chemical producer prices were up 1.7% Y/Y (3MMA). Chemical import prices, however, moved lower by 0.2% in April, the third consecutive decline. Export prices edged slightly higher, up by 0.1%. Chemical import prices were up 9.8% Y/Y while export prices were off by 8.0% Y/Y. The banner colors represent observations about the current conditions in the overall economy and the business chemistry. For the overall economy we keep a running tab of 20 indicators. The banner color for the macroeconomic section is determined as follows: Green – 13 or more positives For the chemical industry there are fewer indicators available. As a result, we rely upon judgment whether production in the industry (defined as chemicals excluding pharmaceuticals) has increased or decreased three consecutive months. ACC members can access additional data, economic analyses, presentations, outlooks, and weekly economic updates through ACCexchange. In addition to this weekly report, ACC offers numerous other economic data that cover worldwide production, trade, shipments, inventories, price indices, energy, employment, investment, R&D, EH&S, financial performance measures, macroeconomic data, plus much more. To order, visit http://store.americanchemistry.com/. Every effort has been made in the preparation of this weekly report to provide the best available information and analysis. However, neither the American Chemistry Council, nor any of its employees, agents or other assigns makes any warranty, expressed or implied, or assumes any liability or responsibility for any use, or the results of such use, of any information or data disclosed in this material. Contact us at ACC_EconomicsDepartment@americanchemistry.com.MACROECONOMY & END-USE MARKETS
ENERGY

CHEMICALS
Note On the Color Codes
Yellow – between 8 and 12 positives
Red – 7 or fewer positivesFor More Information


* All content is copyrighted by Industry Intelligence, or the original respective author or source. You may not recirculate, redistrubte or publish the analysis and presentation included in the service without Industry Intelligence's prior written consent. Please review our terms of use.


