MACROECONOMY & END-USE MARKETS
Running tab of macro indicators: 10 out of 20
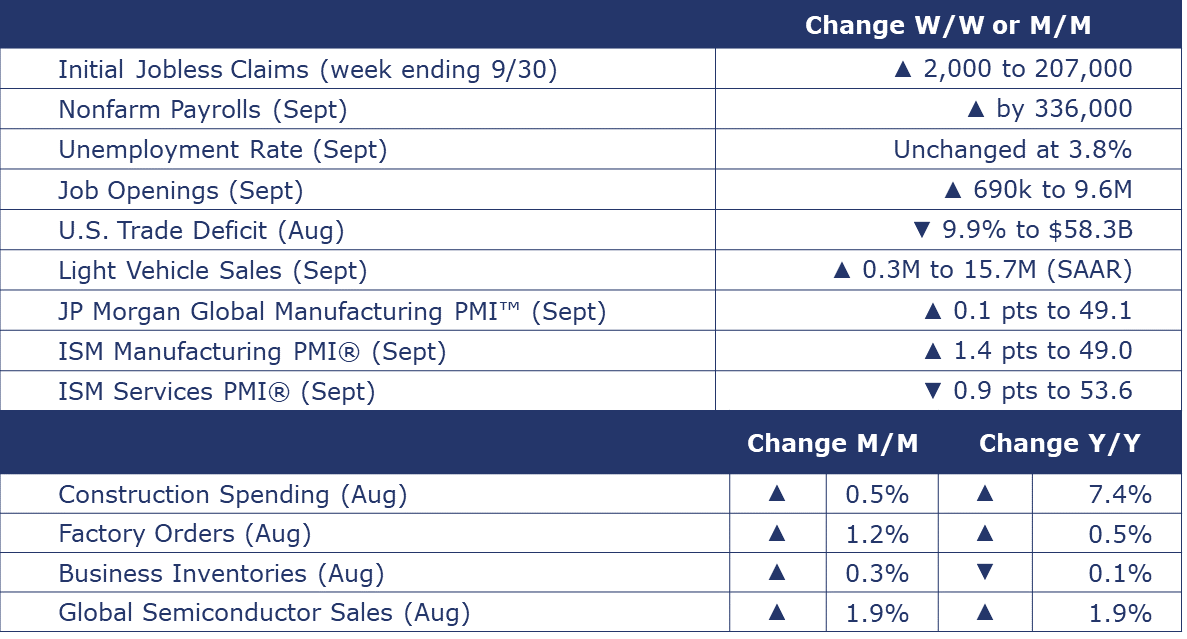
Defying expectations for slowing job growth, nonfarm payrolls surged by 336,000 in September, the largest monthly gain since January. Through August, monthly job growth averaged 250,000. September’s job gains were broad-based with nearly every major segment seeing an increase. Manufacturing employment rose by 17,000 but does not include much of the impact of the UAW strike that began on September 16th. Average hourly earnings were up 4.2% Y/Y to $33.88. While the pace of annual growth edged down to its lowest level in more than two years, it remains stubbornly high. Wage growth continued to exceed inflation last month, providing households with the ability to keep spending, and making the Fed’s job harder. The unemployment rate was essentially unchanged at 3.8%. The labor force edged slightly higher, the smallest gain since April. Most new entrants were employed. A sign of remarkable resiliency in the US labor market, job openings unexpectedly surged in August, up by 690,000 (or 7.7%) to 9.6 million. That level represents more than 1.5 job openings for every unemployed person. New hires and quits edged higher.
The number of new jobless claims rose by 2,000 to 207,000 during the week ending September 30. Continuing claims fell by 1,000 to 1.664 million, and the insured unemployment rate for the week ending September 23 was unchanged at 1.1%.
Construction spending rose by 0.5% in August to a pace up by 7.4% Y/Y. Private residential spending rose in both single-family and multi-family but levels overall remain down Y/Y. Manufacturing spending was up 1.2% in August and is up by 65.5% Y/Y.
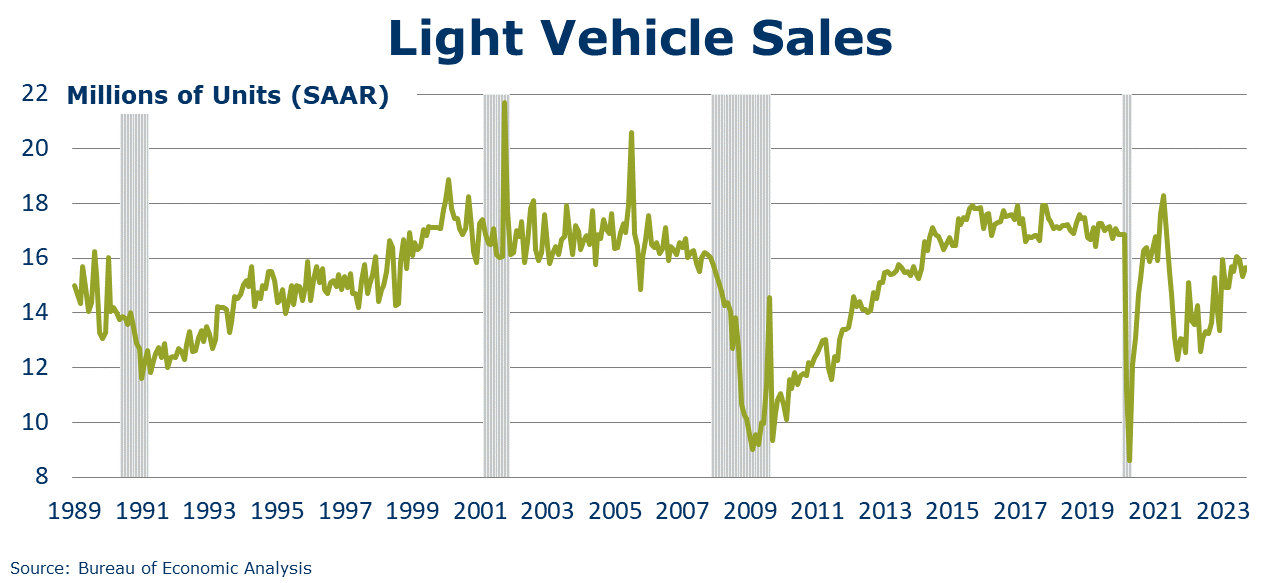
Following a decline in August, light vehicle sales rose by 0.3 million to a 15.7 million seasonally adjusted annual rate (SAAR). There were gains in sales of autos and light trucks. The UAW strike which began on September 15th had only a limited impact, though that is likely to change if the strike continues.
The U.S. trade deficit in goods and services declined 9.9% to $58.3 billion in August as exports rose and imports fell. Capital goods exports were the highest on record while exports of foods, feeds, and beverages were the lowest since August 2020.
The ISM Services PMI® registered 53.6% in September, indicating continued expansion in the U.S. services sector, though at a slower pace. Except for a contraction in December, services have grown in 39 of the last 40 months. New orders growth decelerated as did growth in employment, inventories, and imports.
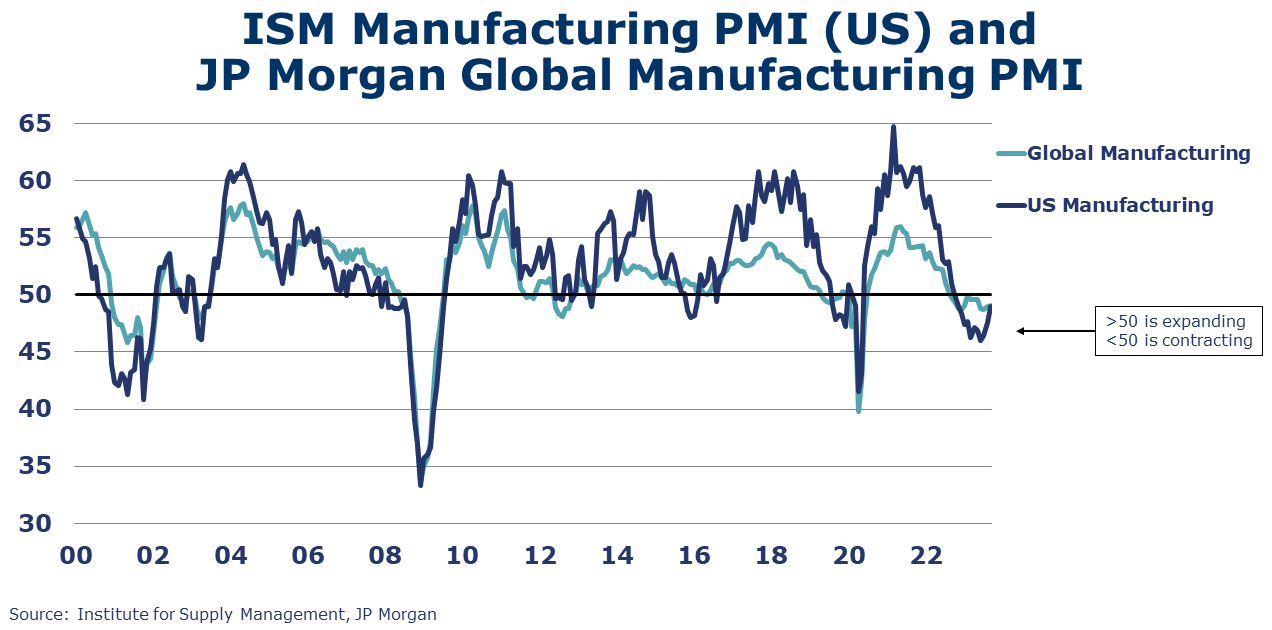
The ISM Manufacturing PMI® rose by 1.4 points to 49.0 in September, below the 50-mark and signaling contraction for an 11th consecutive month. New orders contracted at a slower pace, as did inventories. Supplier deliveries declined and remained in contraction territory. Production rose from neutral into positive territory. Five of the 18 manufacturing industries covered reported growth in September: nonmetallic mineral products; food, beverage, and tobacco products; textile mills; primary metals; and petroleum and coal products.
Led by a large gain in defense capital goods, headline factory orders rebounded by 1.2% in August, following a 2.1% decline in July. There were gains in orders of construction materials, computers, autos, and consumer goods. Core business goods (nondefense capital goods excluding aircraft) rose 0.9% following declines in June and July. Headline orders were up 0.6% Y/Y while core business orders were up 0.5% Y/Y. Unfilled orders (a measure of the manufacturing pipeline) continued to expand, up 0.4%. Manufacturing shipments rose 1.3% in August and inventories were up 0.3%. The inventories-to-shipments ratio edged lower to 1.46 in August. A year ago, it was 1.47.
The JP Morgan Global PMI remained below the 50-mark, rising 0.1 point to 49.1 in September, signaling contraction in global manufacturing activity for the thirteenth month in a row. New orders were weak, and destocking continues. Output declined overall and only rose in 8 of 29 countries tracked. Output rose in the U.S. and in China, while production volumes declined in the euro area, Japan, UK, Canada, and Brazil.
Global semiconductor industry sales were up 1.9% to $44.0 billion in August. Sales were up for the sixth month in a row and are up 1.9% Y/Y (on a 3MMA basis). The gain in August reflected higher sales in the Americas, China, and Other Asia Pacific that offset lower sales in Europe and Japan.
ENERGY
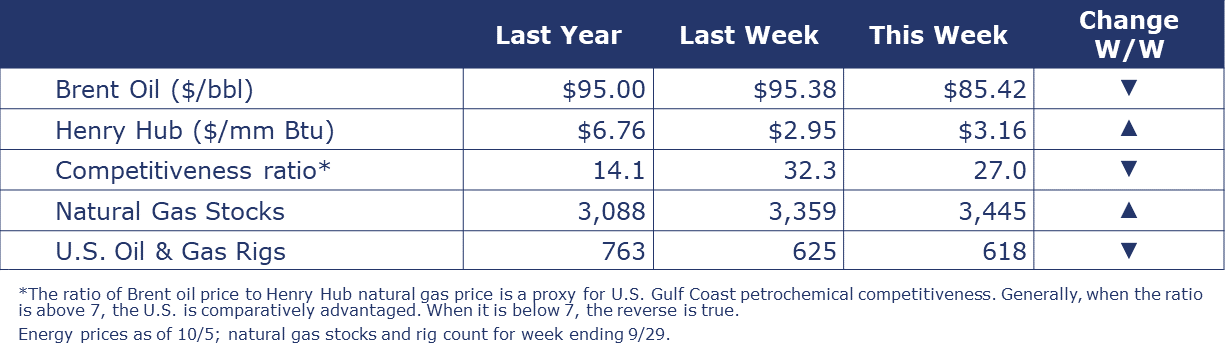
Oil prices fell sharply this week as demand expectations weakened after the 10-year Treasury yield hit a 16-year high. U.S. natural gas futures breached the $3/mmbtu mark, the highest since last winter. Cooler weather is on the horizon and inventories are now only around 5% higher than average (compared to 20-25% higher than average last spring). The combined oil and gas rig count fell by seven to 618 during the week ending September 29th.
CHEMICALS
Indicators for the business of chemistry bring to mind a red banner.

According to data released by the Association of American Railroads, chemical railcar loadings were up to 31,750 for the week ending September 30. Loadings were down 3.7% Y/Y (13-week MA), down (2.6%) YTD/YTD and have been on the rise for 8 of the last 13 weeks.
Details in the ISM Manufacturing PMI® report indicate the chemical industry continued to contract in August with declines in new orders and production. Employment and supplier deliveries increased. Inventories and backlogs remained unchanged.
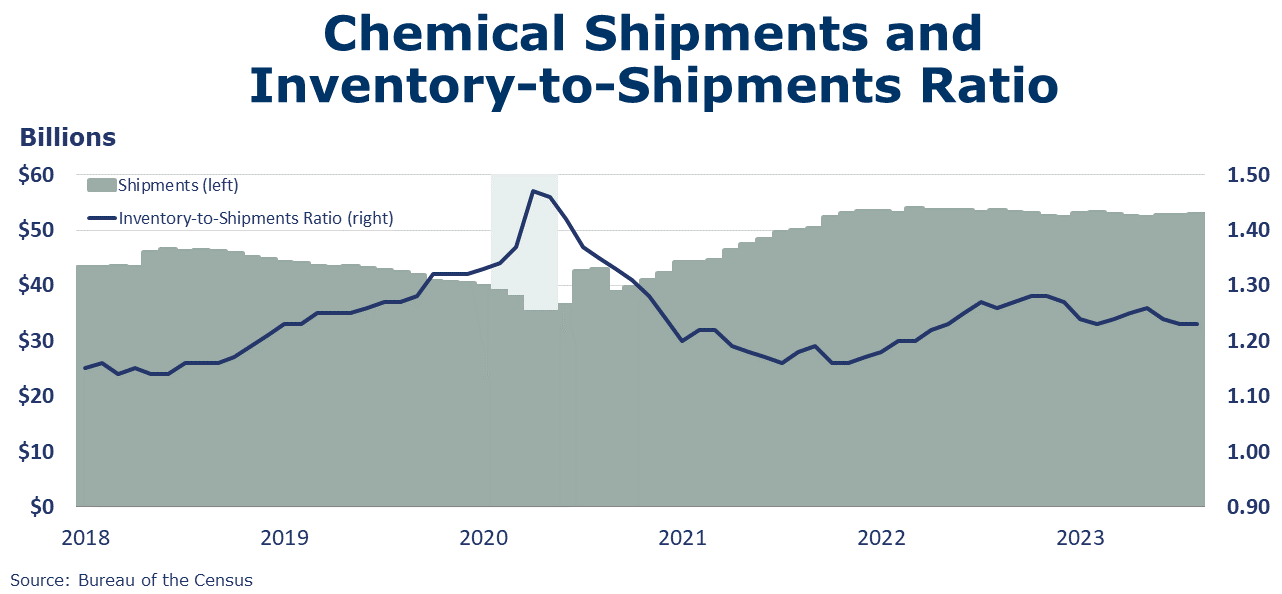
Following flat growth in July, chemical shipments rose 0.3% to $52.8 billion in August. Shipments of coatings & adhesives and all other chemicals offset slightly lower shipments of agricultural chemicals. Inventories of chemicals eased for a third straight month, down 0.1% to $64.9 billion. Gains in the inventories of agricultural chemicals were offset by lower inventories of coatings & adhesive and all other chemicals. Chemical shipments were off 1.3% Y/Y while inventories were down 4.0% Y/Y. The inventories-to-sales ratio was unchanged in August at 1.23, slightly lower the 1.26 last August.
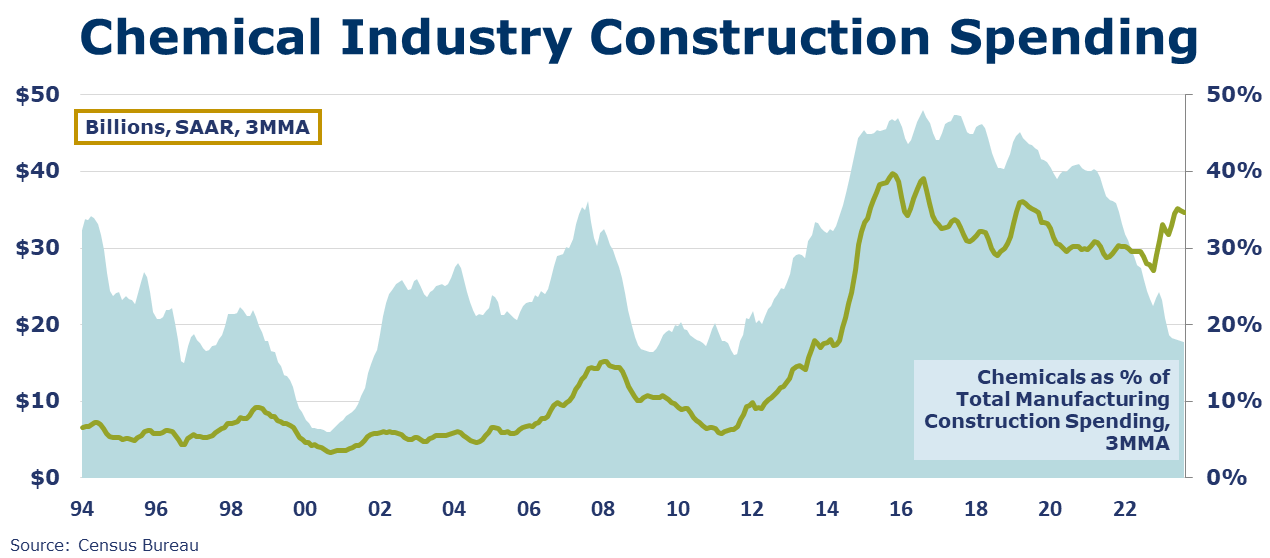
Chemical industry construction spending rose by 1.0% in August to a pace up 28.8% Y/Y. Chemical industry spending represented about 14% of total manufacturing construction spending in August.
Employment in chemical and pharmaceutical manufacturing edged higher in September, up by 0.3% (2,600). The number of production workers edged slightly lower by 100 and the number of supervisory and non-production workers rose by 2,700. Average hourly earnings for production workers rose 9.5% Y/Y to $30.43, outpacing the national average. The average workweek was unchanged. Combined with the slight decline in the number of production workers, the overall labor input into the industry eased slightly. This is consistent with the ISM report that showed the chemical industry contracted in September.
Note On the Color Codes
Banner colors reflect an assessment of the current conditions in the overall economy and the business chemistry of chemistry. For the overall economy we keep a running tab of 20 indicators. The banner color for the macroeconomic section is determined as follows:
Green – 13 or more positives
Yellow – between 8 and 12 positives
Red – 7 or fewer positives
There are fewer indicators available for the chemical industry. Our assessment on banner color largely relies upon how chemical industry production has changed over the most recent three months.
For More Information
ACC members can access additional data, economic analyses, presentations, outlooks, and weekly economic updates through ACCexchange.
In addition to this weekly report, ACC offers numerous other economic data that cover worldwide production, trade, shipments, inventories, price indices, energy, employment, investment, R&D, EH&S, financial performance measures, macroeconomic data, plus much more. To order, visit http://store.americanchemistry.com/.
Every effort has been made in the preparation of this weekly report to provide the best available information and analysis. However, neither the American Chemistry Council, nor any of its employees, agents or other assigns makes any warranty, expressed or implied, or assumes any liability or responsibility for any use, or the results of such use, of any information or data disclosed in this material.
Contact us at ACC_EconomicsDepartment@americanchemistry.com.