March 31, 2023
(press release)
–
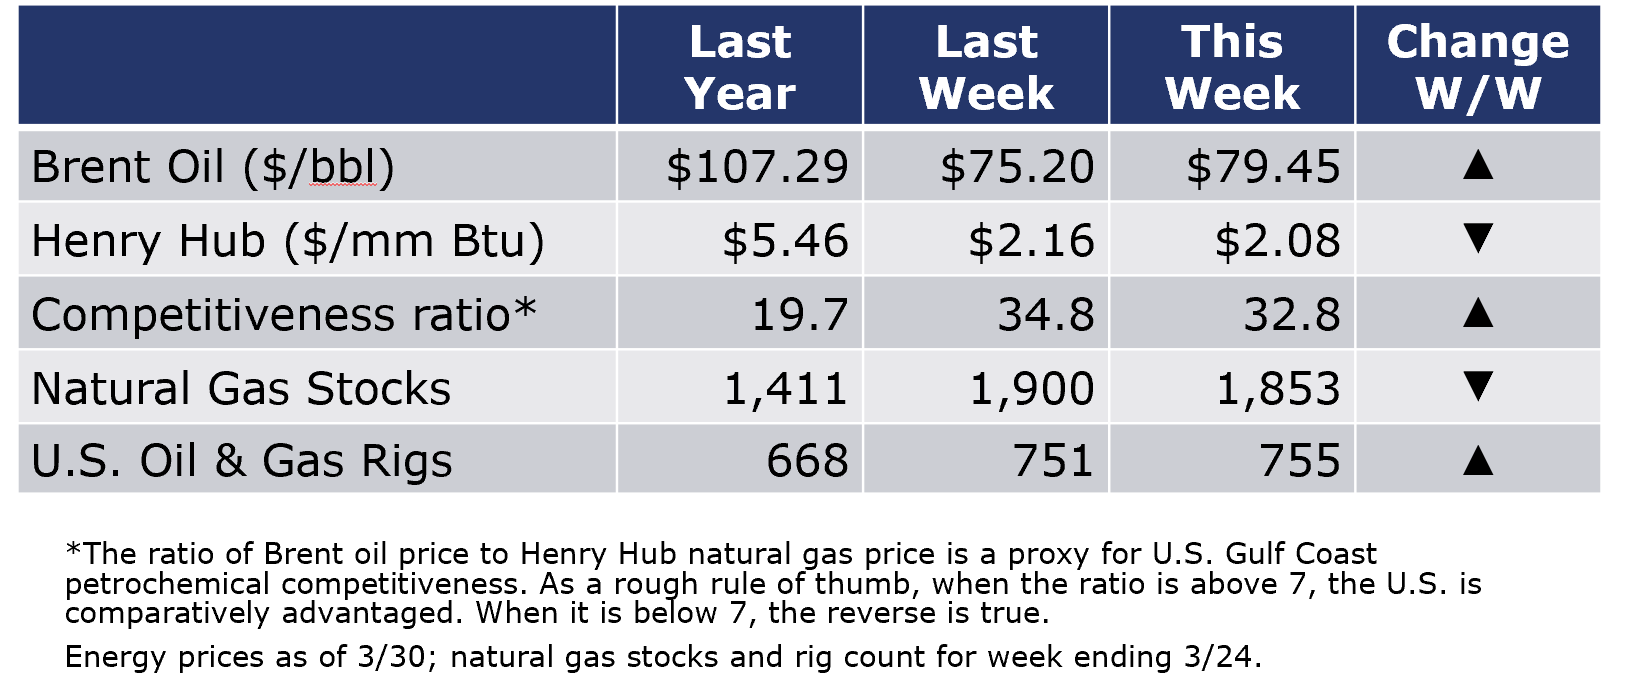
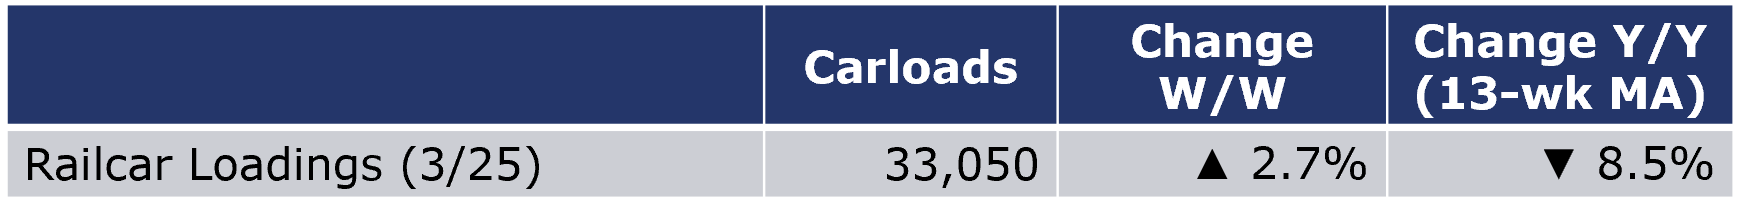
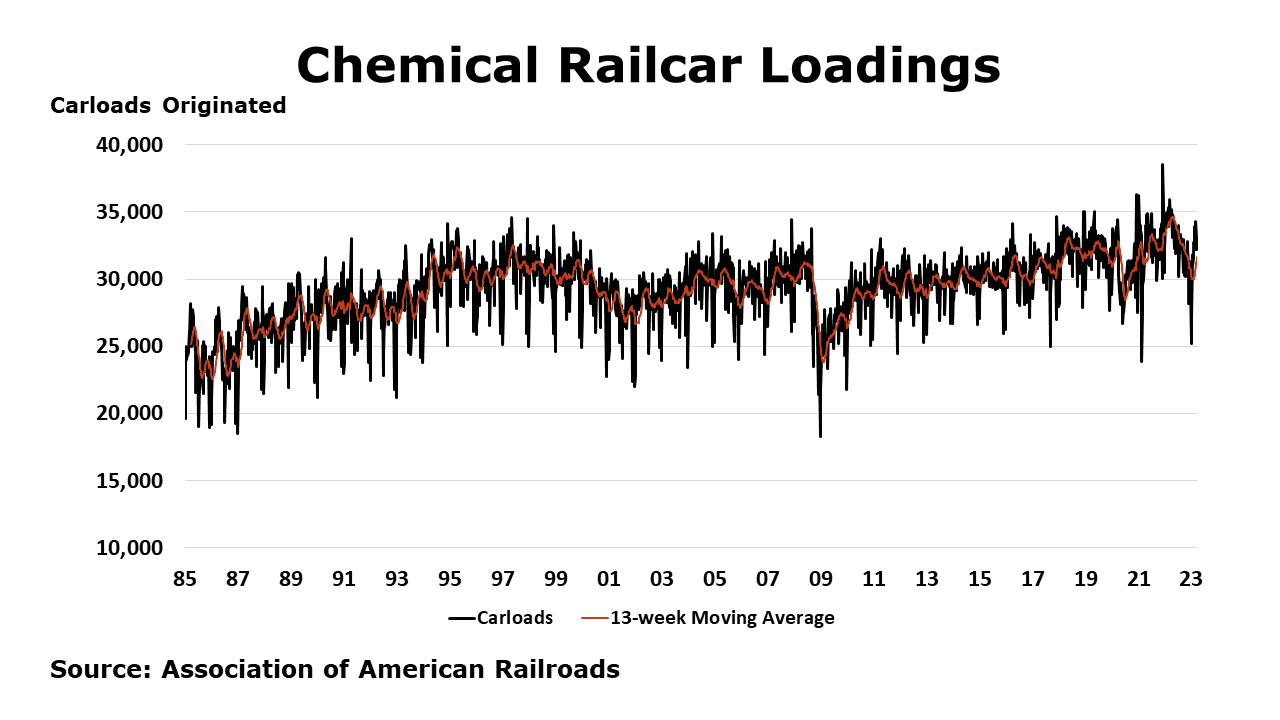
Running tab of macro indicators: 6 out of 20 The number of new jobless claims increased by 7,000 to 198,000 during the week ending 25 March. Continuing claims increased by 4,000 to 1.689 million, and the insured unemployment rate for the week ending March 18 was 1.2%, unchanged from the week prior. Consumer spending rose by 0.2% in February, slightly lower than expected. After adjusting for inflation, real consumer spending edged lower by 0.1%. Spending on durable goods fell but was offset by higher spending on nondurable goods and services. Aggregate personal income rose 0.3%, down from January’s 0.6% gain which reflected the Social Security COLA. The savings rate rose to 4.6%, its highest level in a year as consumers start to hunker down. The price index for personal consumption expenditures (PCE) rose at a slower pace in February, up by 0.3% (compared to a 0.6% gain in January) and up 5.0% compared to last February. Prices for durable goods were lower for the fourth of the past five months, as the composition of consumer spending rotates away from durable goods following the post-lockdown surge in demand. Excluding food and energy, the core PCE price index, a key measure of inflation, also rose by 0.3% during the month and was up 4.6% Y/Y, an improvement. This is the measure the Fed is targeting with its aggressive monetary policy tightening program. Following nine consecutive rate increases, inflation has cooled over the past year, however it remains uncomfortably high. The Fed meets again in early May to consider its next move. An early look into manufacturing activity for March, the Chicago Business Barometer® edged slightly higher (up 0.2 points) to 43.8. Despite the gain, the reading suggests manufacturing activity contracted for a seventh consecutive month. Oil prices moved higher this week as the dollar continued to rise to its highest level in nearly a year. Natural gas futures were slightly higher than a week ago but remain quite low (just over $2/mmbtu) as the winter heating season is winding down with mild temperatures forecast for April. Natural gas inventories continue to be drawn down, though the pace of withdrawals is slowing with the arrival of spring. The combined oil and gas rig count rose by four to 755. For the business of chemistry, the indicators brings to mind a yellow banner for basic and specialty chemicals. According to data released by the Association of American Railroads, chemical railcar loadings were up 2.7% to 33,050 for the week ending 25 March. Loadings were down 8.5% Y/Y (13-week MA), down 6.9% YTD/YTD and have been on the rise for 7 of off the last 13 weeks. The banner colors represent observations about the current conditions in the overall economy and the business chemistry. For the overall economy we keep a running tab of 20 indicators. The banner color for the macroeconomic section is determined as follows: Green – 13 or more positives For the chemical industry there are fewer indicators available. As a result we rely upon judgment whether production in the industry (defined as chemicals excluding pharmaceuticals) has increased or decreased three consecutive months. ACC members can access additional data, economic analyses, presentations, outlooks, and weekly economic updates through MemberExchange. In addition to this weekly report, ACC offers numerous other economic data that cover worldwide production, trade, shipments, inventories, price indices, energy, employment, investment, R&D, EH&S, financial performance measures, macroeconomic data, plus much more. To order, visit http://store.americanchemistry.com/. Every effort has been made in the preparation of this weekly report to provide the best available information and analysis. However, neither the American Chemistry Council, nor any of its employees, agents or other assigns makes any warranty, expressed or implied, or assumes any liability or responsibility for any use, or the results of such use, of any information or data disclosed in this material. Contact us at ACC_EconomicsDepartment@americanchemistry.comMACROECONOMY & END-USE MARKETS
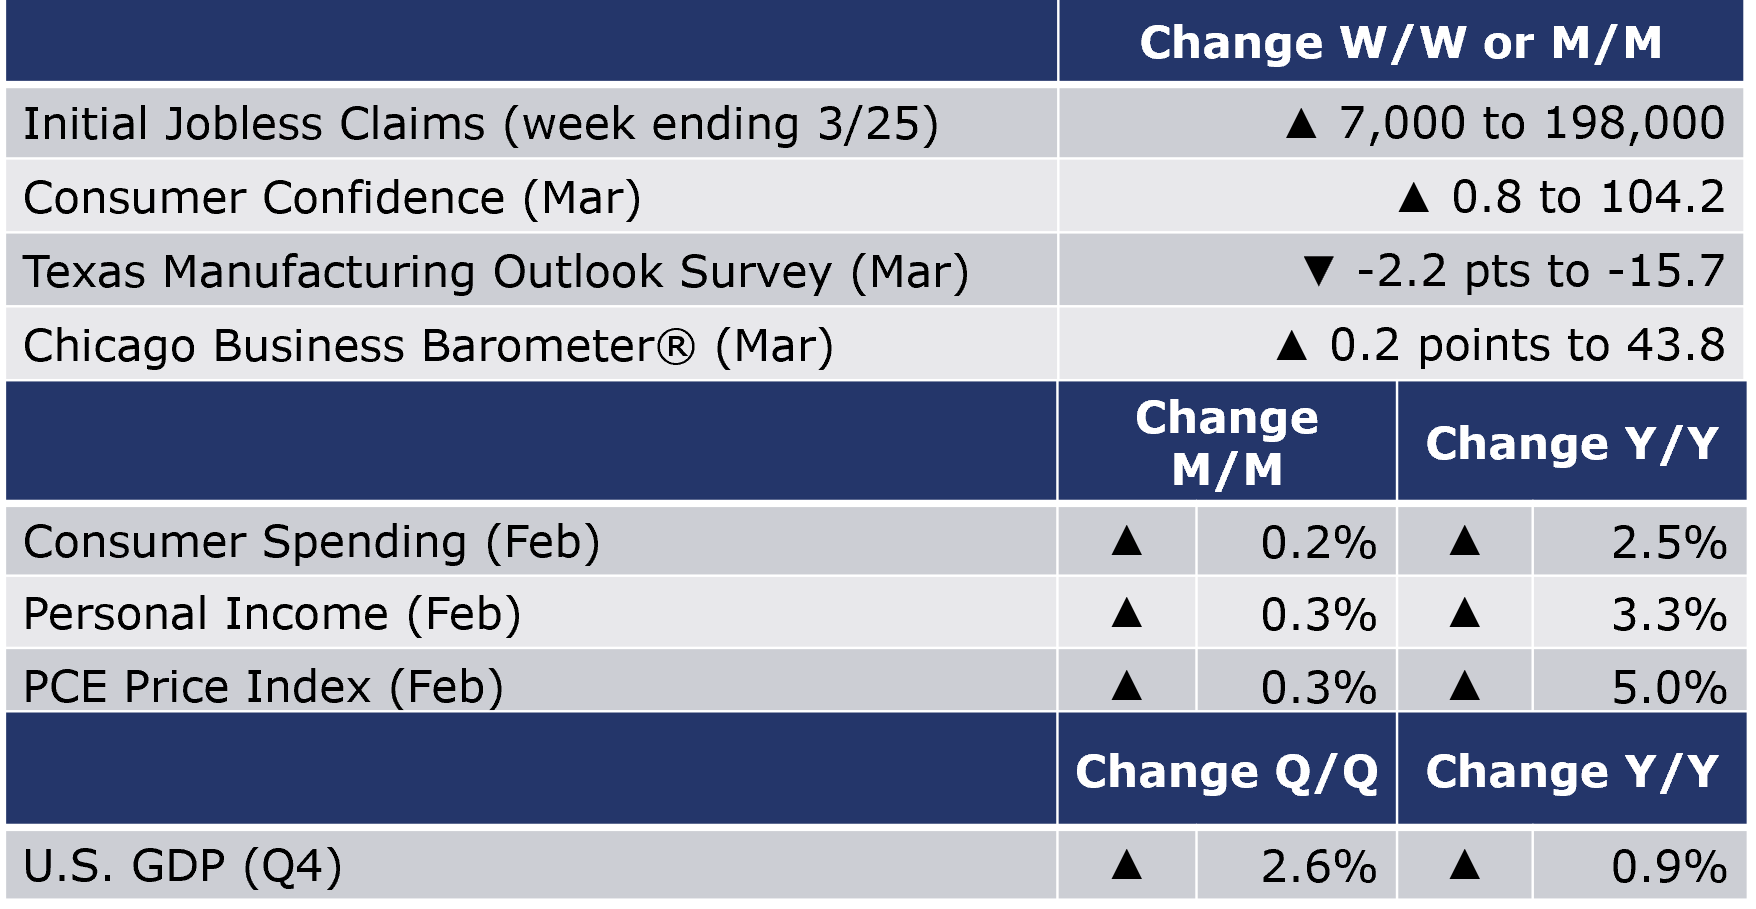
The Conference Board Consumer Confidence Index® increased slightly to 104.2 in March (from 103.4 in February. Consumers’ assessment of present economic and labor market conditions decreased while their expectations for the short-term outlook improved slightly. The expectations index remains below 80, however and has been there for 12 of the last 13 months. An expectations index reading below 80 often signals a recession within the next year. Consumers were less upbeat about business conditions, jobs, and income prospects in the coming six months. When asked about spending on services, consumers indicated they would reduce spending on discretionary items (restaurants, going to the movies) and increase spending on less discretionary items (auto repair, health care, etc.).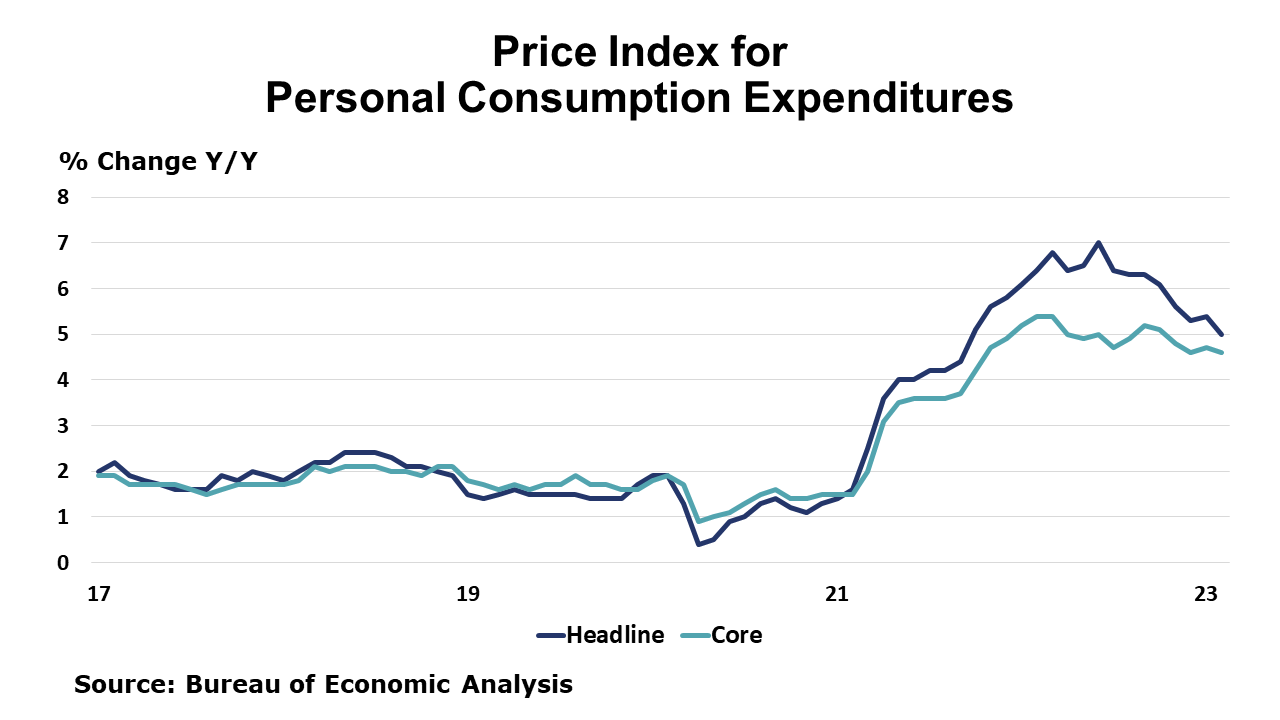
The third and final estimate of Q4 GDP was revised down to 2.6% (SAAR) from the previous estimate of 2.7%. Third quarter GDP was 3.2%. The revision primarily reflected downward revisions in exports and consumer spending. The increase in real GDP primarily reflected increases in private inventory investment, consumer spending, nonresidential fixed investment, federal government spending, and state and local government spending that were partly offset by decreases in residential fixed investment and exports. Imports decreased. US GDP expanded 2.1% in 2022, down from 5.9% in 2021. In summary, revisions to the GDP estimate indicates a slightly deteriorated assessment of the growth in the economy through Q4. The PCE price index increased 3.7%, the same as previously estimated. Excluding food and energy prices, the PCE price index increased 4.4%, an upward revision of 0.1 percentage point.
The Texas Manufacturing Outlook Survey showed that the contraction in general business activity deepened in March. Underlying measures were mixed. The employment index suggests growth and output increased modestly. At the same time, shipments declined and new orders fell for the tenth month in a row. One comment from a plastics and rubber manufacturer: “The supply chain is still a huge concern. Raw materials are steadily increasing in cost and getting harder to locate in some instances.” ENERGY
CHEMICALS
Note On the Color Codes
Yellow – between 8 and 12 positives
Red – 7 or fewer positivesFor More Information
* All content is copyrighted by Industry Intelligence, or the original respective author or source. You may not recirculate, redistrubte or publish the analysis and presentation included in the service without Industry Intelligence's prior written consent. Please review our terms of use.


