MACROECONOMY & END-USE MARKETS
Running tab of macro indicators: 11 out of 20
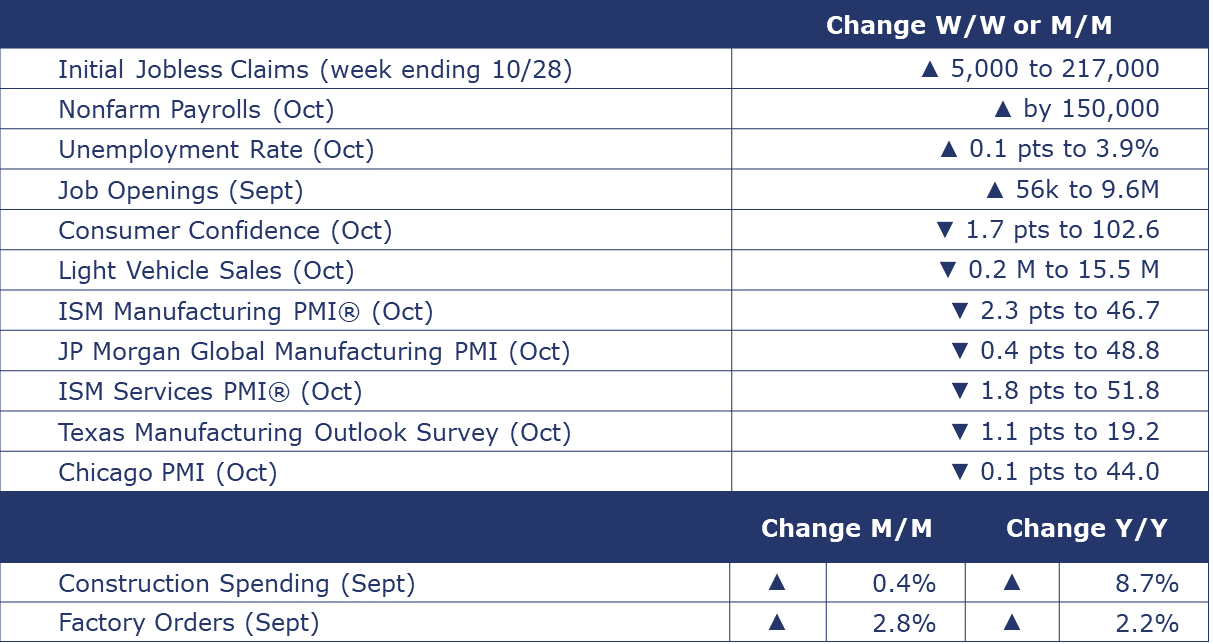
Following an unexpected blowout gain in September, nonfarm payrolls (from the establishment survey) rose by more modest 150,000 in October. It was a bit below expectations and was the slowest gain since June. Manufacturing employment fell by 35,000, but that was largely related to the UAW strike which pulled 33,200 off the rolls of motor vehicle & parts manufacturers. Employment in nondurable manufacturing rose by 1,000. There was weakness in other segments, notably transportation & warehousing, information, financial activities, and other services. Average hourly earnings were up 4.1% Y/Y, down from a 4.3% Y/Y pace in September, and the slowest annual increase since June 2021. Separately, the unemployment rate edged slightly higher to 3.9% as the number of unemployed people rose and the labor force shrank. The participation rate, which had been steadily recovering, retreated in October to 62.7%. The level of employment fell according to the household survey, in contrast to the gain from the establishment survey. During times of transition, directional changes are often inconsistent between the household and establishment surveys. Both indicate the job market is clearly cooling.
The number of job openings rose 56,000 to 9.553 million in September, virtually unchanged from August. There were 1.5 job openings for each unemployed person. Both hires and separations (including quits) were little changed over the month, another sign the labor market may be cooling.
The number of new jobless claims rose by 5,000 to 217,000 during the week ending October 28. Continuing claims increased by 35,000 to 1.82 million, and the insured unemployment rate for the week ending October 21 was unchanged at 1.2%.
The Conference Board’s Consumer Confidence Index® declined for the third straight month, to 102.6 in October from an upwardly revised 104.3 in September. Consumers’ assessment of the present and short-term outlook for economic and labor market conditions declined slightly in October. The Expectations Index fell to 75.6; this is the second month in a row that it has been below 80 - a level which historically signals a recession within the coming year. The decline in consumer confidence was evident across householders aged 35 and up, and not limited to any one income group. Write-in responses showed that consumers continued to be preoccupied with grocery and gasoline prices.
Construction spending rose by 0.4% in September to a pace up 8.7% Y/Y. Private residential spending rose in new single-family and fell in multi-family but levels overall remain down 2.2% Y/Y. Manufacturing spending was down 0.4% in September but still remain strongly up (by 62.5%) on a Y/Y basis.
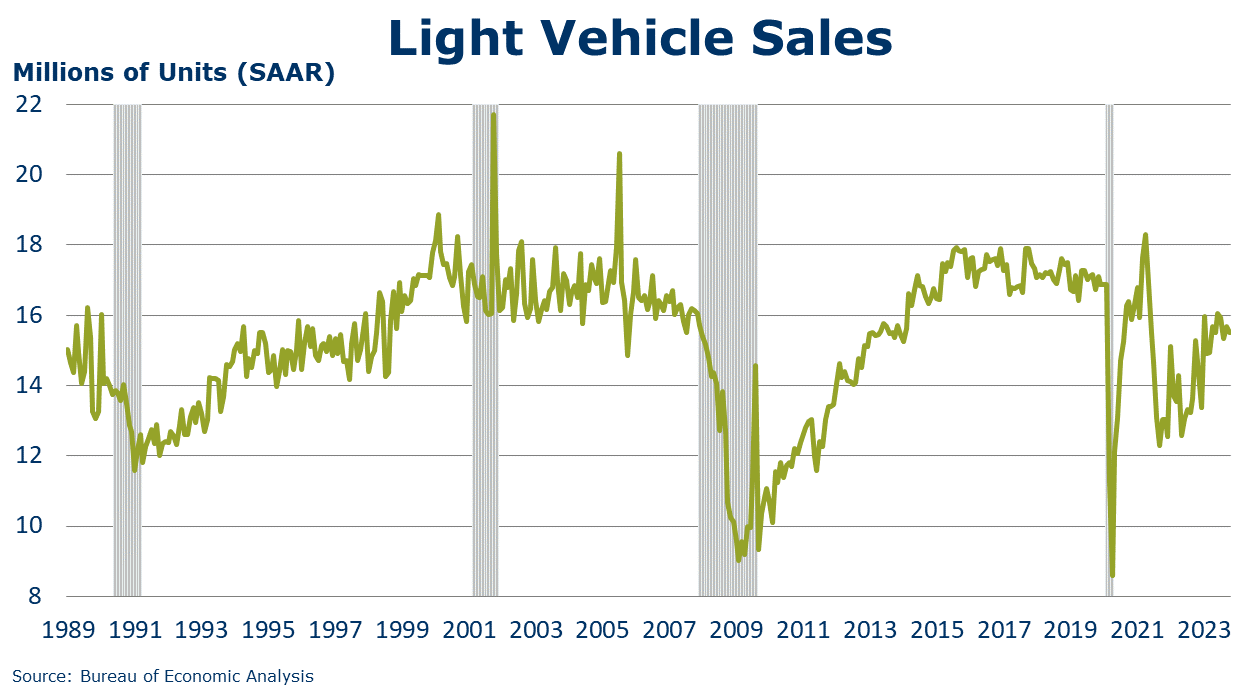
Following a gain in September, light vehicle sales retreated in October, down by 200,000 to a 15.5 million seasonally adjusted annual rate (SAAR). The decline could reflect, in part, the impact of production curtailments from the 6-week UAW strike that impacted production of several popular models.
Following a 1.0% gain in August, factory orders rose by 2.8% in September. The gain reflects a near-doubling of orders for civilian aircraft and smaller gains in electrical equipment, communications equipment, ferrous metal foundries, construction & industrial machinery, and nondurable goods. Core business orders were up by 0.5% following a 0.9% gain in August. Compared to a year ago, headline orders were up 2.2% Y/Y while core business orders were up 0.5% Y/Y. A measure of the manufacturing pipeline, unfilled orders were up 1.4%. Manufacturing shipments were up 0.4% and manufacturing inventories were up 0.2%. The inventories-to-shipments ratio for all manufacturing was stable at 1.46.

After almost reaching the neutral mark in September, the ISM Manufacturing PMI® fell 2.3 points to 46.7 in October. It was the 12th consecutive decline. Thirteen of 18 industries covered reported contraction. Plastic & rubber products was one of two industries that reported growth. Production expanded at a slight faster pace, but new orders, employment, inventories, export orders, and imports contracted. Customer inventories remained “too low.” One respondent in plastic & rubber products noted “Orders continue to increase in some sectors. Construction industry-related products/orders are slowing down.”
For the fourteenth month in a row, the JP Morgan Global Manufacturing PMI® signaled contraction. The index declined 0.4 points to 48.8 in October. Europe has been the main drag on global factory output. Production volumes dipped in Asia (including in China) while the US posted a modest gain. Facing weak demand, manufacturers cut output, jobs, and inventories. Job losses were noted in 21 of 30 countries tracked.
Economic activity in the services sector expanded for the 10th consecutive month in October, and it was the 40th month to reflect growth over the past 41 months, according to the ISM Services PMI®. Twelve of the 17 industries reported growth, with the largest gains in Arts, Entertainment & Recreation, Retail Trade, Other Services, and Construction. Among those reporting a decline were Mining, Wholesale Trade, and Real Estate, Rental & Leasing.
ENERGY

Oil prices were lower compared to a week ago but were trading lower toward the end of the week following announcements by the Fed and BoE to keep interest rates unchanged. U.S. natural gas prices were higher than a week ago despite warmer weather in the immediate forecast and ample inventories going into the traditional heating season. The combined oil and gas rig count rose for a third consecutive week, up by one to 621 during the week ending October 27th.
CHEMICALS
Indicators for the business of chemistry suggest a yellow banner.
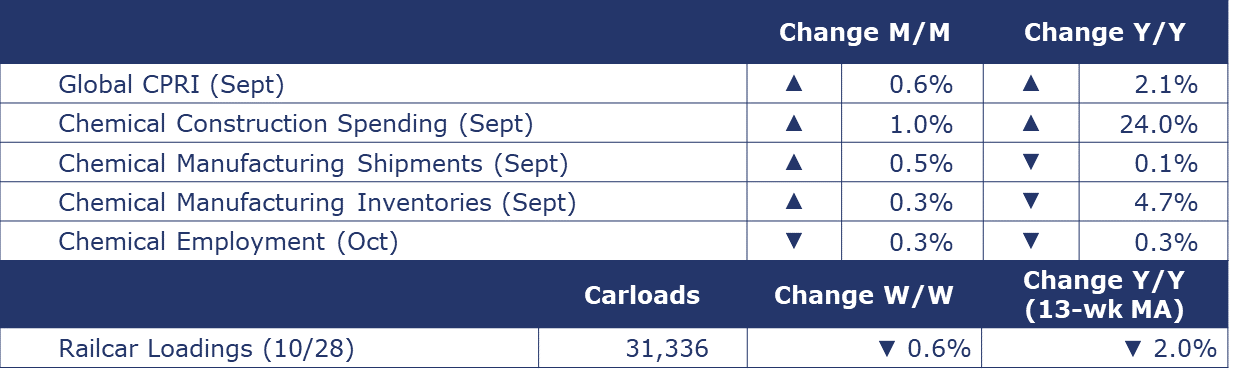
According to data released by the Association of American Railroads, chemical railcar loadings were down to 31,336 for the week ending October 28. Loadings were down 2.0% Y/Y (13-week MA), down (-2.1%) YTD/YTD and have been on the rise for 7 of the last 13 weeks.
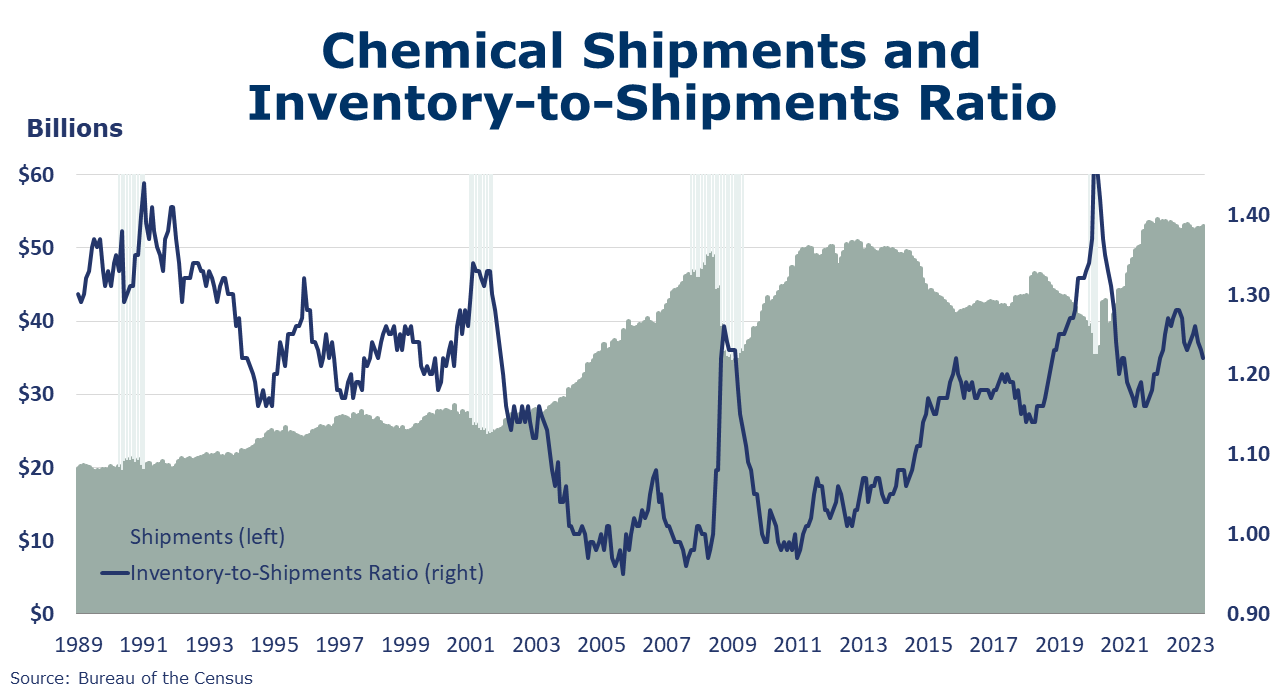
Chemical manufacturing shipments rose 0.5% in September with gains across all major segments. The largest gains were in agricultural chemicals and coatings & adhesives. Shipments of other chemicals rose at a slower pace. Chemical inventories fell for a fourth consecutive month, down another 0.3%. The largest declines were in coatings & adhesives, but other major segments declined, as well. The inventories-to-sales ratio for chemicals continued to move lower down from 1.22 in August to 1.21 in September, the lowest level in a year and a half. Compared to a year ago, shipments were essentially unchanged (off 0.1%) while inventories were 4.7% lower.
Chemical industry construction spending rose by 1.0% in September to a pace up 24.0% Y/Y. Chemical industry spending represented about 18% of total manufacturing construction spending in September.
Within the details of the ISM Manufacturing PMI® report, the chemical industry was one of 13 sectors that contracted in October. Production, employment, inventories, order backlogs, and export orders were lower, while import volumes were higher. One chemical industry respondent noted, “Economy absolutely slowing down. Less optimism regarding the first quarter of 2024.” A panelist from the petroleum products sector noted, “Demand for raw materials/chemicals appears to be stable heading into the fourth quarter.”
Among the comments by chemical manufacturing participants in the Texas Manufacturing Outlook Survey, “With the unrest in the Middle East, there is now additional global uncertainty and about how it will impact the U.S. and overall global economy. There is limited optimism; we will see a very slow recovery in the first quarter depending on the global impacts of additional conflict.”
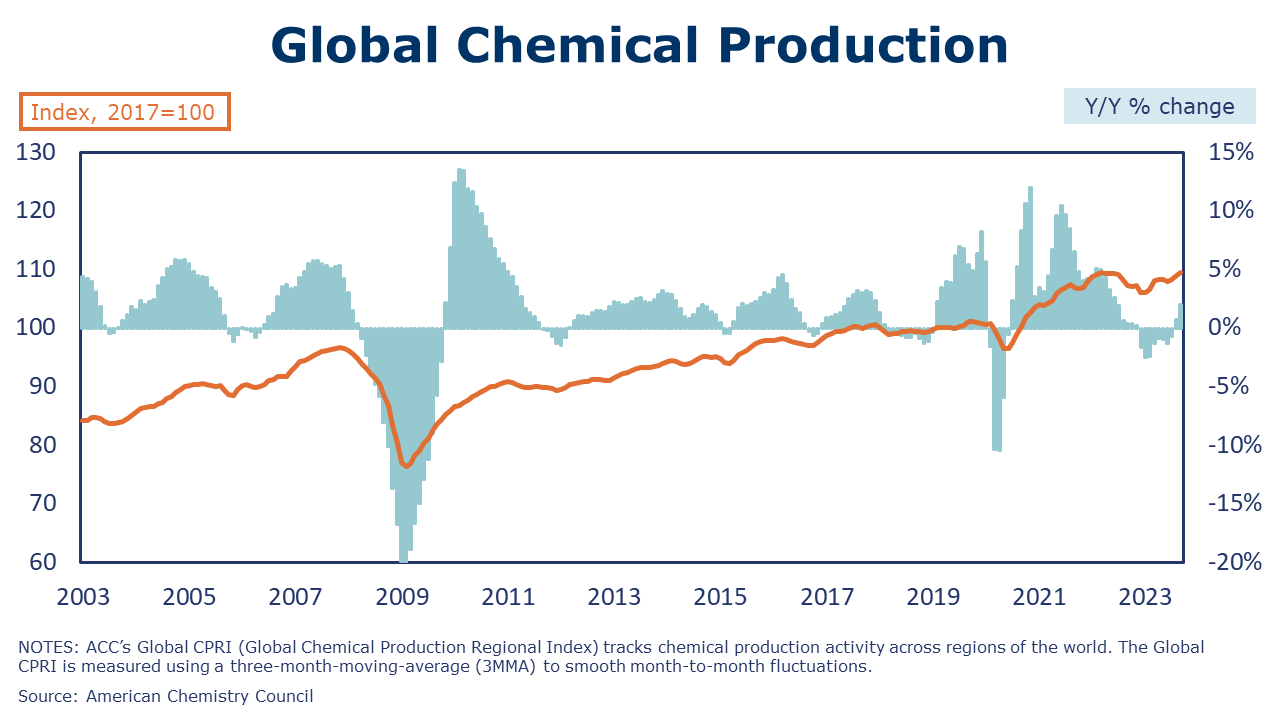
The Global Chemical Production Regional Index (Global CPRI) trended higher by 0.6% in September, following a revised 0.6% gain in August. Production increased in all regions with South America recording the strongest gain. The growth also reflected a recovery in China’s chemical production which appeared to have bottomed out in July despite economic slowdown and housing woes. Japan also showed strength as production had been positive over the last six months.
Chemical and pharmaceutical employment fell by 2,600 (0.3%) in October. Average hourly earnings of non-supervisory and production workers rose at a 7.5% Y/Y pace, the slowest gain since February. Following steady Y/Y gains, October’s employment level was 0.3% below year ago levels. The number of production workers rose, while the number of supervisory and non-production workers fell. The average workweek fell from 41.8 hours per week in September to 41.7 hours in October. The total labor input into the chemical industry fell in October, consistent with the ISM Manufacturing PMI® finding that the industry contracted.
Note On the Color Codes
The banner colors represent observations about the current conditions in the overall economy and the business chemistry. For the overall economy we keep a running tab of 20 indicators. The banner color for the macroeconomic section is determined as follows:
Green – 13 or more positives
Yellow – between 8 and 12 positives
Red – 7 or fewer positives
For the chemical industry there are fewer indicators available. As a result, we rely upon judgment whether production in the industry (defined as chemicals excluding pharmaceuticals) has increased or decreased three consecutive months.
For More Information
ACC members can access additional data, economic analyses, presentations, outlooks, and weekly economic updates through ACCexchange.
In addition to this weekly report, ACC offers numerous other economic data that cover worldwide production, trade, shipments, inventories, price indices, energy, employment, investment, R&D, EH&S, financial performance measures, macroeconomic data, plus much more. To order, visit http://store.americanchemistry.com/.
Every effort has been made in the preparation of this weekly report to provide the best available information and analysis. However, neither the American Chemistry Council, nor any of its employees, agents or other assigns makes any warranty, expressed or implied, or assumes any liability or responsibility for any use, or the results of such use, of any information or data disclosed in this material.
Contact us at ACC_EconomicsDepartment@americanchemistry.com.


