MACROECONOMY & END-USE MARKETS
Running tab of macro indicators: 11 out of 20
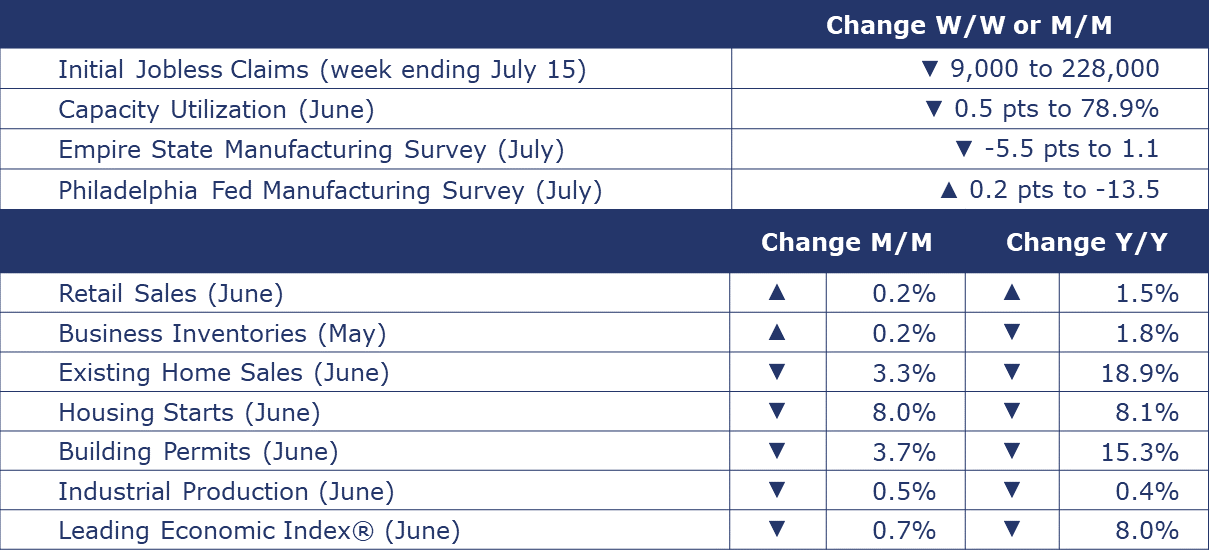
The number of new jobless claims fell by 9,000 to 228,000 during the week ending July 15. Continuing claims increased by 33,000 to 1.754 million, and the insured unemployment rate for the week ending July 8 was unchanged at 1.2%.
Continuing the upward trend in May, nominal retail and food service sales rose by 0.2% in June, though the gain was weaker than expected. Sales were mixed among segments, with higher sales at motor vehicle & parts dealers, furniture & home furnishing stores, electronics & appliances, clothing, miscellaneous, non-store retailers (i.e. online platforms), and restaurants & bars. Offsetting those gains were lower sales at building materials & garden equipment, food & beverage, health & personal care, gasoline, sporting goods, and general merchandise stores. Retail sales were ahead by 1.5% Y/Y, nominally. Factoring in inflation, however, spending was lower than a year ago as consumers have pulled back.
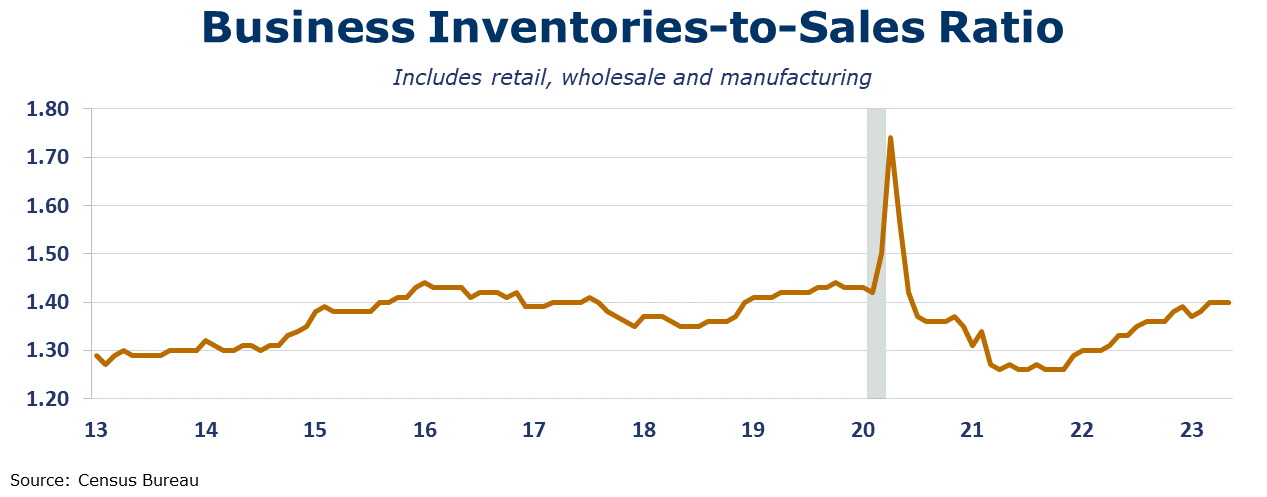
Business inventories were 0.2% higher at the end of May (compared to April) but 1.8% lower than at the end of May 2022. Inventories increased at retailers but were drawn down in wholesalers and manufacturers. Combined business sales were up 0.2% as retail sales increased 0.4%, manufacturer’s sales increased 0.3%, and wholesale sales fell 0.2% in April. Compared to a year earlier, sales were down by 1.8%, with wholesalers leading the decline at -4.0%. The inventories-to-sales ratio was 1.40 in May, unchanged from the April reading. A year ago, the ratio was 1.33.
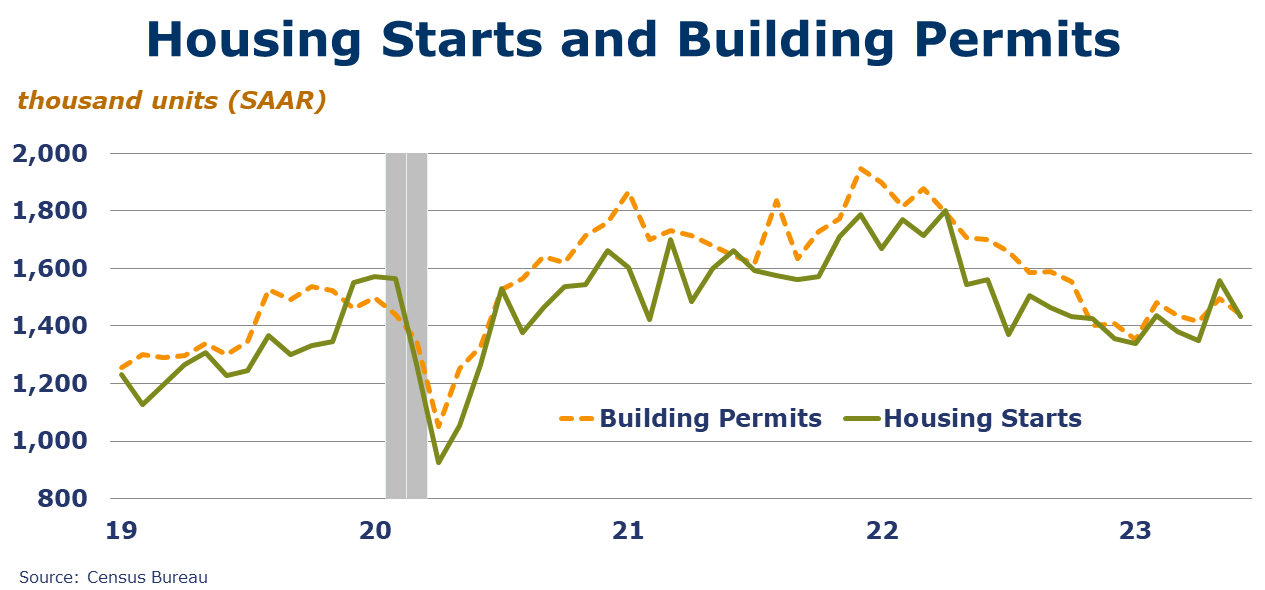
Seasonally adjusted housing starts moved down in June, by 8.0%. Chemistry-intensive single-family starts were down by 7.0% compared to the previous month. Forward-looking building permits were down 3.5% in June, but single‐family authorizations were up by 2.2%. Permits for buildings with five or more units fell by 13.5%. Both starts and permits remained lower than a year ago. According to data from the National Association of Realtors®, existing-home sales fell 3.3% in June to 4.16 million; this is down 18.9% Y/Y. At just over 1 million, inventories of existing homes were unchanged from the previous month (at the lowest level since at least 1999), or the equivalent of 3.1 months' supply at the current monthly sales pace. At $410,200, the median existing-home sales price for June was the second-highest price ever recorded. The highest price of $413,800 was recorded one year ago.
Industrial production fell for a second straight month in June with declines in manufacturing, mining, and utility output. Within manufacturing, results were mixed. The largest gains were in wood products, computers & electronics, and aerospace. The largest declines were in motor vehicles & parts, nonmetallic mineral products, textiles, apparel, printing, and refining. Overall industrial production was off 0.4% Y/Y. Capacity utilization fell by 0.5 points to 78.9%, its lowest level since December 2022 when a freeze event at the end of the month disrupted activity. A year ago, capacity utilization was 80.5%. Over the same time, overall industrial capacity has increased 1.6% Y/Y. Total motor vehicle assemblies eased to 11.0 million (SAAR), lower than April or May, but above the 2019 average of 10.3.
An early look into manufacturing activity in July, two of the regional Fed manufacturing surveys indicated mixed results for the Northeast. Manufacturing activity held steady in New York State as new orders inched up and shipments expanded. Delivery times shortened and inventories declined. Employment rose. Optimism about future business conditions edged lower but was still in positive territory. In the Philadelphia region, manufacturing activity declined and new orders remained negative. Shipments declined, falling into negative territory. Employment remained steady. Outlook for the next six months improved.
The Conference Board’s Leading Economic Index®, a reliable recession indicator, declined for a 15th consecutive month in June, down by 0.7%. The June reading reflects further deterioration in the gauges of consumer expectations, ISM new orders index, a negative yield spread and worsening credit conditions. The trend in the index continues to point to weaker economic activity ahead. The Conference Board expects the U.S. economy will contract over the Q3 2023 to Q1 2024 time frame.
ACC Survey of Economic Forecasters
Each month, ACC’s Economics & Data Analytics Department collects forecasts from economic professionals who have a track record for accuracy and expert knowledge of manufacturing. The following are some of the most recent results.
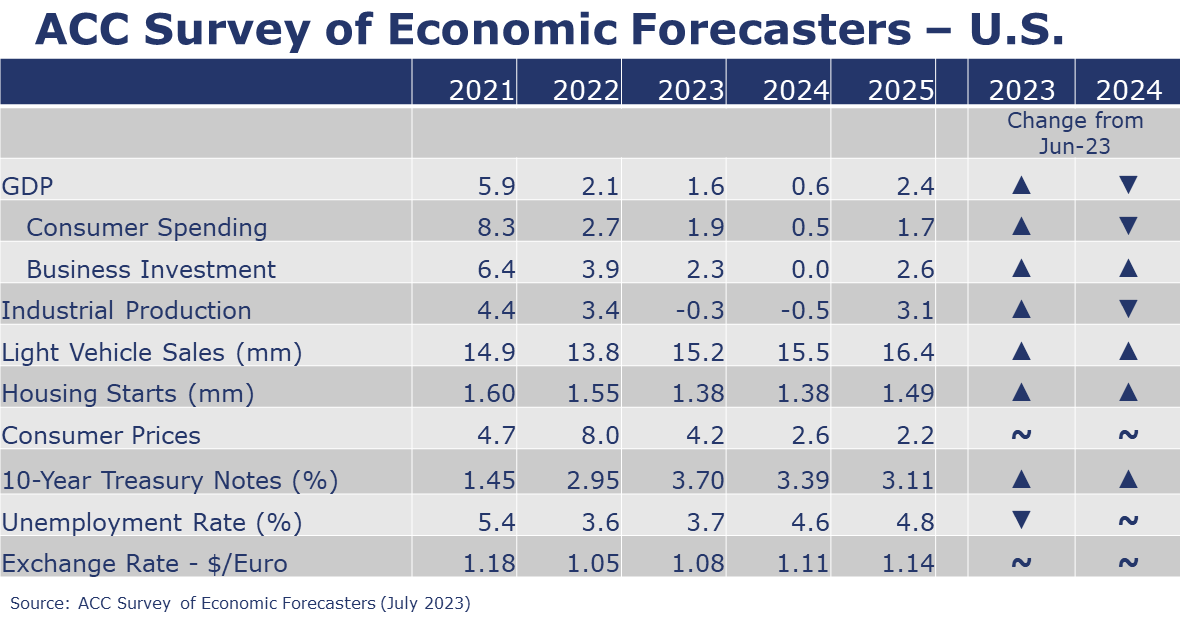
Survey of Economic Forecasters – U.S.
- Moving into Q3, the headline economic indicators continue to be mixed with further deterioration in manufacturing offset by resilient, though softer, consumer spending. We continue to expect a short, shallow recession in the U.S. economy, emerging in the second half of the year, later than we initially anticipated. As a result, we have raised our 2023 forecast and downgraded 2024.
- U.S. GDP is expected to grow by 1.6% in 2023 and to weaken (+0.6%) in 2024.
- Consumer spending growth is expected to slow to a 1.9% Y/Y pace in 2023 (from 2.7% in 2022) and slow further to a 0.5% gain in 2024.
- Dampened by higher borrowing costs, growth in business investment is also expected to decelerate to a 2.3% pace in 2023 before stalling in 2024.
- Industrial production is expected to contract by 0.3% in 2023 and ease a further 0.5% in 2024.
- Despite higher borrowing costs, vehicle production continues to be a relatively bright spot in an otherwise lackluster outlook. As a result, sales of autos and light trucks are expected to grow to 15.2 million in 2023 (still below trend) and 15.5 million in 2024.
- While it has struggled with high prices and mortgage rates, homebuilding may be finding a bottom, supported by extremely low inventories of existing homes. Housing starts are expected to come in at 1.38 million in both 2023 and 2024.
- The unemployment rate is expected to move higher from 50-year lows to average 3.7% in 2023 and 4.6% in 2024.
- Higher interest rates are starting to curb inflation. Growth in consumer prices is expected to decelerate to a 4.2% pace in 2023 and 2.6% in 2024 (down from 8.0% in 2022).
- Expectations for interest rates (10-year Treasury) were slightly higher for 2023 and 2024.
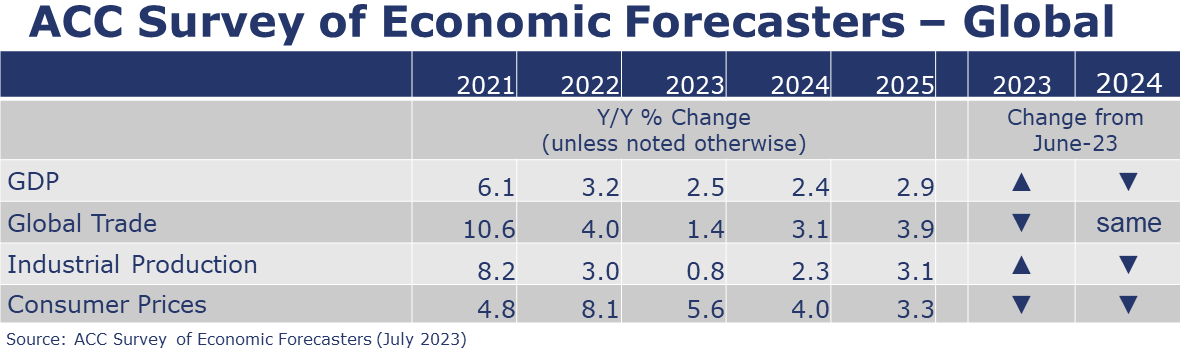
Survey of Economic Forecasters – Global
- Economic activity is forecast to weaken towards the end of this year which is later than expected previously. Delayed moderation means stronger figures for 2023 offset by softer estimates for 2024. Global growth this year will hit a 2.5% pace (an upward revision) and moderate to a 2.4% pace in 2024.
- While there has been notable progress in pulling down inflation, it persists and is sticky in key areas. Tough to tame inflation could push monetary policy rate peaks out and up. Continued central bank policy tightening is a possibility given the resilience in economic activity and persistence in inflationary pressures across many of the world’s economies. It will take time to get back down near central bank targets. Inflation is moving in the “right” direction and estimates are downwardly revised to 5.6% in 2023 and 4.0% in 2024.
- With weakening economic growth this year and a continued shift away from spending on goods, global industrial production growth will slow to 0.7% and trade volumes growth will ease to a 1.4% pace in 2023. In 2024, we expect production and trade volumes to grow by 2.3% and 3.1%, respectively.
ACC members can download the data spreadsheet and slide deck summary on ACCExchange, ACC’s members-only platform.
ENERGY
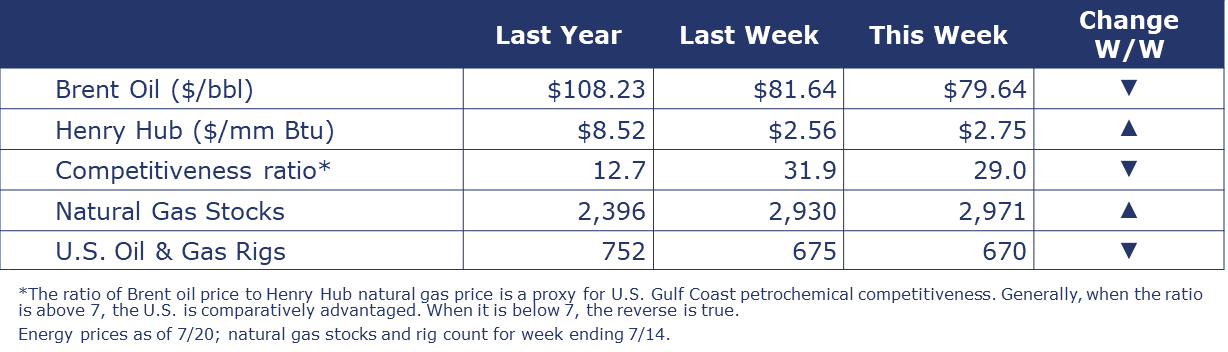
Despite higher consumption in U.S. and an announcement that China would provide support to boost growth in the world’s largest oil-importing country, oil prices were slightly lower than a week ago. U.S. natural gas prices were up from a week ago but remain relatively low despite higher power burn to keep homes and buildings cool amid the extreme heat. Following a gain the previous week, the combined oil and gas rig count resumed its descent, falling by five to 670.
CHEMICALS
Indicators for the business of chemistry bring to mind a red banner.
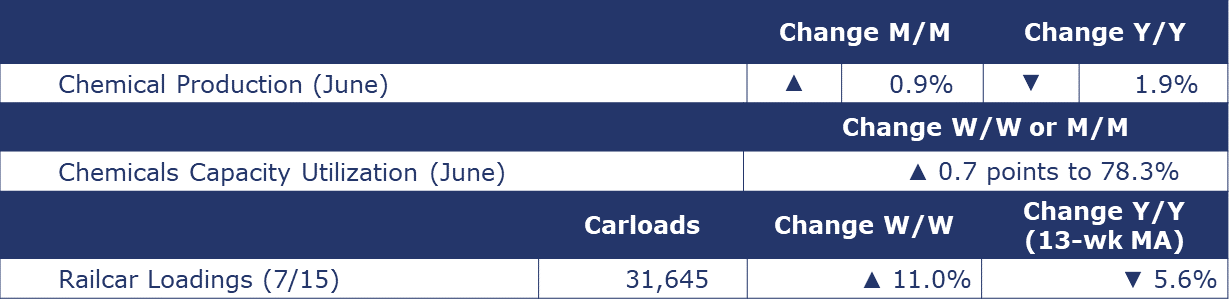
According to data released by the Association of American Railroads, chemical railcar loadings were up 11.0% to 31,645 for the week ending July 15. Loadings were down 5.6% Y/Y (13-week MA), down (4.2%) YTD/YTD and have been on the rise for 8 of the last 13 weeks.
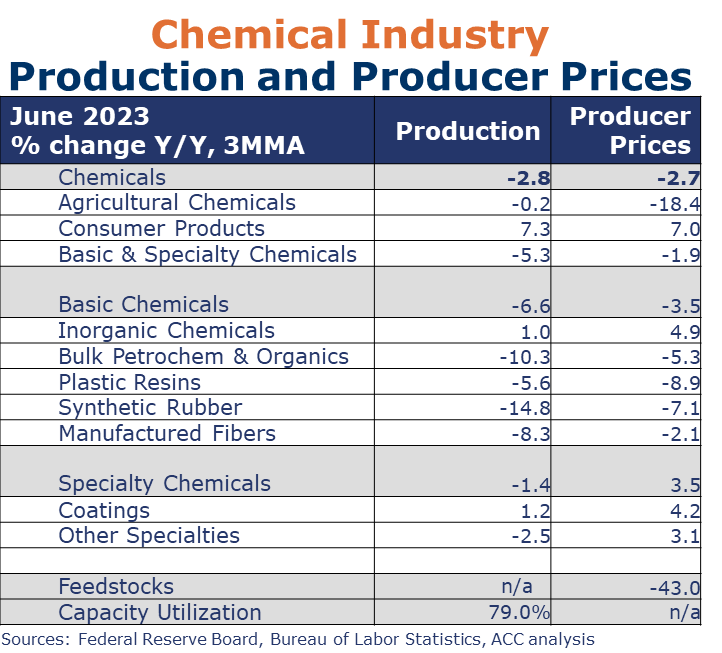
Following three straight months of declines, chemical production rose by 0.9% in June. There were gains in the production of plastic resins, coatings & other specialty chemicals, agricultural chemicals and consumer products. Those gains were partially offset by lower production of organic chemicals and a small decline in basic inorganic chemicals production. Despite the sequential gain, chemical production remained lower than a year ago, off by 1.9% Y/Y. Chemical capacity utilization rose to 78.3% in June. A year ago, capacity utilization was 81.0%.
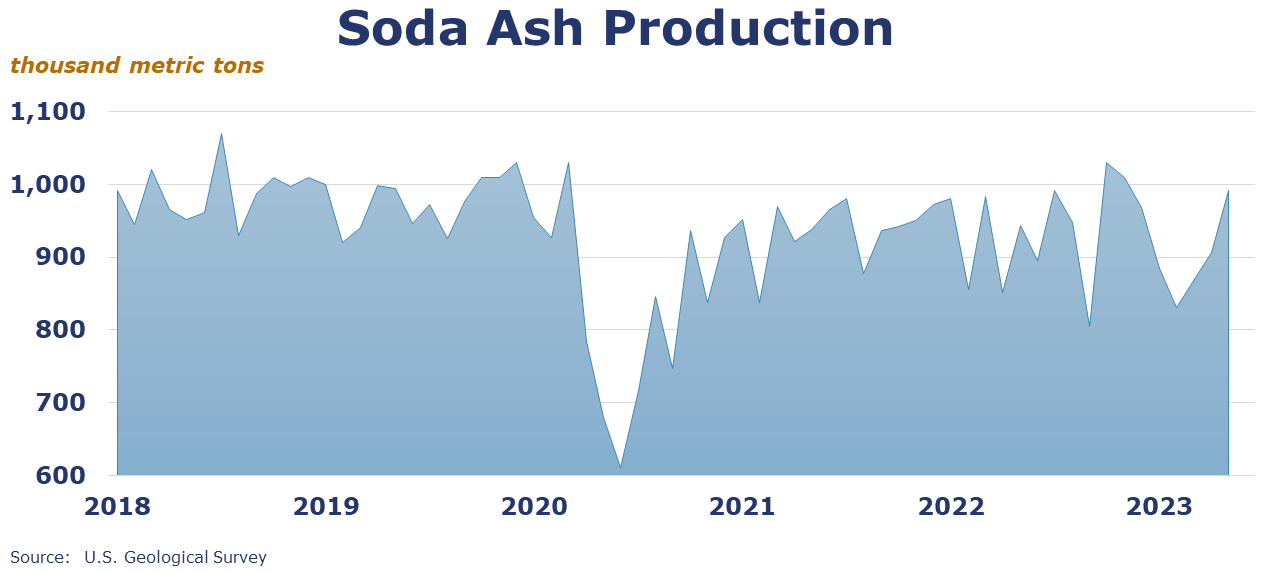
The U.S. Geological Survey reported that monthly production of soda ash in May was 991 thousand tons, up 9.4% compared to the previous month and up 5.0% Y/Y. Stocks rose 18.8% over April to 297 thousand tons at the end of the month, a 9-day supply. Ending stocks were up 14.2% Y/Y.
Note On the Color Codes
The banner colors represent observations about the current conditions in the overall economy and the business chemistry. For the overall economy we keep a running tab of 20 indicators. The banner color for the macroeconomic section is determined as follows:
Green – 13 or more positives
Yellow – between 8 and 12 positives
Red – 7 or fewer positives
For the chemical industry there are fewer indicators available. As a result, we rely upon judgment whether production in the industry (defined as chemicals excluding pharmaceuticals) has increased or decreased three consecutive months.
For More Information
ACC members can access additional data, economic analyses, presentations, outlooks, and weekly economic updates through ACCexchange.
In addition to this weekly report, ACC offers numerous other economic data that cover worldwide production, trade, shipments, inventories, price indices, energy, employment, investment, R&D, EH&S, financial performance measures, macroeconomic data, plus much more. To order, visit http://store.americanchemistry.com/.
Every effort has been made in the preparation of this weekly report to provide the best available information and analysis. However, neither the American Chemistry Council, nor any of its employees, agents or other assigns makes any warranty, expressed or implied, or assumes any liability or responsibility for any use, or the results of such use, of any information or data disclosed in this material.
Contact us at ACC_EconomicsDepartment@americanchemistry.com.