MACROECONOMY & END-USE MARKETS
Running tab of macro indicators: 7 out of 20
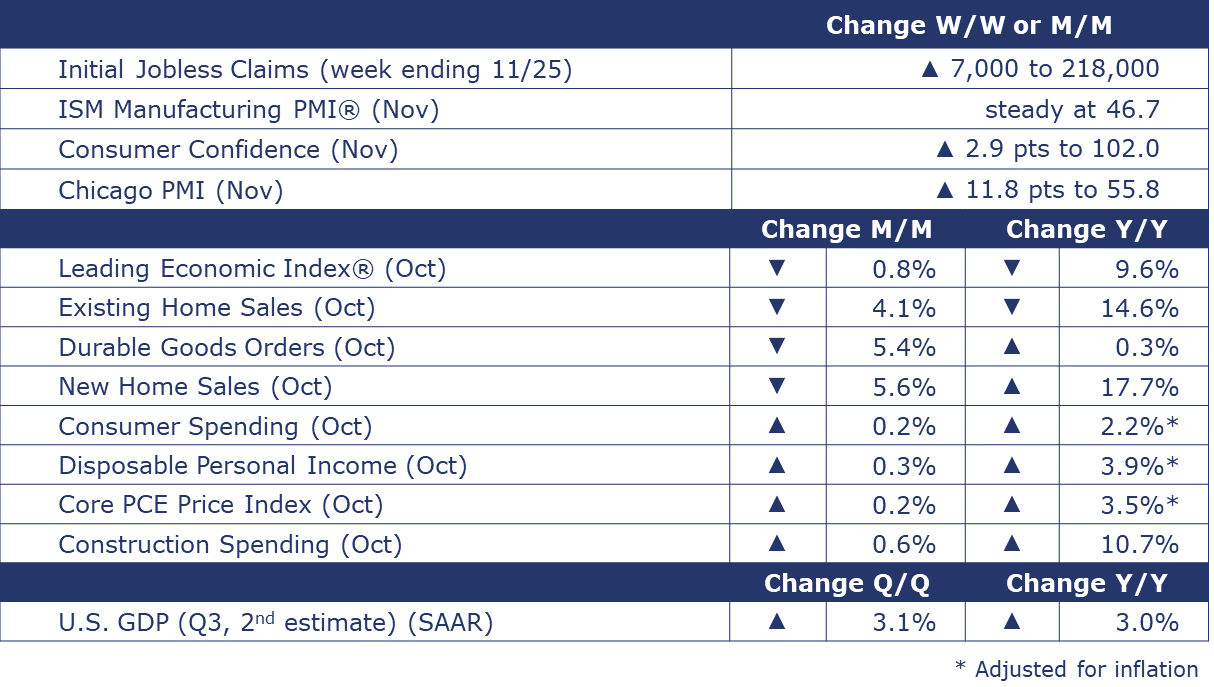
The number of new jobless claims rose by 7,000 to 218,000 during the week ending November 25. Continuing claims increased by 77,704 to 1.681 million, and the insured unemployment rate for the week ending November 18 was down 0.1 point to 1.0%.
The Conference Board’s Leading Economic Index® (LEI) fell 0.8% in October and continued to signal a near-term contraction in the U.S. economy for a nineteenth consecutive month. Deteriorating consumers’ expectations for business conditions, lower ISM® manufacturing PMI for new orders, falling equities, and tighter credit conditions drove the index’s most recent decline. While the pace of declines has eased, the resilient U.S. economy has been at odds with consistent negative readings with the LEI for the past year and a half.
The Conference Board’s gauge on consumer confidence rose 2.9 points to 102.0 in November following three straight months of decline. Consumer assessment of present conditions for business and the labor market weakened while their short-term outlook expectations index improved. The short-term outlook reading remains at a level signaling a recession within the next 12 months.
In its second estimate, BEA reported U.S. GDP grew by a 5.2% seasonally adjusted annual rate during Q3. The increase in Q3 primarily reflects gains in consumer spending, housing, business investment, inventory investment, exports, and federal defense spending that were partly offset by imports which increased and are a subtraction in the calculation of GDP.
As anticipated, consumer spending, or personal consumption expenditures (PCE), slowed in October, down to a 0.2% M/M pace. Continued gains in spending on services offset a decline in durable goods spending. Spending on non-durable goods was flat. Personal income growth also slowed, down to a 0.2% M/M pace. The savings rate edged slightly higher to 3.8% but has come down from above 5% earlier in the year. The PCE price index was up 3.0% Y/Y and the closely watched core PCE price index (which strips out food and energy) rose 3.5% Y/Y, the slowest annual gain in two and a half years, but still too high for the Fed’s 2% target.
Construction spending rose by 0.6% in October to a pace up by 10.7% Y/Y. Private residential spending rose 0.7% M/M and 9.2% Y/Y thanks to gains in single-family constructions offsetting the decline in the multi-family segment. Manufacturing spending was up 0.9% in October and is up by 71.6% Y/Y.
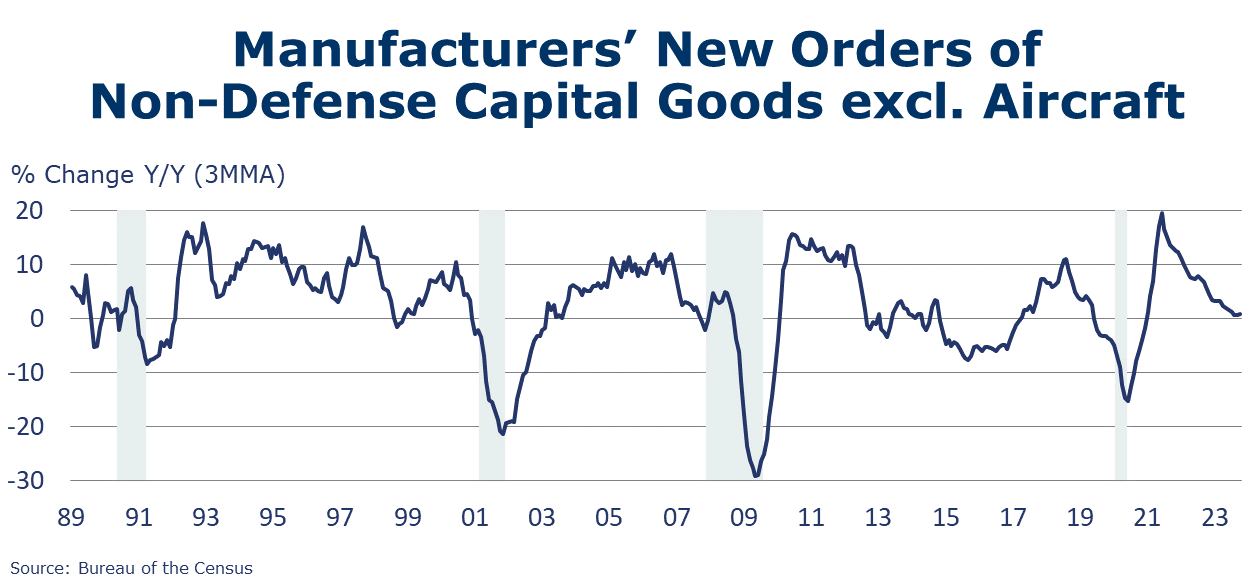
Durable orders dropped 5.4% in October to a level up 0.3% Y/Y. Core business orders (nondefense capital goods excluding aircraft) were about flat (down 0.1%) and were up 0.8% on a Y/Y 3MMA basis. The Y/Y 3MMA comparisons have shown persistent deceleration since the mid-2021 peak, falling from nearly 20% monthly growth rates to less than 1% recently. New orders for motor vehicles and parts were down 3.8% in October but orders were up 5.7% YTD/YTD.
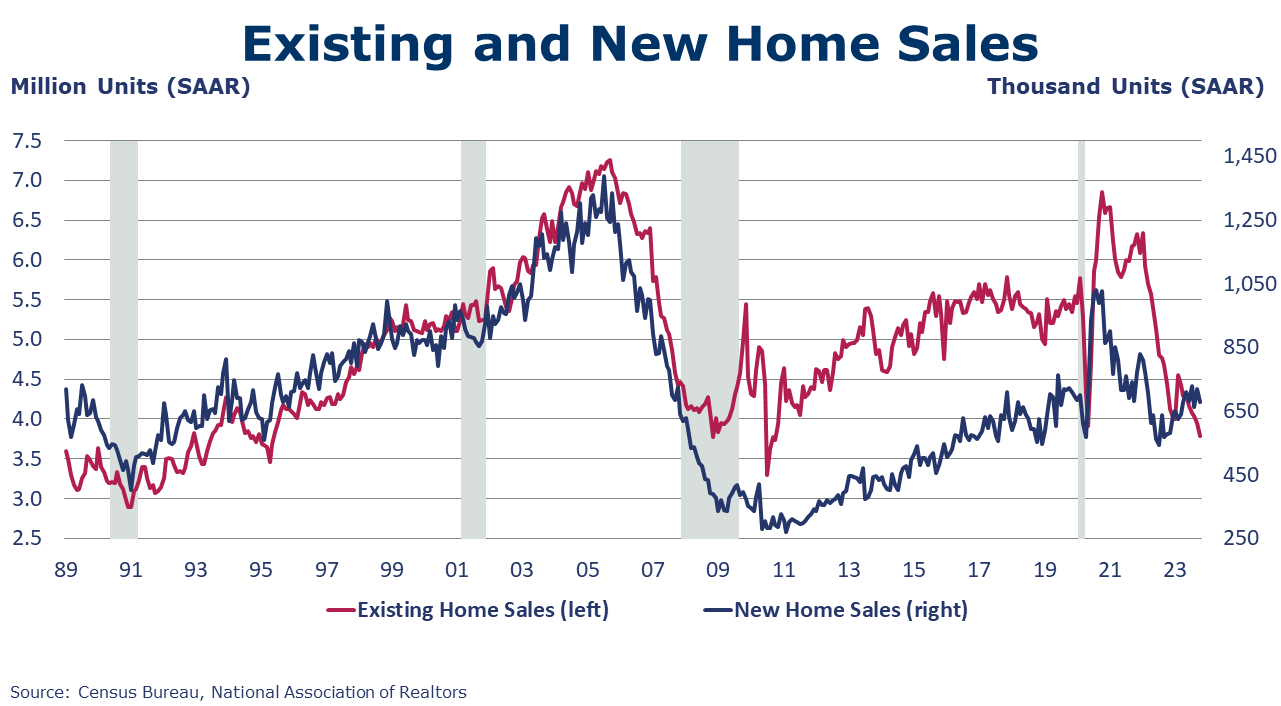
The National Association of REALTORS® (NAR) reported existing home sales fell 4.1% in October to a SAAR of 3.79 million, a level down 14.6% Y/Y. Inventories rose 1.8% resulting in a 3.6-month supply. The median home sale price was up 3.4% Y/Y. Separately, the Census Bureau reported new home sales fell 5.9% in October to a SAAR of 679,000 (a level up 17.7% Y/Y). New home sales fell in the West and Midwest and rose in the Northeast and South. The inventory of new homes for sale at the end of October rose, pushing up the months’ supply ratio to 7.8 (much lower than a year earlier when the months’ supply was 9.7).
The ISM Manufacturing PMI® held steady at 46.7% in November. It was the 13th consecutive reading under the 50-mark, which indicates contraction in the U.S. industrial sector. Manufacturers are facing easing demand as new orders contract in the U.S. and for exports and customer inventories are “about right”. Just 3 of 17 manufacturing industries tracked reported growth in November.
Fed Beige Book
A compilation of anecdotal information on the regional economies in the 12 districts, the Beige Book is published eight times per year. Interesting excerpts follow here:
- On balance, economic activity slowed since the previous report, with four Districts reporting modest growth, two indicating conditions were flat to slightly down, and six noting slight declines in activity.
- Retail sales, including autos, remained mixed; sales of discretionary items and durable goods, like furniture and appliances, declined, on average, as consumers showed more price sensitivity.
- Travel and tourism activity was generally healthy.
- Demand for transportation services was sluggish.
- Manufacturing activity was mixed, and manufacturers' outlooks weakened.
- Demand for business loans decreased slightly, particularly real estate loans.
- Consumer credit remained fairly healthy, but some banks noted a slight uptick in consumer delinquencies.
- Agriculture conditions were steady to slightly up as farmers reported higher selling prices; yields were mixed.
- Commercial real estate activity continued to slow; the office segment remained weak and multifamily activity softened.
- Several Districts noted a slight decrease in residential sales and higher inventories of available homes.
- The economic outlook for the next six to twelve months diminished over the reporting period.
ENERGY
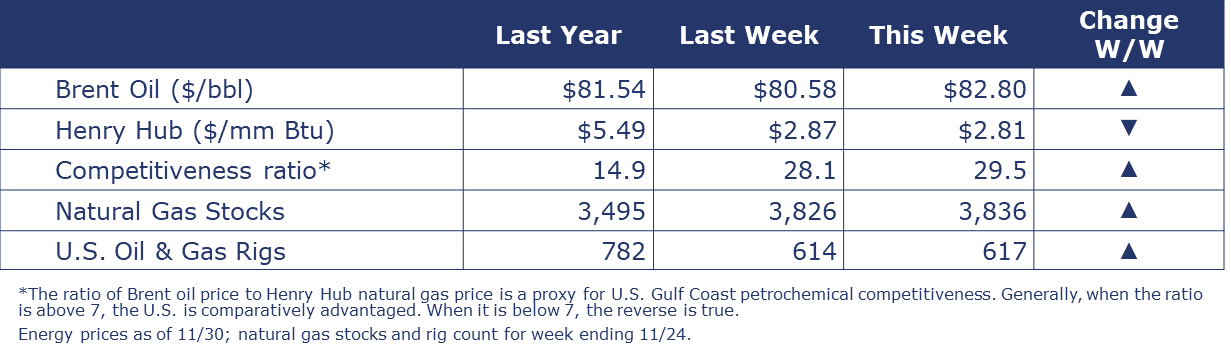
Oil prices moved higher this week in anticipation that more production cuts will be announced at the OPEC+ meeting. U.S. natural gas prices were relatively stable this week and the winter heating season is kicking off with ample inventories (nearly 10% above average). The combined oil and gas rig count rose by three to 617 for the week ending 24 November.
CHEMICALS
Indicators for the business of chemistry bring to mind a red banner.
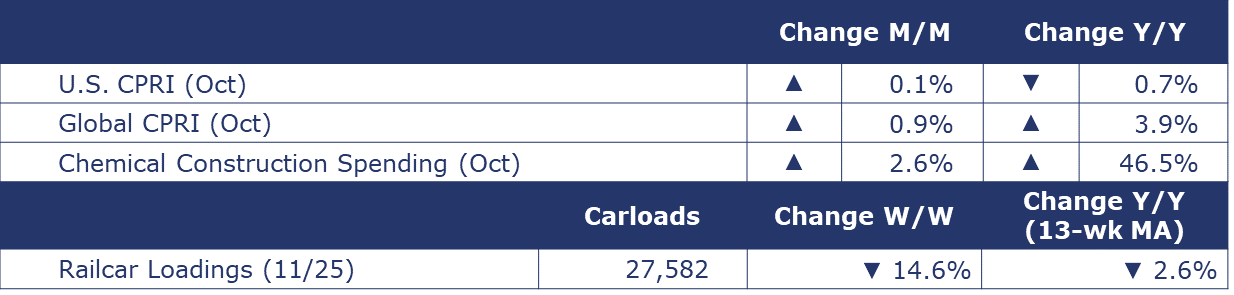
According to data released by the Association of American Railroads, chemical railcar loadings were down to 27,582 for the week ending November 25th which included the Thanksgiving holiday. Loadings were down 2.6% Y/Y (13-week MA), down (1.8%) YTD/YTD and have been on the rise for 8 of the last 13 weeks.
Chemical industry construction spending rose by 2.6% in October to a pace up 46.5% Y/Y. Chemical industry spending represented about 18% of total manufacturing construction spending in October.
In the ISM Manufacturing PMI® report for November, most manufacturing industries (including chemicals) reported contraction. One chemical industry respondent commented, “Starting to feel softening in the economy, with labor still a challenge to backfill critical roles. The 2024 forecast looks challenging, specially from a cost perspective.” New orders, production and inventories were reported to have declined. Customer inventories were reported as “too high”. Employment levels grew.
Among the comments in the Fed Beige Book specific to chemicals:
- First District (Boston): “A chemical manufacturer said higher interest rates were at least partly to blame for sharply weaker sales in 2023.”
- Fourth District (Cleveland): “Freight contacts reported an increase in certain markets such as grain and chemical transport.”
- Sixth District (Atlanta): “Demand for chemical intermediate products remained sluggish.” And “Demand for electricity shifted from residential to commercial with more employees in office, and industrial electricity demand began to move from chemical, paper, and housing-related industries to data centers and battery and EV manufacturing."
- Eleventh District (Dallas): “Chemical production was mixed, and refinery activity decreased.”
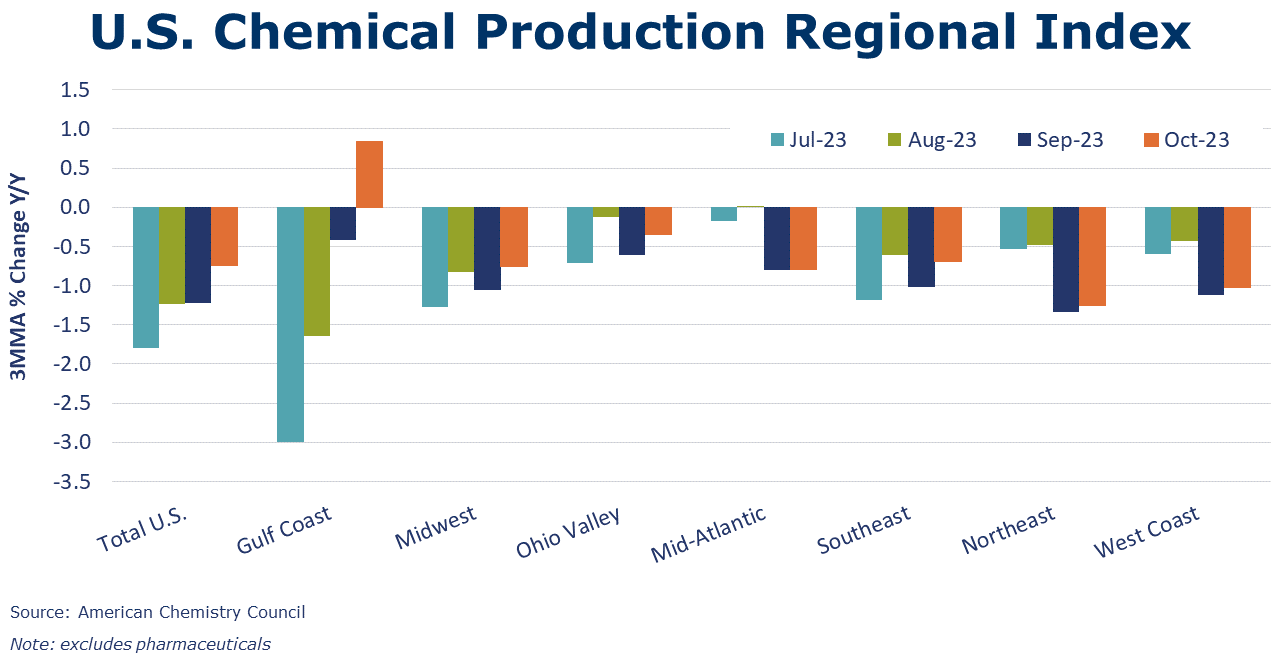
Following a downwardly revised 0.3% decline in September, ACC’s U.S. Chemical Production Regional Index (CPRI) rose 0.1% in October. Chemical production remained lower by 0.7% compared to a year ago. In October, the trend in chemical production was essentially flat to modestly higher in all regions.
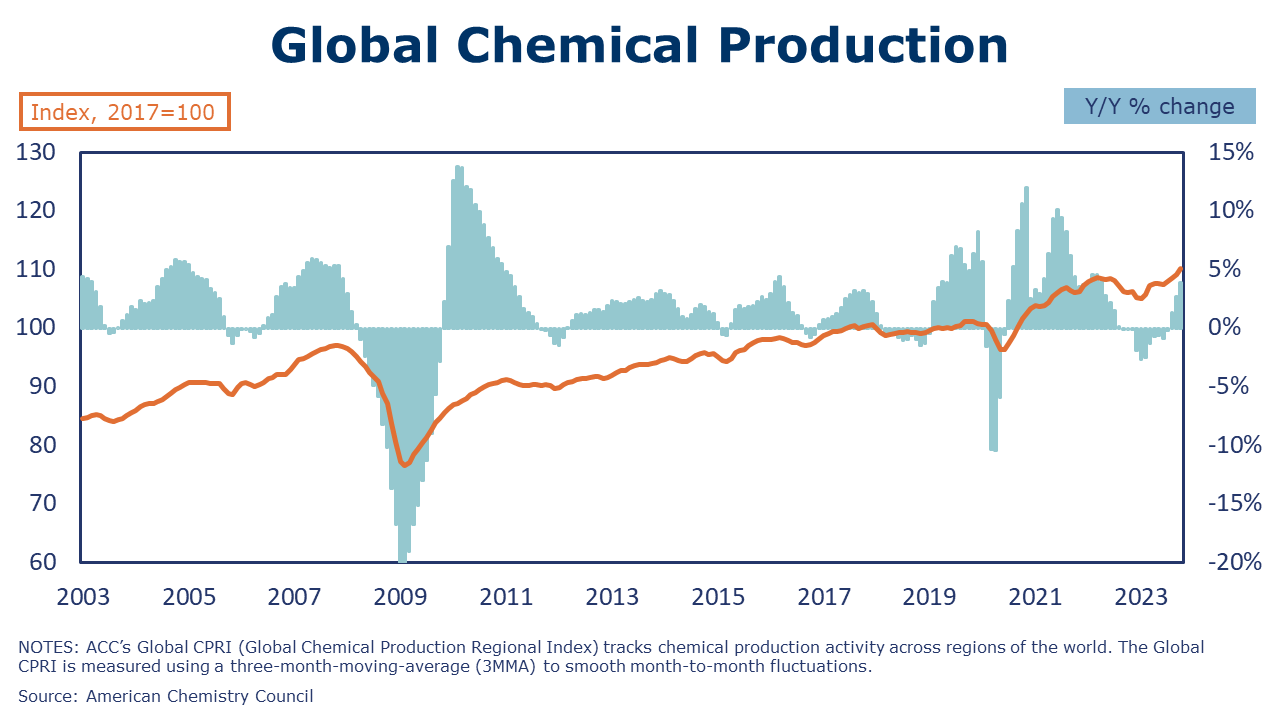
Following the 0.6% gain in September, ACC’s Global Chemical Production Regional Index (Global CPRI) continued to improve with a 0.9% increase in October. All regions showed growth with Asia and South America leading the pack. Most significant increases were observed in China, Japan, Korea, Germany, Italy, and Russia. Global output was up in most segments. The only two segments showing softness were agricultural chemicals and other specialties. Global chemicals production growth was up 3.9% Y/Y.
Note On the Color Codes
Banner colors reflect an assessment of the current conditions in the overall economy and the business chemistry of chemistry. For the overall economy we keep a running tab of 20 indicators. The banner color for the macroeconomic section is determined as follows:
Green – 13 or more positives
Yellow – between 8 and 12 positives
Red – 7 or fewer positives
There are fewer indicators available for the chemical industry. Our assessment on banner color largely relies upon how chemical industry production has changed over the most recent three months.
For More Information
ACC members can access additional data, economic analyses, presentations, outlooks, and weekly economic updates through ACCexchange.
In addition to this weekly report, ACC offers numerous other economic data that cover worldwide production, trade, shipments, inventories, price indices, energy, employment, investment, R&D, EH&S, financial performance measures, macroeconomic data, plus much more. To order, visit http://store.americanchemistry.com/.
Every effort has been made in the preparation of this weekly report to provide the best available information and analysis. However, neither the American Chemistry Council, nor any of its employees, agents or other assigns makes any warranty, expressed or implied, or assumes any liability or responsibility for any use, or the results of such use, of any information or data disclosed in this material.
Contact us at ACC_EconomicsDepartment@americanchemistry.com.


