May 16, 2022
(press release)
–
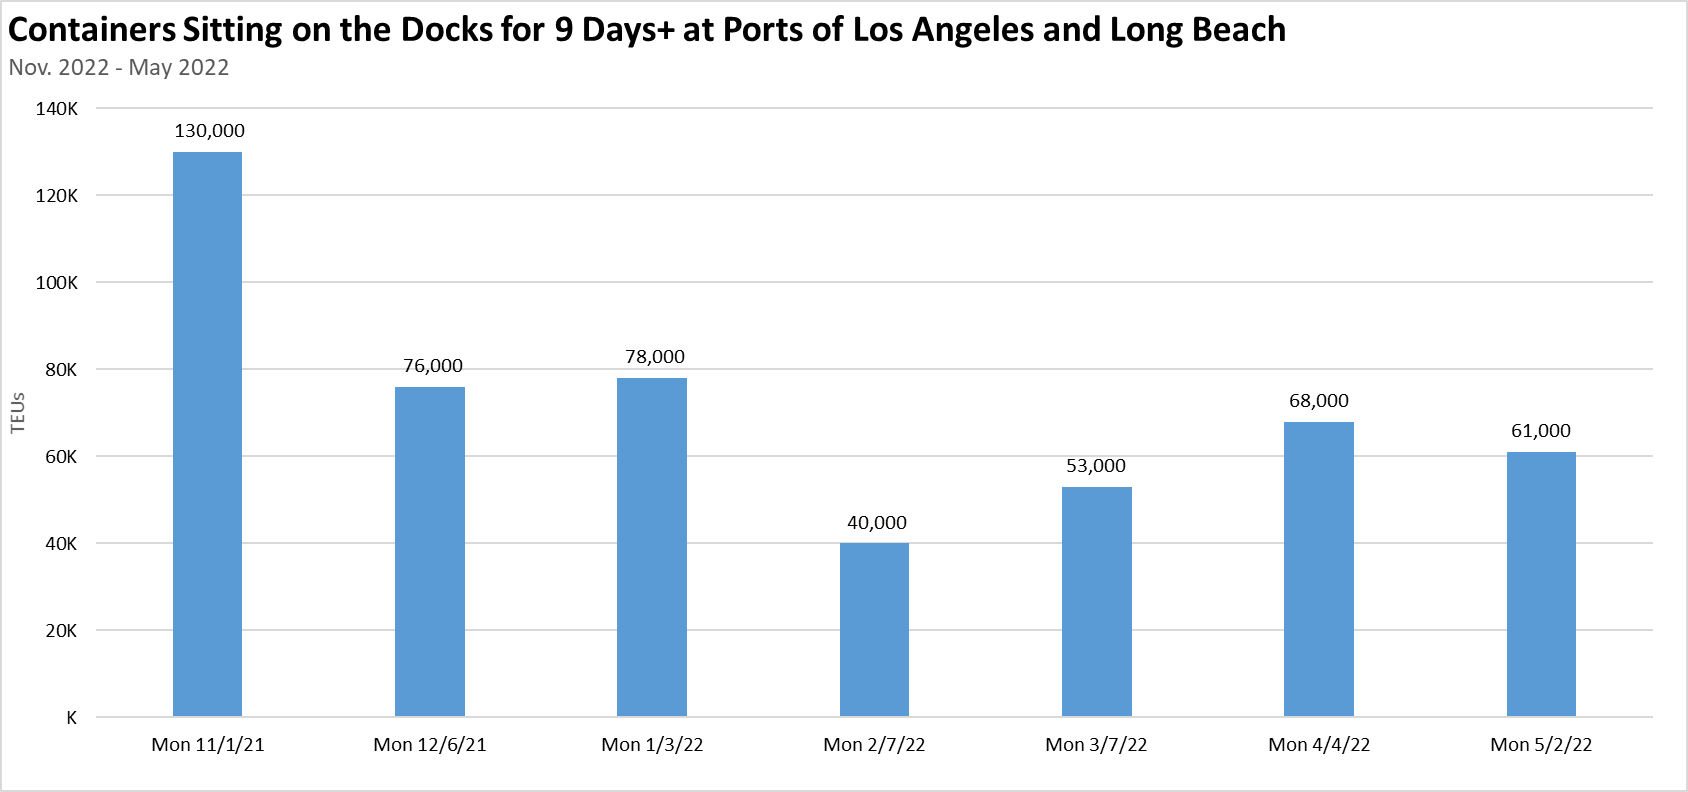
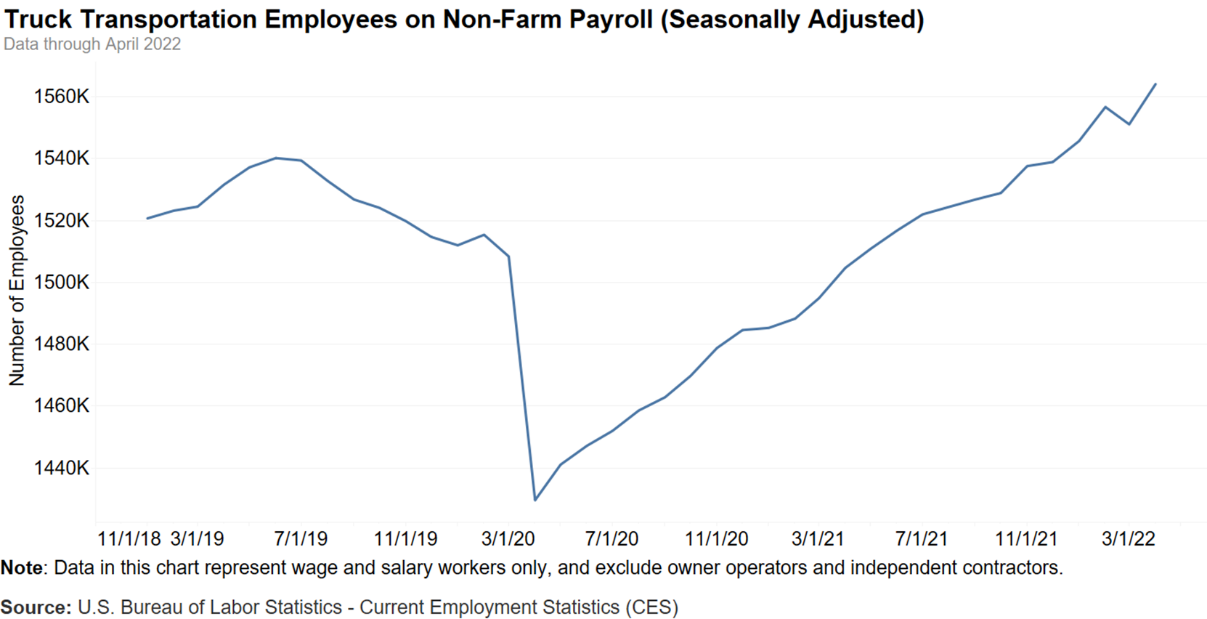
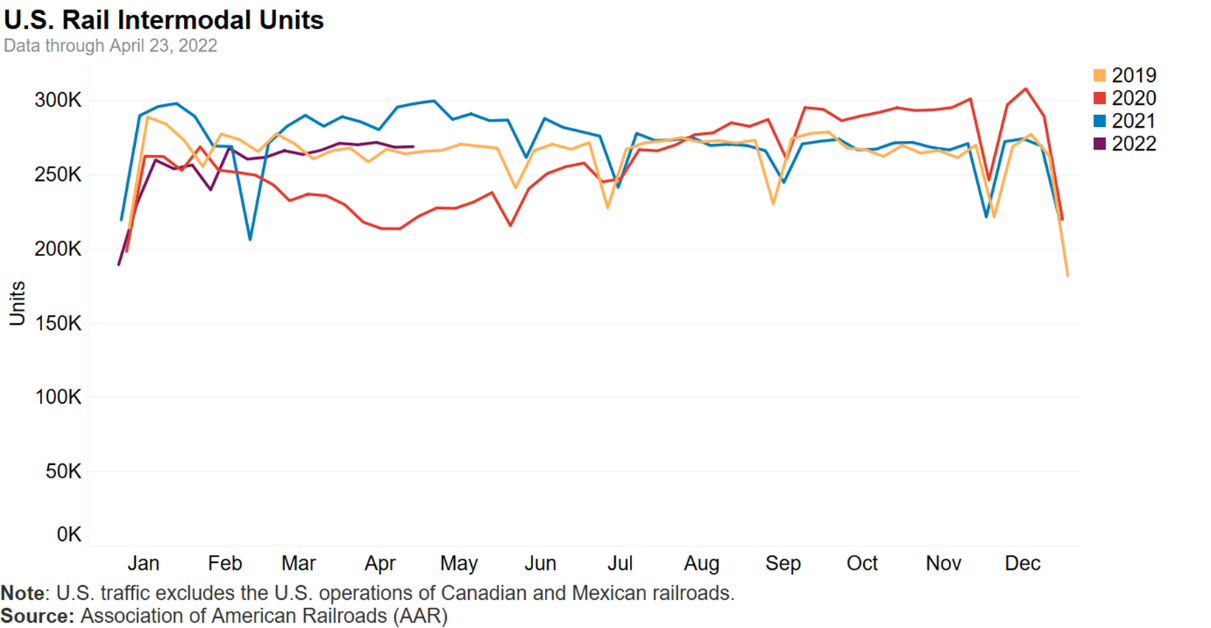
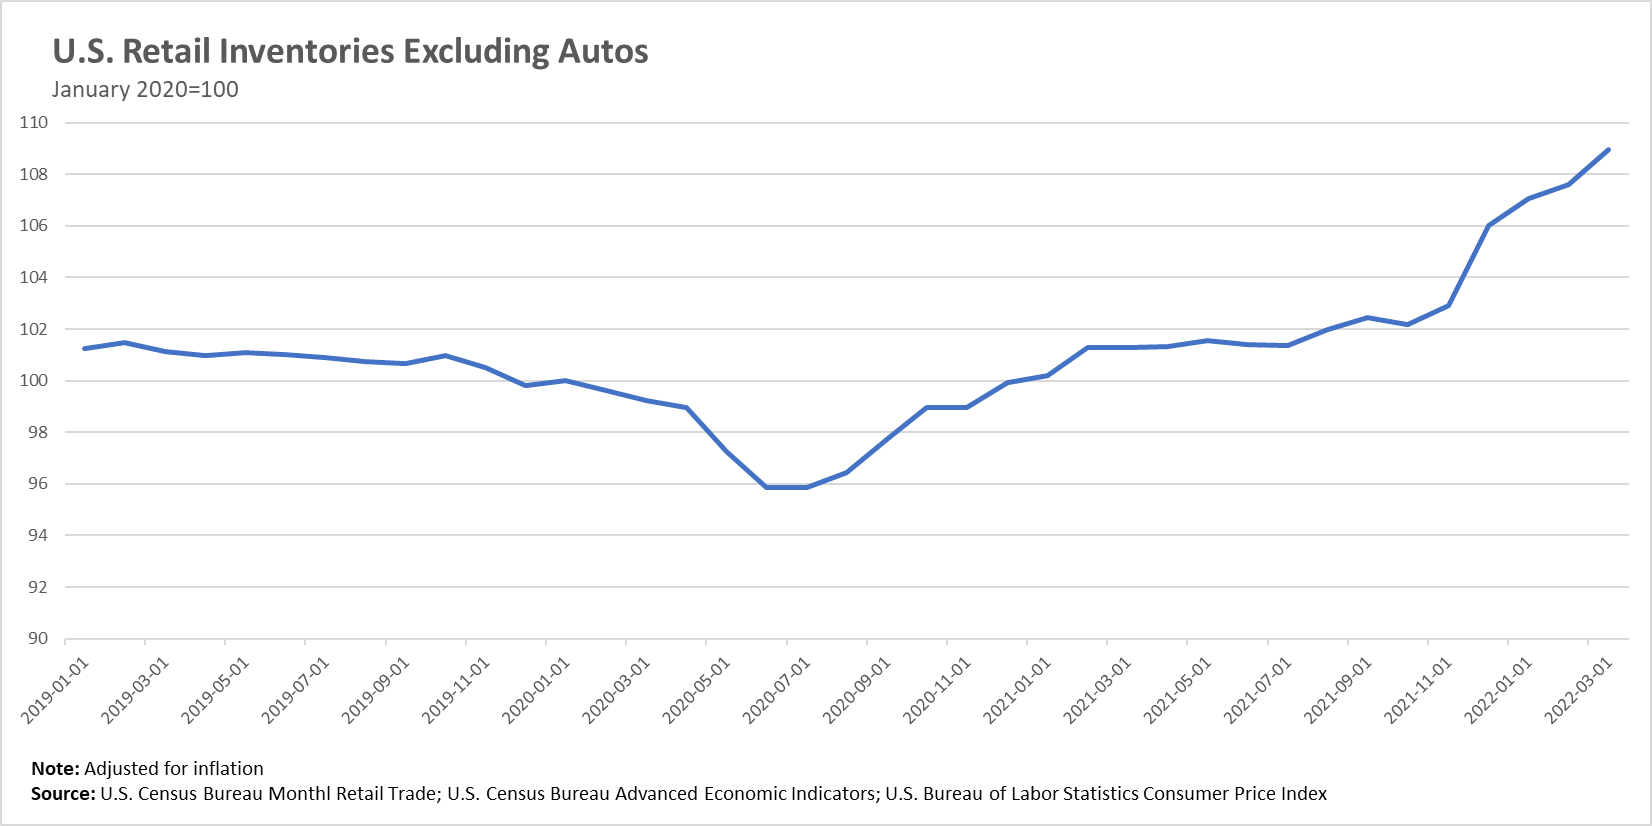
The U.S. Department of Transportation (USDOT) is pleased to share the latest Transportation Supply Chain Indicators Tracker, as part of the Administration’s Supply Chain Disruptions Task Force. Since the beginning of the COVID-19 pandemic, we have seen stressed supply chains, as historic levels of goods coming into the U.S., aging infrastructure, the pandemic, and geopolitical disruptions continue to cause bottlenecks, congestion, and challenges in global markets. Despite challenges, there are signs of progress in our goods movement chain. The total number of container ships waiting for berths at U.S. ports has dropped by 47% since peaking in early February, even as containerized imports increased sharply in March for most U.S. ports. The Ports of Los Angeles, Long Beach, and New York/New Jersey, collectively the top 3 for container volume to the U.S., imported 260,000 more containers in March versus February—a 12% increase and the all-time highest month for the Port Authority of New York and New Jersey. Overall, U.S. ports imported nearly a half-percent more in the first quarter of 2022 than during the first three months of last year. Early indications are this strength continued in April, as the Port of Los Angeles announced last week it estimates the port had its second-best April on record. And real retail inventories excluding autos are at their highest levels in history and more than 8 percent above pre-pandemic levels. But our work is not done. We remain focused on ensuring U.S. exporters are able to get their goods to market. Our attention continues to be on maintaining lower levels of long-dwelling containers at ports, particularly empty ones that could be re-loaded with U.S. products that are ready for export. DOT and the Task Force are focused on poor rail service as well. While our indicators show that weekly intermodal movements in March and April have grown, this only captures more trains getting on the tracks and does not reflect the delays in containers getting to their destinations. For key rail lines, train speed is down and trains are spending more time delayed at terminals. This breakdown in rail service is making it more difficult to clear the docks at Ports of Los Angeles and Long Beach: the number of trucking containers that have been on the docks for nine days or more is lower than ever at the Port of Long Beach but the number of long-dwelling rail containers is breaking new records each week. In other areas of the country, rail performance has also been especially poor for agricultural commodities like grain and fertilizer: unfilled grain car orders in 2022 are the highest on record including years with bad weather. We’ve supported the railroads’ regulator—the Surface Transportation Board (STB)—in their closer look at this. DOT Secretary Buttigieg testified on the issue at STB’s rail service hearing in late April – the first DOT Secretary to testify at the STB in at least 20 years. And we applaud the STB for taking expedited action to address situations where a railroad isn’t providing adequate service by allowing the shipping company to receive an emergency, expedited order from the STB allowing a different railroad to use the host railroad’s tracks. We’re also watching precarious situations abroad, including in China, where lockdowns could potentially reduce imports and affect our supply chains. The State Department is providing the Administration updates from China and the Commerce Department is closely monitoring impacts to companies and American consumers. Despite the lockdown, the Port of Shanghai remains open and the latest data show that exports from major Chinese ports were down only slightly in April compared to the previous year. Nevertheless, factory shutdowns and trucking delays in China could impact our supply chain, especially for autos and consumer electronics. Finally, the Task Force recognizes industry is paying attention to the West Coast labor negotiations, which are expected to begin this week. Both parties have recently expressed optimism about getting a deal—as West Coast longshore worker union president Willie Adams has said, “We’ve been doing this over 85 years, and we will sit down, we will get an agreement.” BACKGROUND ON THE TRACKER Over the course of the past year, as part of the President’s Supply Chain Disruptions Task Force (Task Force), the Department of Transportation (USDOT), and the Departments of Commerce and Agriculture, have been part of an Administration-wide effort to improve the flow of goods, make our supply chains more resilient, and lower prices for Americans. Freight and logistics supply chains are largely operated by the private sector. To support greater transparency about the state of our transportation supply chains, last fall, the Task Force released a dashboard tracking real-time challenges and progress across four key metrics. USDOT is continuing to track those four metrics and others to help depict a more complete picture of the current logistics and transportation state-of-play. USDOT’s Transportation Supply Chain Indicators Tracker (Tracker) provides updates on key supply chain data -- including measures and indicators of intermodal throughput such as volumes of U.S. imports and exports, transportation labor numbers, the number of container ships anchored and loitering near U.S. ports, and more. The Tracker is a collaboration across many departments participating in the Task Force and is intended to provide information about critical supply chains to the public. It will be updated over time, including additions and adjustments as data and information are refined. USDOT and other members of the Task Force are working closely with private companies and public agencies to address supply chain disruptions and improve the movement of goods across the country. The following measures are provided in this update: Non-Transportation Supply Chain Measures 9. U.S. retail inventories Imports and Exports: Monitoring containerized imports and exports helps identify potential capacity constraints and stresses to U.S. supply chains. 1/ There has been a sustained increase in containerized imports to U.S. ports. Chart depicts the total volume of containerized imports and exports (measured as Twenty-foot Equivalent Units (TEUs)) moved through U.S. ports for each month since January 2019. 2/ Increased container import volume has been observed at many ports, compared to pre-pandemic levels. Chart depicts total volume of containerized imports (measured as Twenty-foot Equivalent Units (TEUs)) at select U.S. ports overall since January 2019. Ships and Containers: Monitoring the number of ships waiting for berths at U.S. ports, and the rate at which imported containers move inland from the ports, can help measure disruptions in supply chains, including at original port of call, port of destination, and inland modes. 3/ In late 2021 and early 2022, the number of container ships waiting for a dock at a U.S. port more than doubled, peaking at more than 150 in early February. Levels have declined since then, but are still higher than historical levels for many ports. Chart depicts the total number of container ships waiting for an available dock at U.S. ports overall (solid line) and select major port complexes (dashed lines). 4/ In late October 2021, the Ports of Los Angeles and Long Beach, which account for around 37% of all U.S. containerized imports, announced intentions to levy fees on long dwelling containers. Since that time, nearly 70,000 fewer are dwelling more than 9 days or more on the ports—a 53% improvement. Chart depicts the total number of imported containers sitting at terminals at the Ports of Los Angeles and Long Beach for 9 days or more, (i.e. long-dwelling). The chart shows the approximate total of long dwelling containers reported on the first Monday of each month since November 2021. Estimated TEU measure is calculated using a standard practice of multiplying total units reported by the ports by a factor of 1.8. Workforce: Monitoring job openings and employment trends across the sector helps understand how labor capacity may impact supply chain fluidity. 5/ In 2021, job openings increased substantially, outpacing a slight increase in hiring, in the Transportation, Warehousing, and Utilities sector. Chart depicts job openings and labor turnover in the Transportation, Warehousing, and Utilities sector of the economy, by month. 6/ As of April 2022, the trucking industry has recovered more than 50,000 workers since one year earlier, and sits at around 40,000 higher than at start of the pandemic. Chart depicts the number of employees working in the truck transportation subsector of the economy, on a monthly basis, and includes the drivers, mechanics, managers, and laborers/movers involved in this sector. Self-employed drivers, known as owner-operators, are not included in this measure. Rail: Measuring and monitoring intermodal units moved by rail helps identify capacity constraints on U.S. railroads and potential stresses to U.S. supply chains, overall. 7/ Intermodal movements by freight rail have generally trended at or above pre-pandemic (2019) levels. Chart depicts how many shipping containers and truck trailers are moved on rail cars in a given week on U.S. Class I Railroads. Approximately half of all railroad traffic is intermodal. 8/ Terminal dwell times for railcars have risen since spring of 2021 for most Class I railroads. Chart depicts the average terminal dwell times (the total time, in hours, that a car spent in a given terminal) for the seven major Class I rail companies, by week. 9/ Retail inventories excluding autos were more than 8 percent above pre-pandemic levels at the end of March. Higher frequency data from grocery and drug stores show that the share of products that were in stock was 90 percent the week ending May 1, 2022 compared to 91 percent the week ending February 23, 2020. Chart depicts the inflation-adjusted value of the goods in retailers’ warehouses and on their shelves excluding motor vehicle and parts dealers


Non-Transportation Supply Chain Indicators
* All content is copyrighted by Industry Intelligence, or the original respective author or source. You may not recirculate, redistrubte or publish the analysis and presentation included in the service without Industry Intelligence's prior written consent. Please review our terms of use.
