OTTAWA
,
March 4, 2022
(press release)
–
The total value of building permits decreased 8.8% to $10.1 billion in January. The residential sector fell 11.6% to $6.7 billion, while the non-residential sector declined 2.7% to $3.4 billion. On a constant dollar basis (2012=100) the total value of building permits declined 8.2%. Chart 1: Total value of building permits, seasonally adjusted Infographic 1: Building permits, January 2022 Residential sector pulled down by multi-family building intentions Chart 2: Value of building permits for the single-family and multi-family components Chart 3: Value of building permits for the residential and non-residential sectors Non-residential sector pulled down by commercial component Nationally, the decline in commercial construction intentions was partially offset by a 15.2% increase in the industrial component. Construction intentions in the institutional component (-2.6%) were slightly lower in January compared with the value in December. Declines in six provinces were mostly offset by strong growth in Ontario (+68.4%), reflecting a $102 million nursing home permit issued in North Bay. Nationally, the non-residential sector was down 2.7%. To explore data using an interactive user interface, visit the Building permits: Interactive Dashboard. To explore the impact of COVID-19 on the socioeconomic landscape, please consult the Canadian Economic Dashboard and COVID-19. For more information on housing, please visit the Housing statistics portal. Statistics Canada has a Housing Market Indicators dashboard. This web application provides access to key housing market indicators for Canada, by province and by census metropolitan area. These indicators are updated automatically with new information from monthly releases, giving users access to the latest data. Note to readers Unless otherwise stated, this release presents seasonally adjusted data with current dollar values, which facilitate month-to-month and quarter-to-quarter comparisons by removing the effects of seasonal variations. For information on seasonal adjustment, see Seasonally adjusted data – Frequently asked questions. Starting with the March 2021 reference period, monthly constant dollar estimates are available for the entire data series (34-10-0066-01). Constant dollars remove the effects of price changes over time and are calculated using quarterly deflators from the Building Construction Price Index (18-10-0135-01). Typically, the first two months of a quarter use the previous quarter's price level and are revised when the new quarterly price index becomes available. Building components Revision Trend-cycle estimates have been added to the charts as a complement to the seasonally adjusted series. Both seasonally adjusted data and trend-cycle estimates are subject to revision as additional observations become available. These revisions could be large and could even lead to a reversal of movement, especially at the end of the series. The higher variability associated with trend-cycle estimates is indicated with a dotted line on the charts. For information on trend-cycle data, see the StatCan Blog and Trend-cycle estimates – Frequently asked questions. Next release Contact information Industry Intelligence Editor's Note: This press release omits select charts and/or marketing language for editorial clarity. Click here to view the full report. 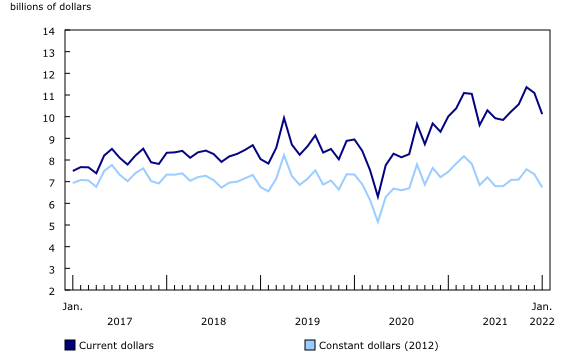
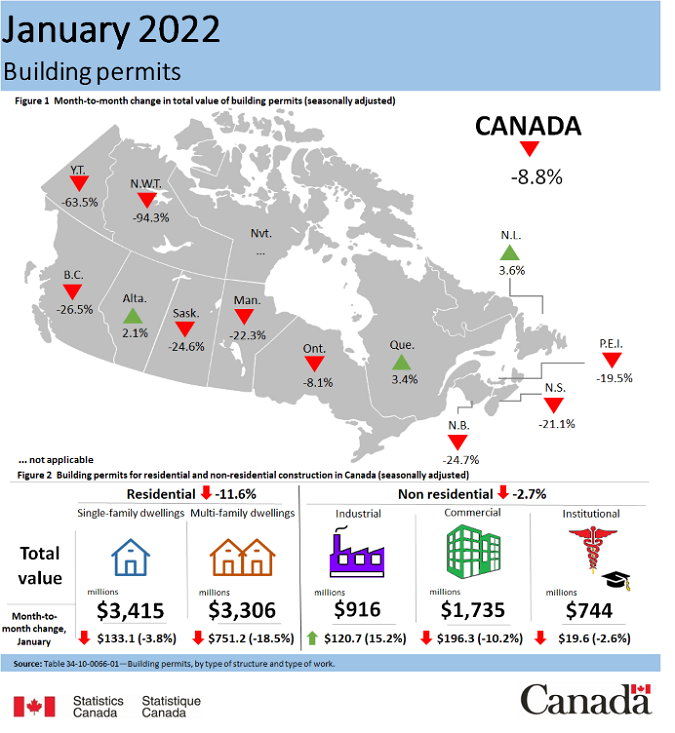
The majority of the drop in the residential sector was in the multi-family component (-18.5%), while intentions for single family homes decreased by 3.8%. Most of the declines for January were in Ontario and British Columbia.

The commercial component decreased by 10.2% in January, pulling the non-residential sector lower. Ontario and British Columbia reported the largest declines in this sector. In British Columbia, the decline signified a return to more normal levels following a strong December.
As of February 1, 2022, the Building Permits Survey introduced an electronic questionnaire to replace older collection methods such as paper questionnaires, faxes and emails. As Statistics Canada migrates to this new system, data included in this release may see larger than normal monthly revisions.
Unadjusted data for the current reference month are subject to revisions based on late responses. Data for the two previous months have been revised. Seasonally adjusted data for the previous three months have also been revised.
Data on building permits for February 2022 will be released on April 4, 2022.
For more information, or to enquire about the concepts, methods or data quality of this release, contact us (toll-free 1-800-263-1136; 514-283-8300; infostats@statcan.gc.ca) or Media Relations (statcan.mediahotline-ligneinfomedias.statcan@statcan.gc.ca).
* All content is copyrighted by Industry Intelligence, or the original respective author or source. You may not recirculate, redistrubte or publish the analysis and presentation included in the service without Industry Intelligence's prior written consent. Please review our terms of use.
