WASHINGTON
,
November 10, 2022
(press release)
–
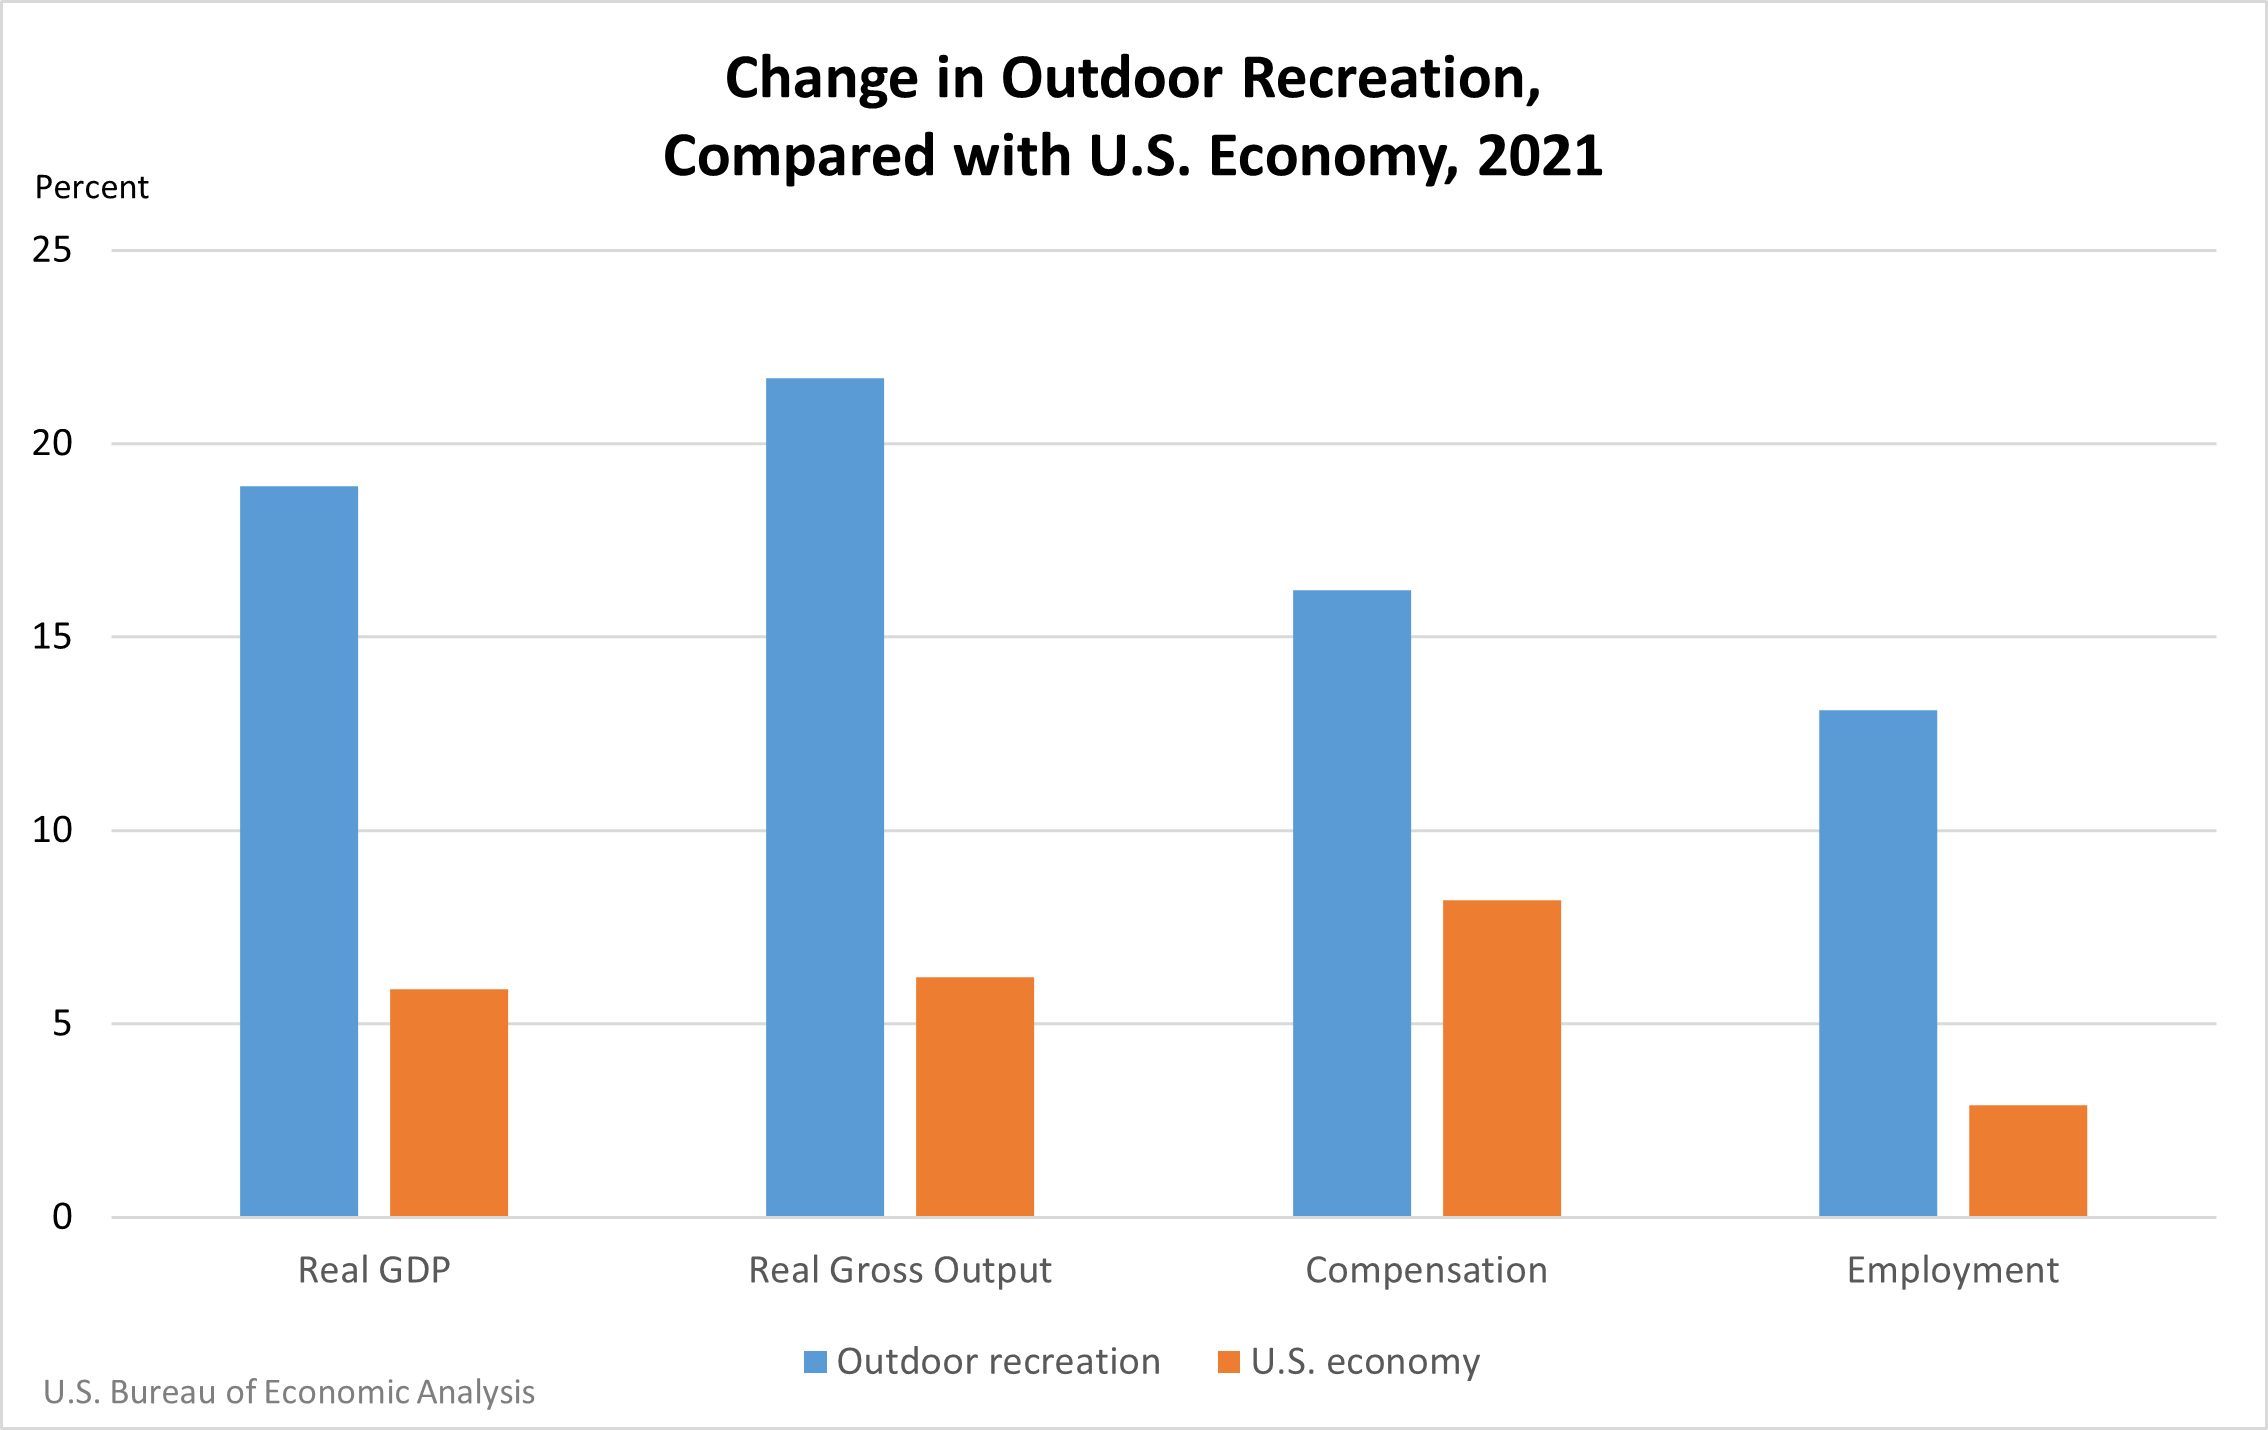
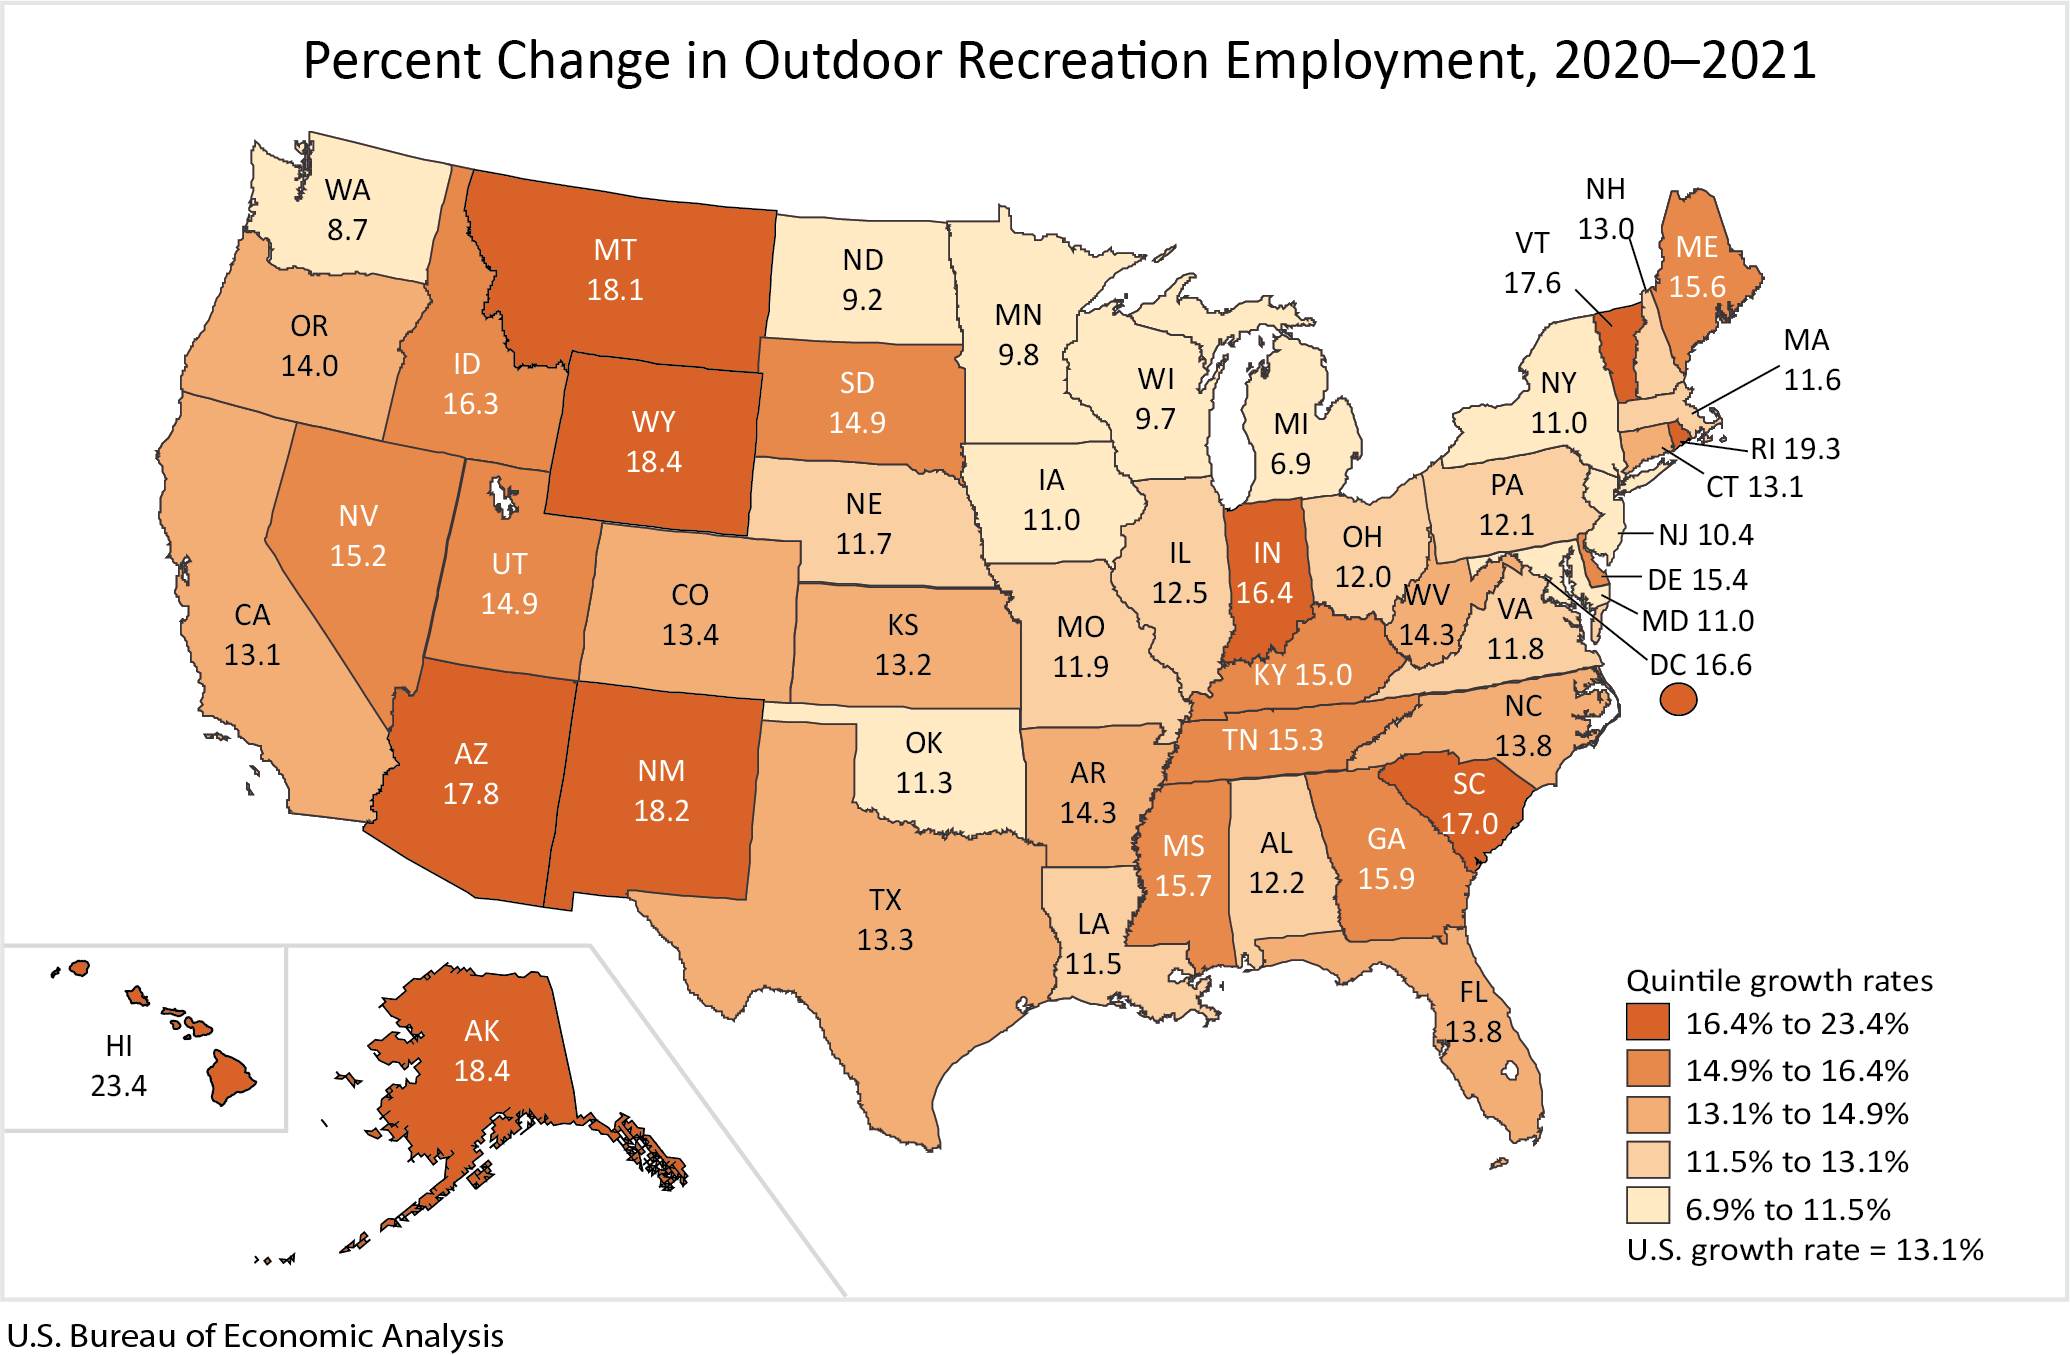
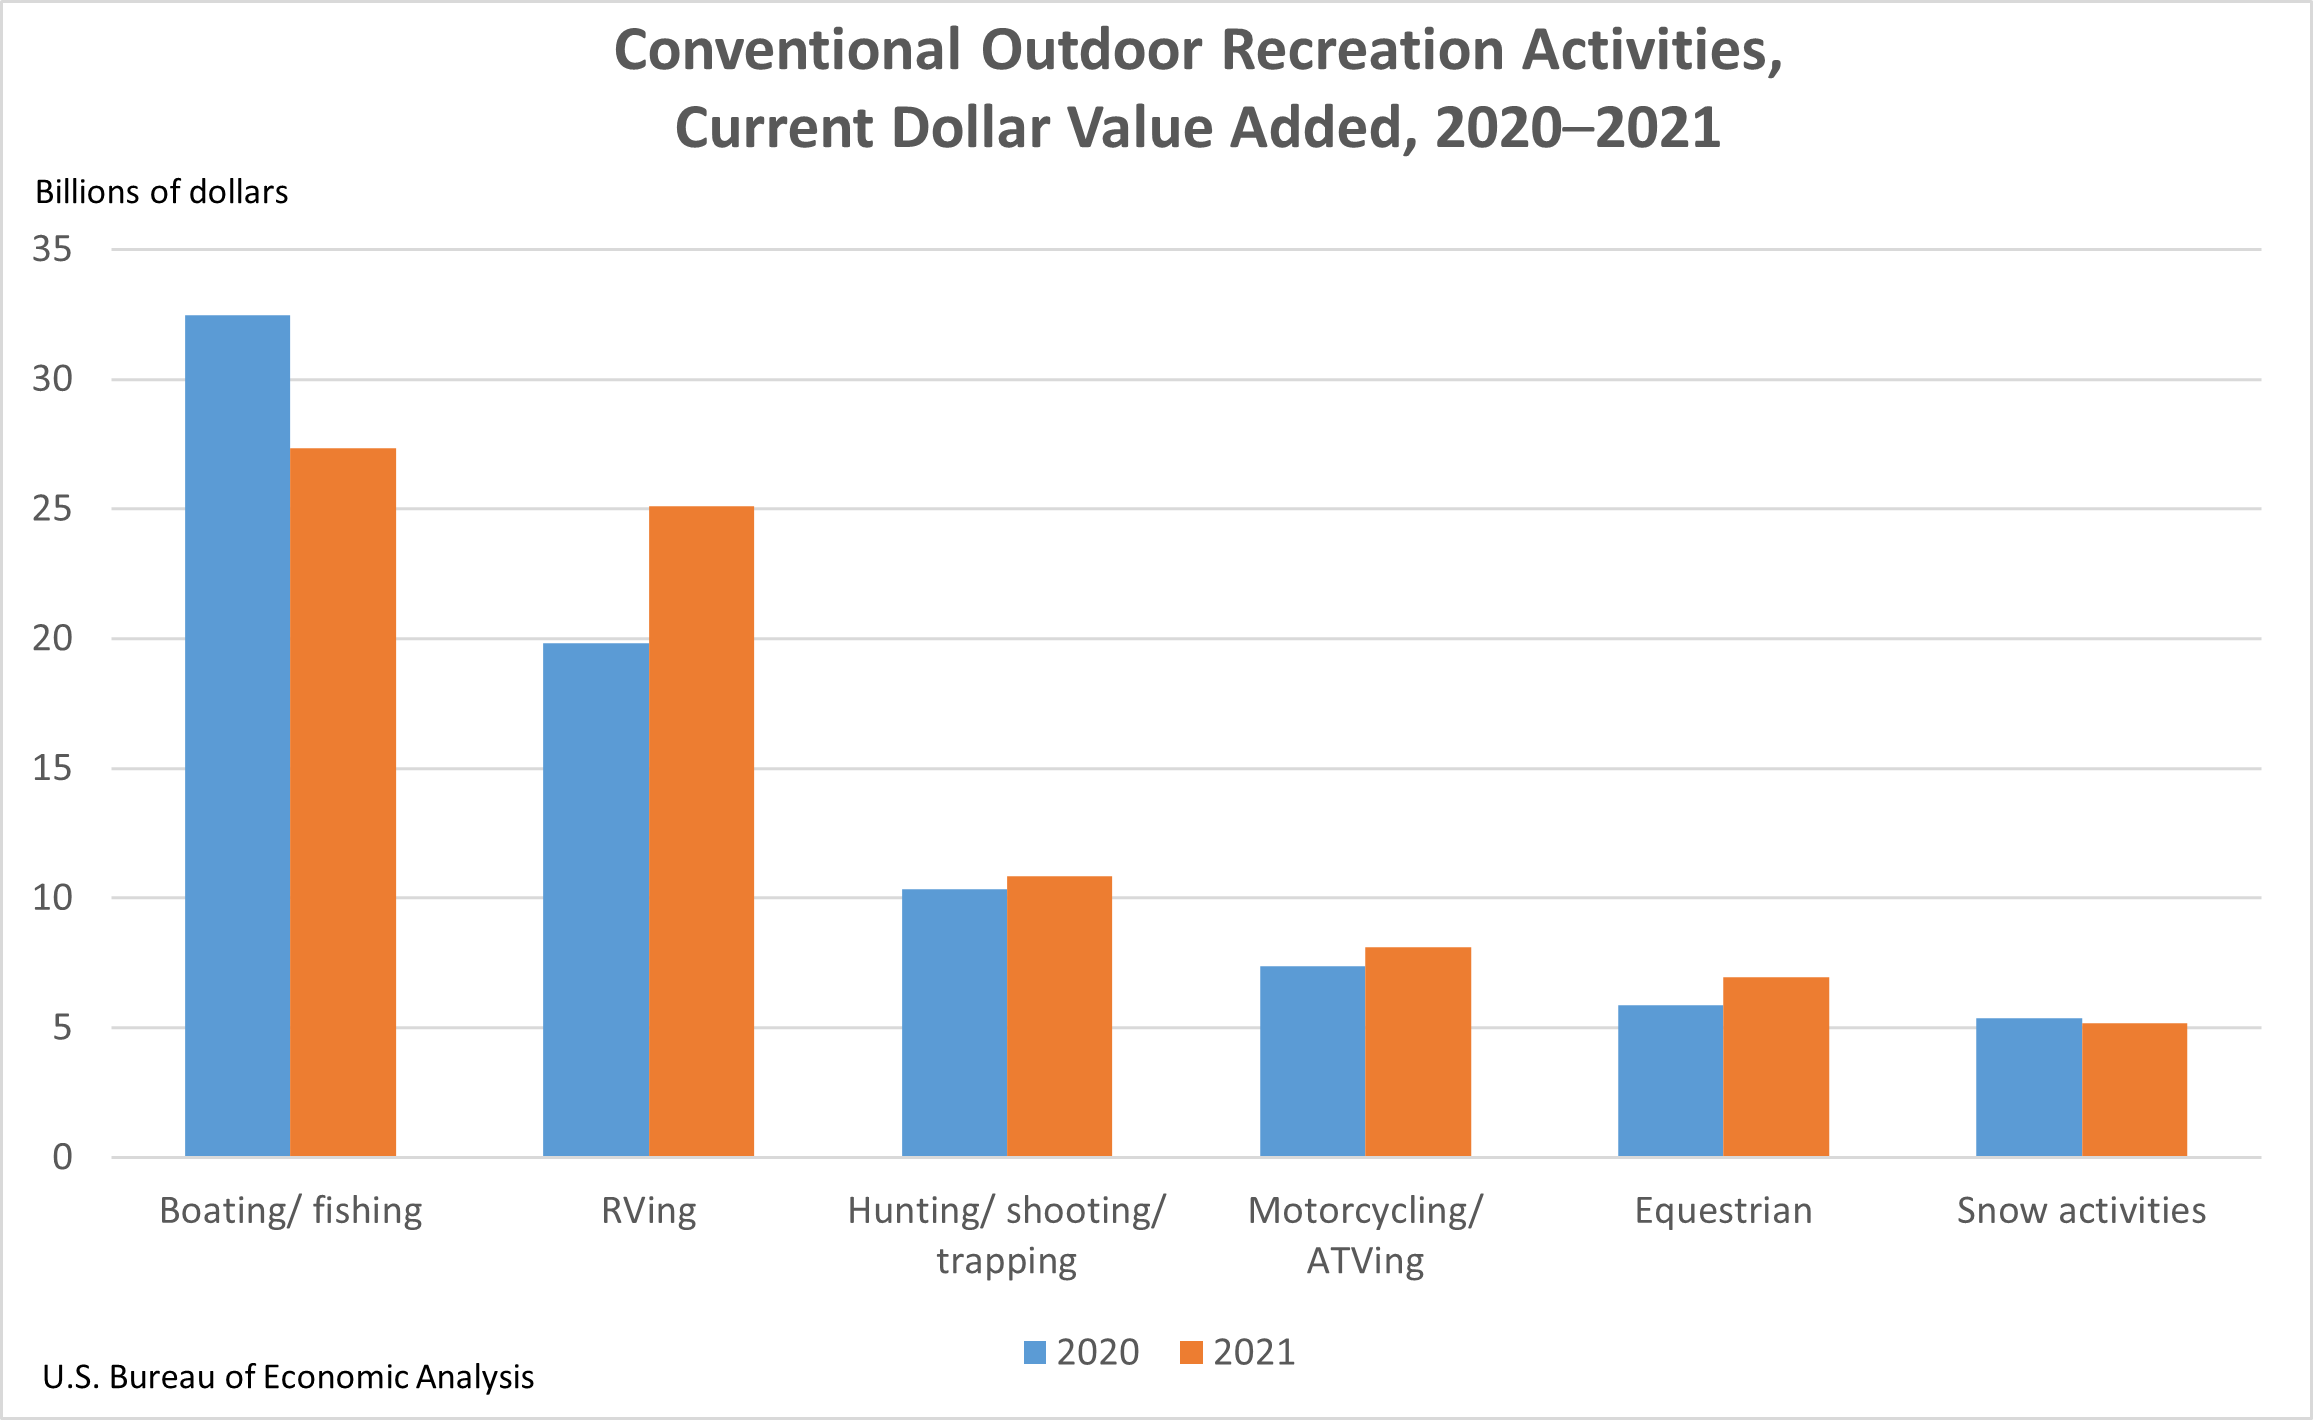
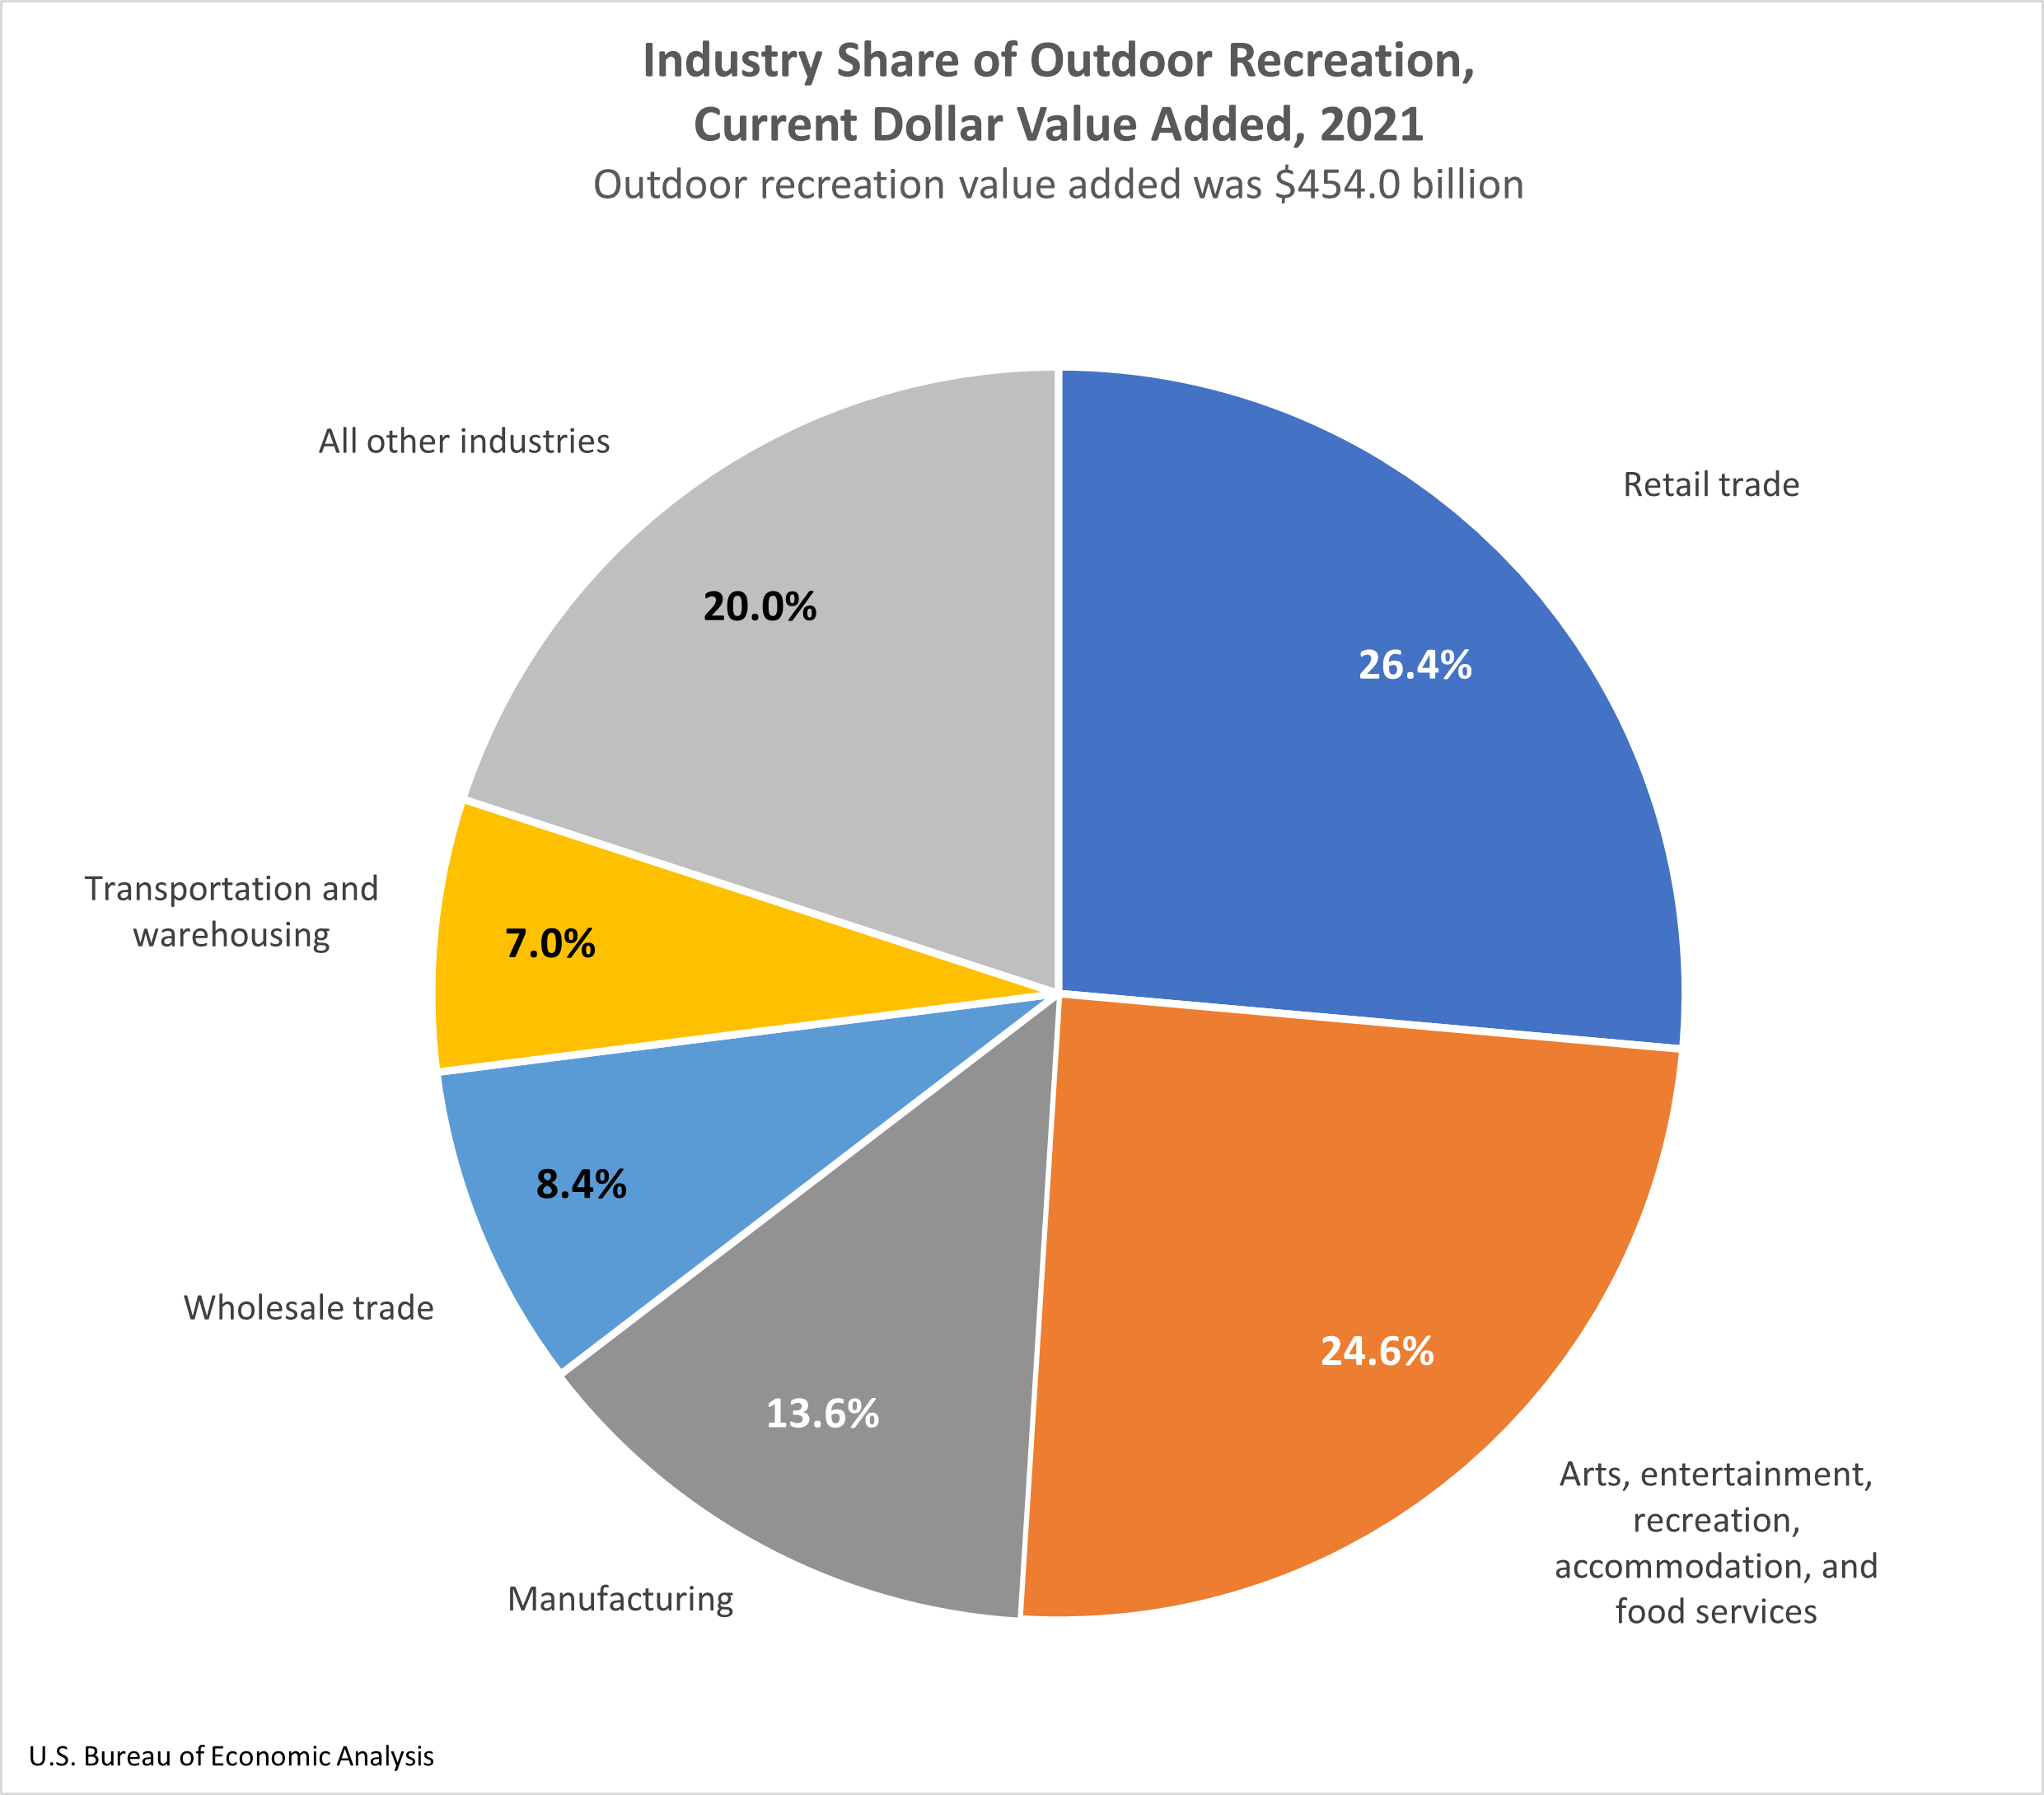
The U.S. Bureau of Economic Analysis released statistics today measuring the outdoor recreation economy for the nation, all 50 states, and the District of Columbia. The new U.S. data show that the outdoor recreation economy accounted for 1.9 percent ($454.0 billion) of current-dollar gross domestic product (GDP) for the nation in 2021 (national table 3). At the state level, value added for outdoor recreation as a share of state GDP ranged from 4.8 percent in Hawaii to 1.3 percent in New York and Connecticut. The share was 0.9 percent in the District of Columbia. Inflation-adjusted ("real") GDP for the outdoor recreation economy increased 18.9 percent in 2021, compared with a 5.9 percent increase for the overall U.S. economy, reflecting a rebound in outdoor recreation after the decrease of 21.6 percent in 2020. Real gross output for the outdoor recreation economy increased 21.7 percent, while outdoor recreation compensation increased 16.2 percent and employment increased 13.1 percent. Across all 50 states and the District of Columbia outdoor recreation employment increased in 2021, ranging from 23.4 percent in Hawaii to 6.9 percent in Michigan. Outdoor recreation by activity In 2021, conventional outdoor recreation accounted for 35.1 percent of U.S. outdoor recreation value added, compared with 40.1 percent in 2020. Other outdoor recreation accounted for 17.6 percent of value added in 2021, compared with 17.5 percent in 2020. Supporting activities accounted for the remaining 47.3 percent of value added in 2021, compared with 42.4 percent in 2020. Supporting activities, particularly travel and tourism-related activities, rebounded in 2021 as COVID–19 restrictions eased and consumers traveled more and increased spending on transportation, hotels, and restaurants. Additional highlights for value added by activity for 2021 are as follows: Outdoor recreation by industry For the nation, the retail trade industry group was the largest contributor to U.S. outdoor recreation value added in 2021, accounting for $119.9 billion (national table 6). At the state level, retail trade was the largest contributor to outdoor recreation value added in 33 states. The leading contributors were California ($13.7 billion), Texas ($10.4 billion), and Florida ($10.2 billion) (state table 3). Additional highlights for value added by industry for 2021 are as follows: Updates for 2017–2020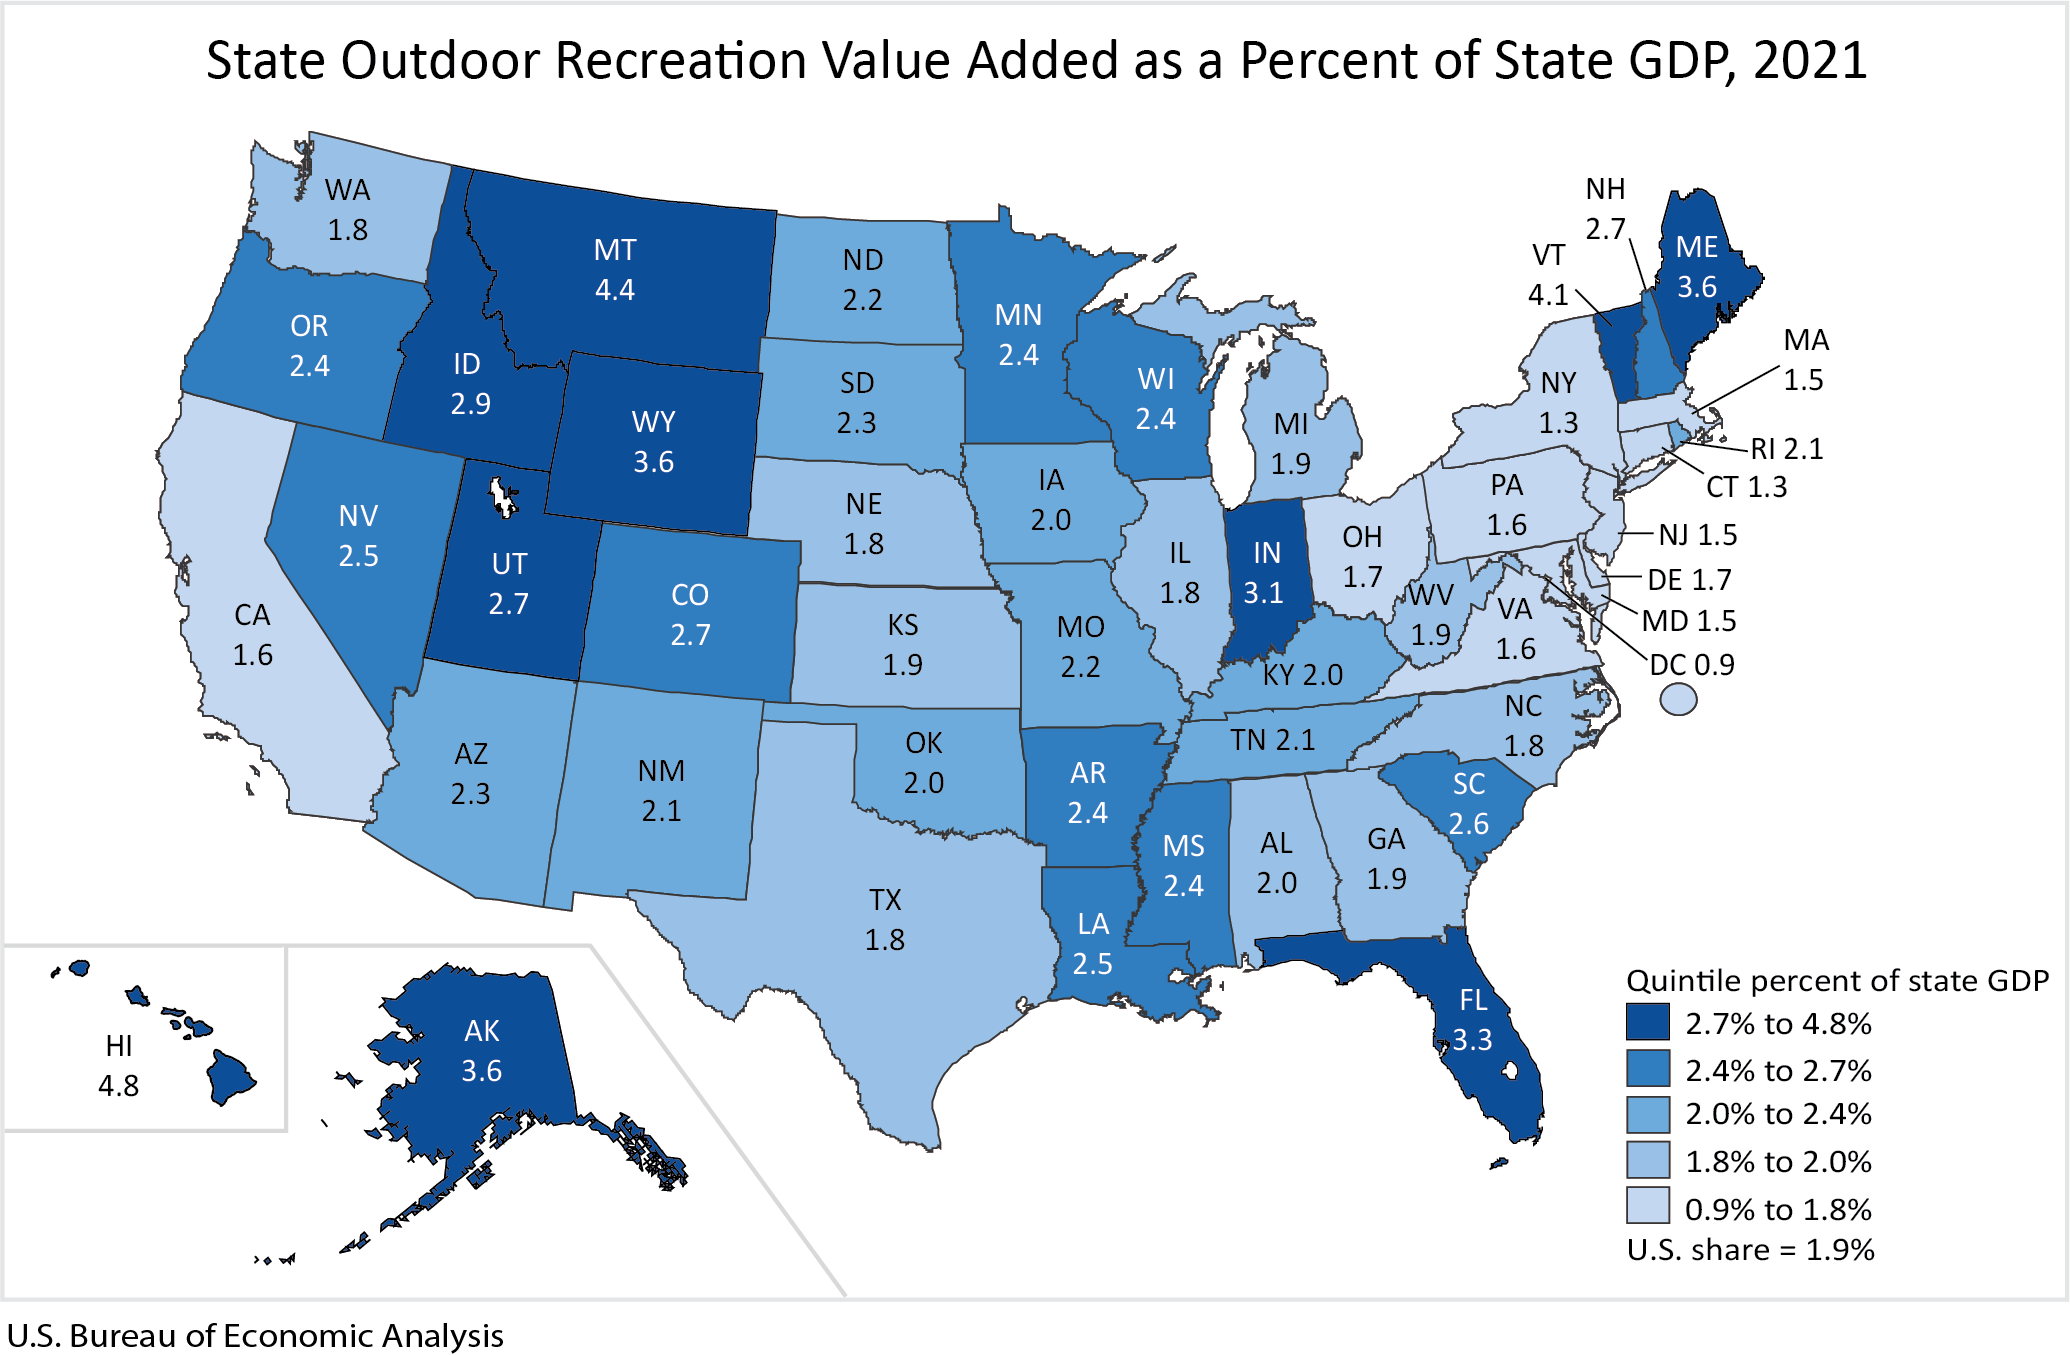
Outdoor recreation activities fall into three general categories: conventional activities (such as bicycling, boating, hiking, and hunting), other activities (such as gardening and outdoor concerts), and supporting activities (such as construction, travel and tourism, local trips, and government expenditures).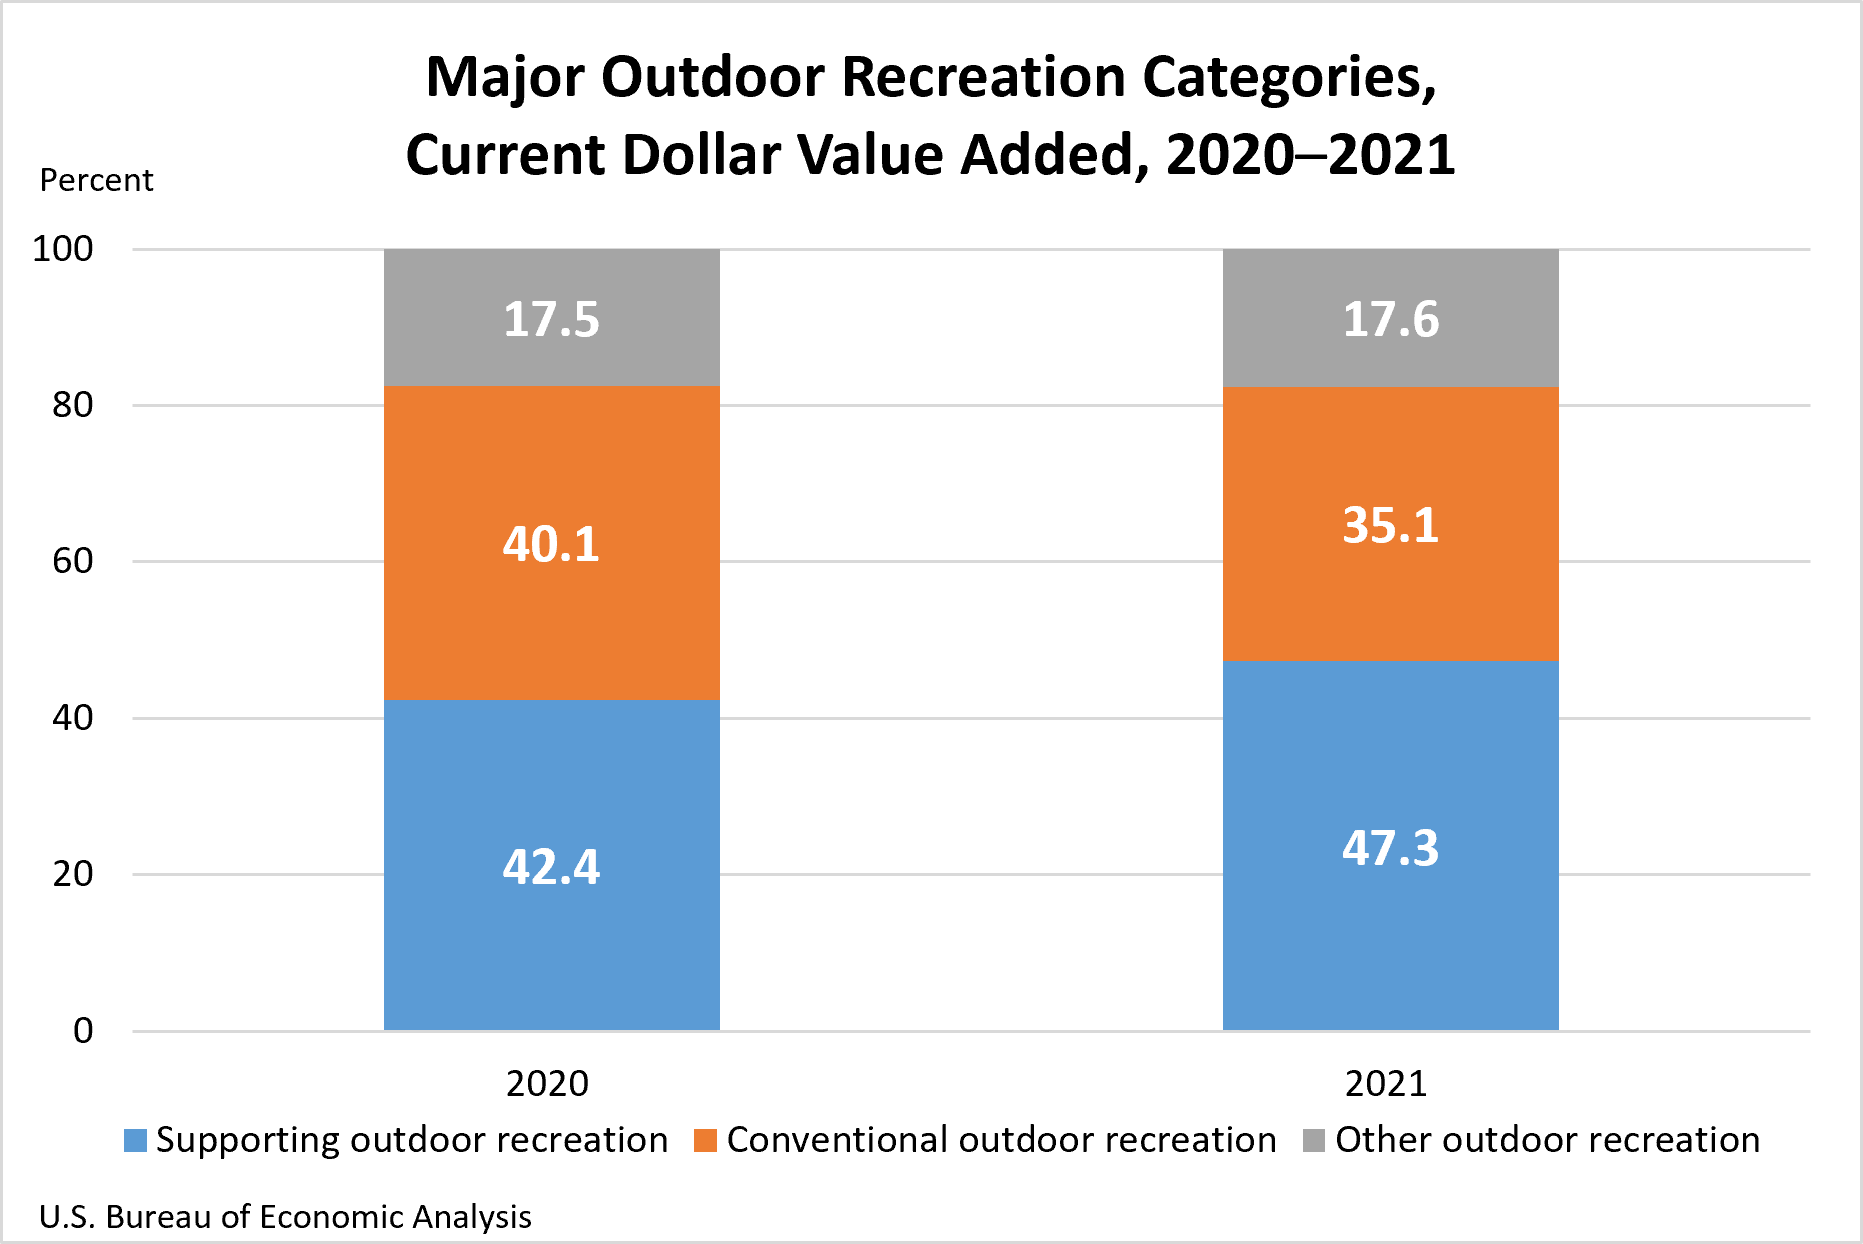
The outdoor recreation by industry data show the contributions of industries to the outdoor recreation economy, including their impact on value added, gross output, employment, and compensation.
Today's release also reflects updated statistics for 2017–2020. At the national level, gross output, value added, employment, and compensation now incorporate the results of the 2022 annual update of the National Economic Accounts, which includes the National Income and Product Accounts and the Industry Economic Accounts. The state statistics now reflect the updated national data as well as the 2022 annual update of the Regional Economic Accounts and newly available and revised regional source data.
Next release: November 2023
Outdoor Recreation Satellite Account, U.S. and States, 2022
* All content is copyrighted by Industry Intelligence, or the original respective author or source. You may not recirculate, redistrubte or publish the analysis and presentation included in the service without Industry Intelligence's prior written consent. Please review our terms of use.
