WASHINGTON
,
April 28, 2022
(press release)
–
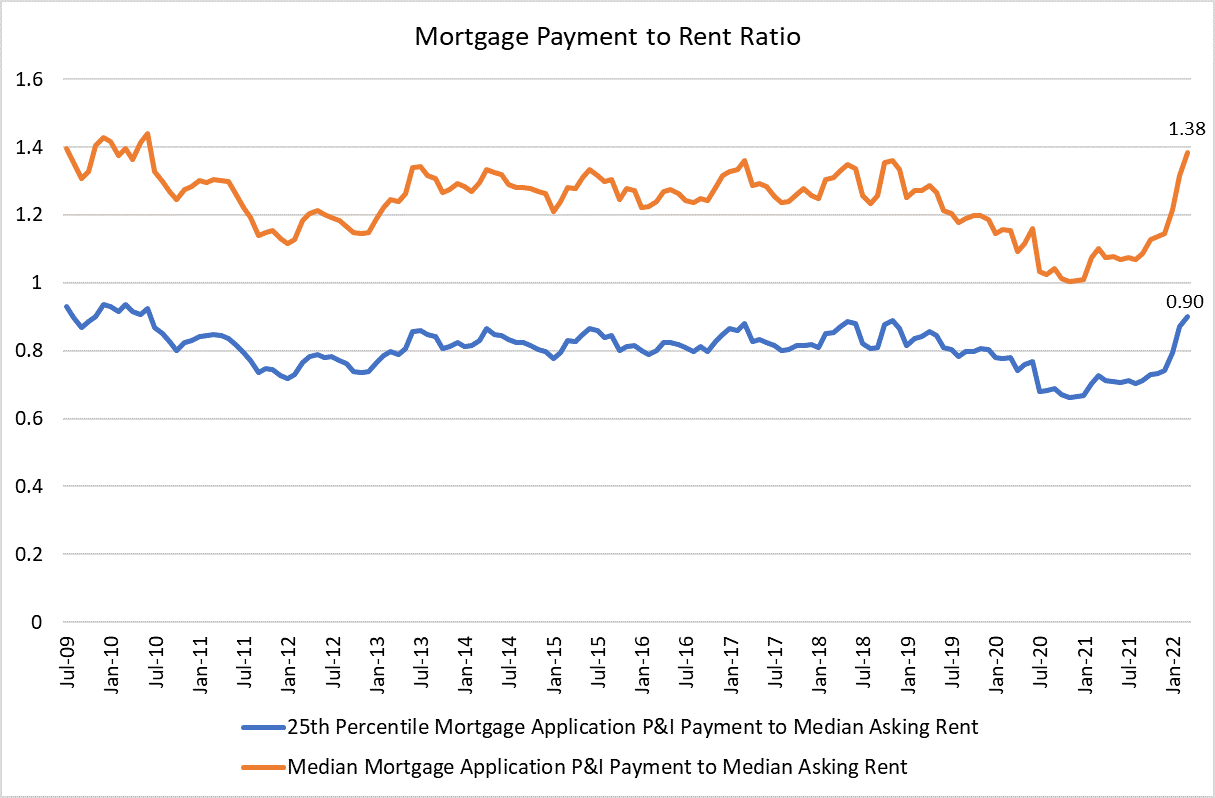
MBA’s new monthly affordability index reports applications data by loan type, geography, and race; comparison to asking rents Homebuyer affordability declined in March, with the national median payment applied for by applicants rising 5.0 percent to $1,736 from $1,653 in February. This is according to the Mortgage Bankers Association's (MBA) new Purchase Applications Payment Index (PAPI), which measures how new monthly mortgage payments vary across time – relative to income – using data from MBA’s Weekly Applications Survey (WAS). “The start of the spring homebuying season is off to a mixed start. The healthy labor market and robust wage gains fueled demand throughout the country in March, but rapid home-price growth and the 42-basis-point surge in mortgage rates last month slowed purchase application activity. A typical borrower’s principal and interest payment was $387 more than in March 2021,” said Edward Seiler, MBA's Associate Vice President, Housing Economics, and Executive Director, Research Institute for Housing America. “Swift price-appreciation, sky-high inflation, low inventory, and mortgage rates now two percentage points higher than last year are all headwinds for the housing market in the coming months – especially for first-time buyers.” Added Seiler, “MBA’s updated forecast calls for an annual decline in existing sales, higher home prices and mortgage rates, and a smaller, but solid 4 percent gain in purchase origination volume.” An increase in MBA’s PAPI – indicative of declining borrower affordability conditions – means that the mortgage payment to income ratio (PIR) is higher due to increasing application loan amounts, rising mortgage rates, or a decrease in earnings. A decrease in the PAPI – indicative of improving borrower affordability conditions – occurs when loan application amounts decrease, mortgage rates decrease, or earnings increase. The national PAPI (Figure 1) increased 5.0 percent to 150.9 in March from 143.7 in February, meaning payments on new mortgages take up a larger share of a typical person’s income. Compared to March 2021 (122.9), the index jumped 22.8 percent. For borrowers applying for lower-payment mortgages (the 25th percentile), the national mortgage payment increased 3.2 percent to $1,129 from $1,094 in February. MBA’s national mortgage payment to rent ratio (MPRR) increased to 1.38 in March (highest since 2010) from 1.32 in February, 1.22 in January, and 1.15 in December 2021, meaning mortgage payments for home purchases have increased relative to rents. The national median asking rent in first-quarter 2022 increased 4.0 percent on a quarterly basis to $1,255. The 25th percentile mortgage application payment to median asking rent ratio was 0.90 in March, up from 0.87 in February and 0.74 in December 2021. Additional Key Findings of MBA's Purchase Applications Payment Index (PAPI) – March 2022 About MBA’s Purchase Applications Payment Index The Mortgage Bankers Association’s Purchase Applications Payment Index (PAPI) measures how new mortgage payments vary across time relative to income. Higher index values indicate that the mortgage payment to income ratio (PIR) is higher than in a month where the index is lower. Contrary to other affordability indexes that make multiple assumptions about mortgage underwriting criteria to estimate mortgage payment level, PAPI directly uses MBA’s Weekly Applications Survey (WAS) data to calculate mortgage payments. PAPI uses usual weekly earnings data from the U.S. Bureau of Labor Statistics’ Current Population Survey (CPS). Usual weekly earnings represent full-time wage and salary earnings before taxes and other deductions and include any overtime pay, commissions, or tips usually received. Note that data are not seasonally adjusted. The rent data series calculated for MBA’s national mortgage payment to rent ratio (MPRR) comes from the U.S. Census Bureau’s Housing Vacancies and Homeownership (HVS) survey’s median asking rent. The HVS data is quarterly, and as such, the mortgage payment to rent ratio will be updated quarterly. For additional information on MBA’s Purchase Applications Payment Index, click here.


* All content is copyrighted by Industry Intelligence, or the original respective author or source. You may not recirculate, redistrubte or publish the analysis and presentation included in the service without Industry Intelligence's prior written consent. Please review our terms of use.
