OTTAWA
,
March 11, 2022
(press release)
–
Employment climbed 337,000 (+1.8%) in February, more than offsetting losses that coincided with stricter public health measures in January. The unemployment rate dropped 1.0 percentage points to 5.5% in February 2022, lower than in February 2020 (5.7%) and similar to the record low (5.4%) observed in May 2019. Other indicators point to an increasingly tight labour market in February. Total hours worked increased 3.6% while the employment rate, or the proportion of the population aged 15 and older who were employed, rose 1.0 percentage points to 61.8%. Highlights February employment growth was driven by gains in the number of private sector employees (+347,000; +2.8%). Gains were most notable in the accommodation and food services (+114,000; +12.6%), and information, culture and recreation (+73,000; +9.9%) industries. After reaching a record high in January (10.0%), the proportion of employees absent from work due to illness or disability fell to 6.2% during the week of February 13 to 19. Total hours worked were up 3.6%, exceeding hours worked in February 2020 for the first time (+1.7%). On a year-over-year basis, average hourly wages increased 3.1% (+$0.92). Employment in the goods-producing sector rose (+44,000), marking the third consecutive monthly increase. Employment rose in eight provinces and held steady in Alberta and New Brunswick. Unemployment rate falls below its pre-COVID-19 level for the first time Among youth aged 15 to 24, the unemployment rate fell 2.7 percentage points to 10.9% in February after increasing 2.5 percentage points in January. The unemployment rate fell for both core-aged women (-0.9 percentage points to 4.4%) and core-aged men (-0.5 percentage points to 4.3%). The number of long-term unemployed fell by 51,000 (-19.4%) in February, the fourth consecutive monthly decrease. The labour force participation rate among the population aged 15 and older increased by 0.4 percentage points to 65.4% in February, fully erasing the decline recorded in January. Employment gains in February were most notable in the accommodation and food services (+114,000; +12.6%), and information, culture and recreation (+73,000; +9.9%) industries. Employment increases were widespread across provinces and demographic groups. Labour Force Survey (LFS) data for February 2022 reflect labour market conditions during the week of February 13 to 19. After a tightening of public health measures in late 2021 and early 2022, many measures had been eased by the February reference week. Several provinces had lifted, or were in the process of lifting, proof of vaccination requirements and capacity limits in settings such as restaurants, retailers, theatres and gyms. Most schools had returned to in-person learning. Chart 1: Employment rebounds after January losses February employment gains led by private sector, while self-employment continues to be flat Self-employment was also little changed in February, and remained 246,000 (-8.5%) lower than in February 2020. Compared with two years earlier, there was no growth in the number of self-employed workers in any type of self-employment, in any province, or in the vast majority of industries (not seasonally adjusted). This suggests that the factors behind the decline in self-employment over the course of the pandemic are widespread throughout the economy and may signal a structural change in the feasibility or desirability of self-employment. Both full-time (+122,000; +0.8%) and part-time (+215,000; +6.2%) work increased in February. Gains in full-time work more than offset January losses (-83,000; -0.5%), while part-time growth in February erased cumulative losses sustained in December 2021 and January 2022 (-182,000; -5.0%). Chart 2: February gains in private sector employees exceed January losses Employment rate returns to pre-COVID level for the first time Record high employment rate among core-aged women Compared with February 2020, employment gains for core-aged women were largest in educational services (+70,000; +9.8%); professional, scientific and technical services (+46,000; +9.4%); and finance, insurance, real estate, rental and leasing (+42,000; +9.3%). For core-aged men, professional, scientific and technical services (+116,000; +19.5%) and health care and social assistance (+43,000; +13.3%) contributed the most to employment growth (not seasonally adjusted). February employment gains among core-aged women (+85,000; +1.4%) were nearly double the losses seen in January, with increases in both full-time (+33,000; +0.7%) and part-time (+52,000; +5.4%) work. Among core-aged men, monthly employment gains were entirely in full-time work (+70,000; +1.1%). Employment rate rises to record level among core-aged Indigenous people Employment rate grows among core-aged visible minority populations but historical gaps remain Consistent with historical trends, the employment rate in February was lower among visible minority women (75.6%) than among women who are not members of a visible minority group and not Indigenous (83.9%), with Filipino Canadians being a notable exception (87.6%). In February, among core-aged men, South Asian (90.0%) and Filipino (90.2%) Canadians had higher employment rates than men who are not a visible minority and not Indigenous (87.4%). In contrast, Chinese (83.8%) and Black (82.7%) Canadians had lower employment rates, consistent with results observed in the 2016 Census, the most recent available data from before the COVID-19 pandemic (not seasonally adjusted). February employment gains return youth employment to December 2021 level After dipping in January 2022, the employment rates for both men (56.8%) and women (59.9%) aged 15 to 24 were on par with February 2020. While the total number of employed youth has recovered to its pre-pandemic level, there have been some changes in the industries where youth work. In the two years to February 2022, youth employment losses in accommodation and food services (-89,000; -18.0%)—the industry that has seen the largest employment impacts over the course of the pandemic—were offset by gains in professional, scientific and technical services (+45,000; +45.2%), as well as in healthcare and social assistance (+34,000; +17.8%). There were also more youth working in retail trade (+42,000; +6.4%), which continued to be the industry that employs the largest proportion of youth (28.2%) in February 2022 (not seasonally adjusted). Employment rate among older men and women remains below pre-pandemic level Employment among men aged 55 and older was little changed in February, while their employment rate (39.9%) remained 1.8 percentage points below its pre-pandemic level. Working from home and absences decline as fifth wave of COVID-19 recedes The Omicron wave in January also affected absences from work. After reaching a record high in January (10.0%), the proportion of employees absent from work due to illness or disability fell to 6.2% during the week of February 13 to 19, consistent with typical rates at this time of year. This return to normal levels occurred across all demographic groups and regions (not seasonally adjusted). February marks a record high in total hours worked Driven in part by absences returning to typical seasonal levels, hours worked reached a record high in February 2022, up 1.7% from the previous high recorded in February 2020. The monthly increase in hours worked was particularly prominent in accommodation and food services (+14.0%); information, culture and recreation (+9.4%); and wholesale and retail trade (+4.6%), which have been impacted most strongly by public health measures. Despite the monthly increase, hours worked in accommodation and food services continued to lag February 2020 levels by 18.4%. Wages grow 3.1% on a year-over-year basis In 2019, when the unemployment rate fell to record lows, year-over-year wage growth averaged 3.5%, and reached 4.6% in November of that year. Alongside the recent upward trend in year-over-year wage growth, there have been continued increases in the cost of living for Canadians. In January 2022, Canadian inflation (as measured by the Consumer Price Index) surpassed 5% for the first time since September 1991, rising 5.1% on a year-over-year basis and up from a 4.8% increase in December 2021. LFS data over the coming months will shed light on whether the average hourly pay of Canadian employees continues its upward trend in this context. Chart 3: Year-over-year wage growth increases, but remains below growth in the Consumer Price Index Unemployment rate falls below its pre-COVID level for the first time The adjusted unemployment rate—which includes people who wanted a job but did not look for one—was 7.4% in February 2022. Chart 4: Unemployment rate lower than before the pandemic Unemployment rate falls in all major demographic groups Among youth aged 15 to 24, the unemployment rate fell 2.7 percentage points to 10.9% in February after increasing 2.5 percentage points in January. The unemployment rate declined for both young men (-2.6 percentage points to 12.3%) and young women (-2.8 percentage points to 9.5%). Among core-aged women, the unemployment rate fell 0.9 percentage points to 4.4% in February, fully erasing the increase of 0.6 percentage points recorded in January. For core-aged men, the unemployment rate fell 0.5 percentage points to 4.3%, following little change in January. The unemployment rate of women aged 55 and older declined for the first time since November 2021, down 1.9 percentage points to 4.9%. Among men aged 55 and older, the unemployment rate fell for the third time in four months, declining 0.5 percentage points to 5.7% in February 2022. Decline in long-term unemployment continues The number of Canadians who had been continuously unemployed for 27 weeks or more fell for the fourth consecutive month in February, down by 51,000 to 212,000. Following this drop, long-term unemployment was 32,000 higher than in February 2020. Some unemployed Canadians may be limited in their ability to find a job by the opportunities available in their local area and the challenges associated with moving to a different part of the country. In February 2022, people who had been unemployed for 27 weeks or more were slightly less likely to be willing to move to another province if they were offered a job (26.7%) than those who were unemployed for less than 27 weeks (31.5%) (population aged 18 to 64, not seasonally adjusted). Labour underutilization returns to its 2019 level As COVID-19 cases surged in January 2022, the number of people working less than half their usual hours—which includes people absent due to a personal illness or disability—increased by 620,000. In February, this number fell by 563,000, remaining slightly elevated compared with December 2021. Labour force participation rebounds after falling in January In February, the participation rate for the core-aged population returned to the record high first observed in December 2021, rising 0.3 percentage points to 88.5%. The rate increased for both core-aged women (+0.3 percentage points to 84.7%) and core-aged men (+0.3 percentage points to 92.2%). The participation rate among core-aged Indigenous women also increased (+0.7 percentage points) in February to reach a record high of 79.3% (three-month moving average, not seasonally adjusted). Among youth aged 15 to 24, the participation rate increased for both young men (+1.4 percentage points to 64.7%) and young women (+1.1 percentage points to 66.2%) in February. The youth participation rate rose among several population groups, including Arab Canadians (+11.8 percentage points to 56.7%), Chinese Canadians (+3.0 percentage points to 45.8%) and non-visible minority youth (+1.9 percentage points to 64.1%), but fell among Black Canadian youth (-4.6 percentage points to 54.0%) (not seasonally adjusted). The participation rate was little changed for both men (42.3%) and women (31.4%) aged 55 and older in February. February employment gains widespread across industries Consistent with the relaxing of public health restrictions, employment rebounded in accommodation and food services (+114,000), information, culture and recreation (+73,000), and retail trade (+21,000). These three industries accounted for the majority (70.8%) of the net employment gains in the services-producing sector. Employment in the goods-producing sector also rose (+44,000) in February, marking the third consecutive monthly increase. The construction industry accounted for the majority of the increase, with employment up by 37,000. Employment in accommodation and food services rebounds to its December 2021 level Among the unemployed who became employed in accommodation and food services in February, nearly three-quarters (72.3%) had worked in the industry in the last 12 months. Chart 5: Compared with December 2021, employment is up in eight industries in February 2022 Employment in information, culture and recreation rises above pre-pandemic level for the first time Retail trade employment recovers from January losses Service sector employment gains not limited to industries subject to public health restrictions Employment rises for a third consecutive month in construction and surpasses its pre-pandemic level Employment increases in eight provinces For further information on key province and industry level labour market indicators, see "Labour Force Survey in brief: Interactive app." Employment growth in Ontario (+194,000; +2.6%) was led by the accommodation and food services and the information, culture and recreation industries. The unemployment rate fell 1.8 percentage points to 5.5% in February 2022, the lowest since February 2020. Employment in the Toronto census metropolitan area (CMA) increased by 116,000 (+3.3%). In Atlantic Canada, employment increased by 9,500 (+4.3%) in Newfoundland and Labrador, mostly in part-time work. The unemployment rate was little changed at 12.3% and remained the highest among the provinces. In the St. John's CMA, the unemployment rate was considerably lower (7.3%, three-month moving average) than in the rest of the province. Employment gains also occurred in Prince Edward Island (+3,300; +4.1%) and Nova Scotia (+3,700; +0.8%). Employment in Quebec increased by 82,000 (+1.9%) in February, with the largest gains in accommodation and food services; information, culture and recreation; and wholesale and retail trade. In the Montréal CMA, employment increased by 37,000 (+1.6%). The provincial unemployment rate fell 0.9 percentage points to 4.5%. In Saskatchewan, employment rose by 7,400 (+1.3%) in February, the fourth consecutive monthly increase. The unemployment rate fell 0.8 percentage points to 4.7%, the lowest since April 2015. Manitoba also saw employment growth (+6,400; +1.0%) and the unemployment rate was 4.8%. In British Columbia, employment rose by 21,000 (+0.8%) in February 2022, the first notable increase since October 2021, with the Vancouver CMA contributing the majority (18,000) of the growth. The unemployment rate in the province was 4.9%, the lowest since January 2020. Employment rate remains higher in Canada than in the United States A frequent point of comparison between Canada and the United States is the employment rate, defined as the number of people who are employed as a percentage of the working-age population, which is typically higher in Canada. Adjusted to US concepts, and for the population aged 16 and older, the employment rate was 62.3% in Canada and 59.9% in the United States in February 2022. The rate was little changed from February 2020 in Canada, compared with a decline of 1.3 percentage points in the United States. The unemployment rate, adjusted to US concepts, was 4.2% in Canada in February 2022, 0.4 percentage points higher than in the United States (3.8%). The rate was 0.5 percentage points lower than in February 2020 in Canada, while in the United States it was 0.3 percentage points higher. The labour force participation rate, also adjusted to US concepts, was 65.0% in Canada in February 2022, down 0.5 percentage points from February 2020. In the United States, the participation rate was 62.3%, a decrease of 1.1 percentage points from February 2020. Looking ahead: little sign of increased labour market churn as employers prepare for a return to the office As of the week of February 13 to 19, less than one-quarter (22.5%) of Canadians with a job or business reported that they usually work exclusively from home, while the majority (73.0%) reported that they work exclusively at locations other than home. Hybrid work became more prevalent in February, increasing 0.9 percentage points from January to 4.5%. In the professional, scientific and technical services industry, where hybrid work is most common, hybrid work increased to 8.7% and working exclusively from home declined 2.5 percentage points in February to 56.9% (not seasonally adjusted). As employers implement return-to-office plans, a number of factors might influence their ability to attract and retain employees, including tightening labour market conditions, with low unemployment and high job vacancies; concerns about consumer prices and affordability; and the desire of some workers to retain the flexibility and quality of employment associated with working from home. As of February 2022, there was little indication that concerns about work location, or other aspects of quality of employment, had led to an increase in the likelihood of workers voluntarily leaving a job or switching jobs. The number of core-aged job leavers (340,000), people who left a job voluntarily in the previous 12 months and remained not employed in the LFS reference week, was 13.4% (-53,000) lower than in February 2020 (not seasonally adjusted). This may be an indication that factors involved in voluntarily leaving a job, such as confidence in finding new employment or the ability to relocate, remain different from what they were before the pandemic. The number of core-aged job leavers trended down throughout 2020 and early 2021, and reached a record low of 217,000 in April 2021. Similarly, the job-changing rate—which measures the proportion of workers who remain employed from one month to the next but who change jobs between months—was 0.8% in January and 0.7% in February. This is comparable to the period from 2016 to 2019, when the job-changing rate averaged 0.7%, and ranged from 0.6% to 0.8%. Statistics Canada will continue to explore some of the reasons why Canadians may value their current job by exploring different facets of the quality of employment in the March and April LFS. The March LFS will include questions on the career prospects of employees, while the April LFS will consider some of the work-life balance challenges workers experience in their jobs. LFS results for the week of March 13 to 19 will be released on April 8, 2022. Note to readers The LFS estimates are based on a sample and are therefore subject to sampling variability. As a result, monthly estimates will show more variability than trends observed over longer time periods. For more information, see "Interpreting Monthly Changes in Employment from the Labour Force Survey ." This analysis focuses on differences between estimates that are statistically significant at the 68% confidence level. LFS estimates at the Canada level do not include the territories. The LFS estimates are the first in a series of labour market indicators released by Statistics Canada, which includes indicators from programs such as the Survey of Employment, Payrolls and Hours (SEPH); Employment Insurance Statistics; and the Job Vacancy and Wage Survey. For more information on the conceptual differences between employment measures from the LFS and those from the SEPH, refer to section 8 of the Guide to the Labour Force Survey (Catalogue number71-543-G). Since March 2020, all LFS face-to-face interviews have been replaced by telephone interviews conducted by interviewers working from their home to protect the health of both respondents and interviewers. While this has resulted in a decline in the LFS response rate, close to 47,000 interviews were completed in February and in-depth data quality evaluations conducted each month confirm that the LFS continues to produce an accurate portrait of Canada's labour market. The suspension of face-to-face interviewing has had a larger impact on response rates in Nunavut than in other jurisdictions. Due to the larger decline in response rates for Nunavut, and resulting changes in the composition of the responding sample, data for Nunavut (table 14-10-0292-01) should be used with caution. To reduce the risks associated with declining data quality for Nunavut, users are advised to use 12-month averages (available upon request) rather than 3-month averages when possible. Statistics Canada will continue to monitor the quality of LFS data for Nunavut each month and provide users with updated guidelines as required. The employment rate is the number of employed people as a percentage of the population aged 15 and older. The rate for a particular group (for example, youths aged 15 to 24) is the number employed in that group as a percentage of the population for that group. The unemployment rate is the number of unemployed people as a percentage of the labour force (employed and unemployed). The participation rate is the number of employed and unemployed people as a percentage of the population aged 15 and older. Full-time employment consists of persons who usually work 30 hours or more per week at their main or only job. Part-time employment consists of persons who usually work less than 30 hours per week at their main or only job. Total hours worked refers to the number of hours actually worked at the main job by the respondent during the reference week, including paid and unpaid hours. These hours reflect temporary decreases or increases in work hours (for example, hours lost due to illness, vacation, holidays or weather; or more hours worked due to overtime). In general, month-to-month or year-to-year changes in the number of people employed in an age group reflect the net effect of two factors: (1) the number of people who changed employment status between reference periods, and (2) the number of employed people who entered or left the age group (including through aging, death or migration) between reference periods. Supplementary indicators used in the February 2022 analysis Employed, worked less than half of their usual hours includes both employees and self-employed, where only employees were asked to provide a reason for the absence. This excludes reasons for absence such as 'vacation,' 'labour dispute,' 'maternity,' 'holiday,' and 'weather.' Also excludes those who were away all week. Not in labour force but wanted work includes persons who were neither employed, nor unemployed during the reference period and wanted work, but did not search for reasons such as 'waiting for recall (to former job),' 'waiting for replies from employers,' 'believes no work available (in area, or suited to skills),' 'long-term future start,' and 'other.' Unemployed, job searchers were without work, but had looked for work in the past four weeks ending with the reference period and were available for work. Unemployed, temporary layoff or future starts were on temporary layoff due to business conditions, with an expectation of recall, and were available for work; or were without work, but had a job to start within four weeks from the reference period and were available for work (don't need to have looked for work during the four weeks ending with the reference week). Labour underutilization rate (specific definition to measure the COVID-19 impact) combines all those who were unemployed with those who were not in the labour force but wanted a job and did not look for one; as well as those who remained employed but lost all or the majority of their usual work hours for reasons likely related to COVID-19 as a proportion of the potential labour force. Potential labour force (specific definition to measure the impact of COVID-19) includes people in the labour force (all employed and unemployed people), and people not in the labour force who wanted a job but didn't search for reasons such as 'waiting for recall (to former job),' 'waiting for replies from employers,' 'believes no work available (in area, or suited to skills),' 'long-term future start,' and 'other.' Seasonal adjustment The seasonally adjusted data for retail trade and wholesale trade industries presented here are not published in other public LFS tables. A seasonally adjusted series is published for the combined industry classification (wholesale and retail trade). Next release Products The product "Labour Force Survey in brief: Interactive app" (Catalogue number14200001) is also available. This interactive visualization application provides seasonally adjusted estimates by province, sex, age group and industry. The product "Labour Market Indicators, by province and census metropolitan area, seasonally adjusted" (Catalogue number71-607-X) is also available. This interactive dashboard provides customizable access to key labour market indicators. The product "Labour Market Indicators, by province, territory and economic region, unadjusted for seasonality " (Catalogue number71-607-X) is also available. This dynamic web application provides access to labour market indicators for Canada, province, territory and economic region. The product Labour Force Survey: Public Use Microdata File (Catalogue number71M0001X) is also available. This public use microdata file contains non-aggregated data for a wide variety of variables collected from the Labour Force Survey. The data have been modified to ensure that no individual or business is directly or indirectly identified. This product is for users who prefer to do their own analysis by focusing on specific subgroups in the population or by cross-classifying variables that are not in our catalogued products. Contact information Industry Intelligence Editor's Note: This press release omits select charts and/or marketing language for editorial clarity. Click here to view the full report.
Employment rebounds in February after January losses
Employment climbed 337,000 (+1.8%) in February, more than offsetting January losses.
The unemployment rate fell 1.0 percentage points to 5.5% in February 2022, lower than in February 2020 (5.7%).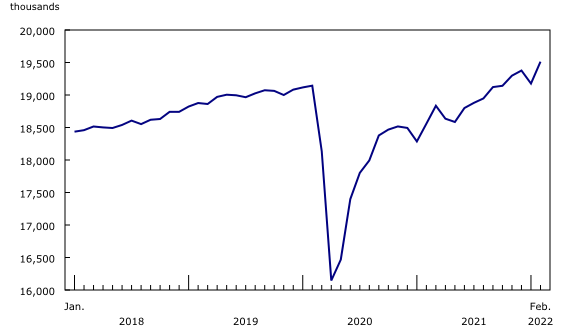
February employment growth was driven by strong gains in the number of private sector employees, which rebounded (+347,000; +2.8%) after dropping in January (-206,000; -1.6%). Public sector employment was little changed for a second consecutive month.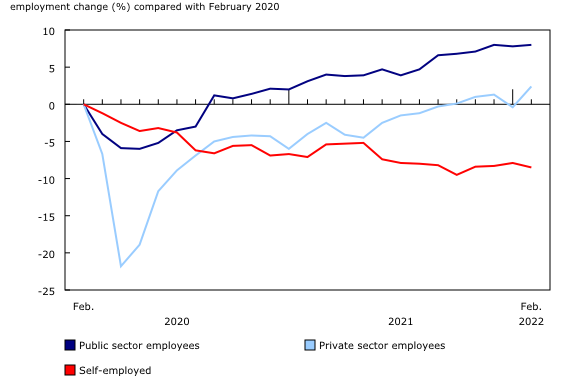
The overall employment rate, or the proportion of the population aged 15 and older who were employed, rose 1.0 percentage points to 61.8% in February, the first time it has returned to its pre-February 2020 level. Whereas employment recovered to its pre-pandemic level in September 2021, the employment rate, which is a reflection of both the level of employment and the size of the population, has been slower to recover.
The employment rate for the core working-age population (aged 25 to 54 years) climbed to 84.6% in February, with the employment rate of core-aged men (88.2%) increasing to the highest level since November 1981. Among core-aged women, whose employment rate has been increasing over several decades, the employment rate reached a new record high of 81.0%.
The employment rate among core-aged Indigenous men and women also reached record highs in February, with the rate for Indigenous men (78.6%) up 5.2 percentage points from February 2020 and the rate for Indigenous women (74.5%) up 3.7 percentage points over the same period (three-month moving averages, not seasonally adjusted). LFS information for Indigenous people reflects the experience of those who identify as First Nations people living off reserve, Métis, and Inuit, living in the provinces.
Among those aged 25 to 54, the February increase in the employment rate was similar for those belonging to groups designated as visible minorities (+0.9 percentage points to 80.7%) and those who are not a visible minority and not Indigenous (+1.1 percentage points to 85.7%).
Among youth aged 15 to 24, February employment gains for both young men (+67,000; +5.4%) and young women (+63,000; +5.1%) erased January losses. Among young women, the rebound was primarily among those aged 20 to 24.
For Canadians aged 55 and older, employment gains in February were entirely in part-time work (+73,000; +8.0%) and primarily in total employment among older women (+42,000; +2.3%). February 2022 growth returned employment among older women to its pre-pandemic February 2020 level for the first time since March 2021. However, as the population of women in this age group has grown over the past two years, their employment rate (29.9%) remained 1.1 percentage points lower than before the pandemic.
Over the last two years, working from home has been an important tool to help both workers and employers adapt to changing public health measures, such as those introduced in January to contain the spread of the Omicron variant. Of those who worked during the February LFS reference week, 37.2% worked most of their hours from home, down 5.8 percentage points from January, and more than half (53.8%) worked all of their hours at locations other than home, up 4.0 percentage points from January (not seasonally adjusted). In addition to the easing of public health restrictions, the proportion of people working from home in February may also have been impacted by employment increases in February in industries where working from home is more challenging, such as accommodation and food services, and retail trade.
Along with employment, total hours worked across all industries is a core indicator of the state of the labour market. Total hours worked can be influenced by a number of factors such as employment growth, compositional change in employment by industry and occupation, and changes in absences from work.
On a year-over-year basis, average hourly wages increased 3.1% (+$0.92) in February 2022. Since the fall of 2021, coinciding with strong employment growth, average hourly wages have been on an upward trend on a year-over-year basis, reaching 2.7% in December 2021 before falling back to 2.4% in January 2022.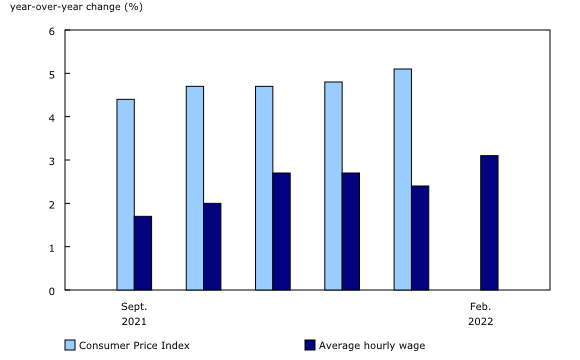
The unemployment rate fell 1.0 percentage points to 5.5% in February 2022, lower than in February 2020 (5.7%) and just above the record low of 5.4% observed in May 2019.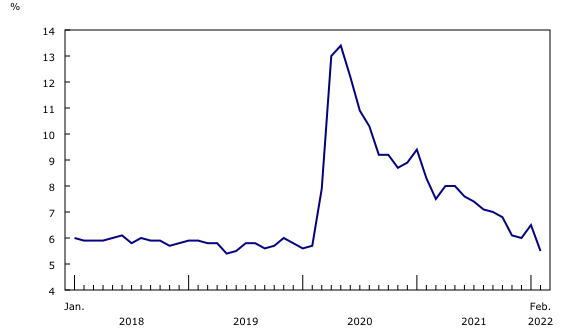
The unemployment rate fell in all major demographic groups in February. For the first time since the beginning of the pandemic, men and women in all major age groups had an unemployment rate at, or below, what it was before the pandemic in February 2020.
There were 1.14 million unemployed people in February, down 206,000 (-15.4%) from January. More than half of the decline in February was due to a decrease in the number of people who were on temporary layoff or who had arrangements to start a job in the near future (-123,000; -58.0%). This is the same group that drove the increase in unemployment in January, in the face of tightened public health restrictions. Among people who were on temporary layoff in January, nearly 7 in 10 became employed in February (67.8%, not seasonally adjusted). The number of job searchers also fell, down by 83,000 (-7.4%) in February.
The labour underutilization rate—the proportion of people in the potential labour force who are unemployed; want a job but have not looked for one; or are employed but working less than half of their usual hours—fell 3.8 percentage points to 12.1% in February, returning to its December 2021 level and to within the range observed through 2018 and 2019.
The share of the population aged 15 and older participating in the labour market increased by 0.4 percentage points to 65.4% in February, fully erasing the decline recorded in January. Excluding the January dip, the participation rate has hovered around its pre-COVID February 2020 level since September 2021.
The number of people working in the services-producing sector rose by 293,000 in February, more than recouping losses from January.
Employment rose by 114,000 (+12.6%) in accommodation and food services in February 2022, fully offsetting the losses experienced in January. However, employment in the industry remained 17.2% (-210,000) below its pre-pandemic February 2020 level. Ontario and Quebec accounted for the majority of the employment increase in February, as mandates prohibiting indoor dining were lifted in both provinces. According to the latest data from the Job Vacancy and Wage Survey, employers in this industry were actively recruiting for 142,300 vacancies as of December 2021.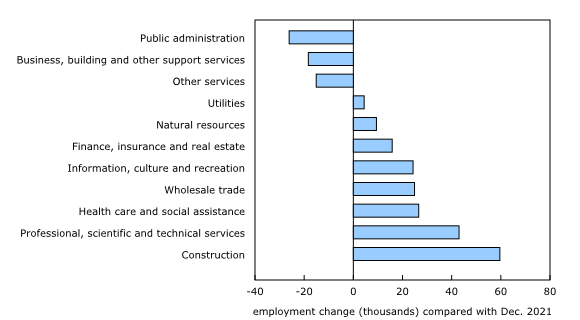
The number of people working in information, culture and recreation surpassed its pre-pandemic February 2020 level, rising by 73,000 (+9.9%) in February 2022. Much of the increase occurred in Ontario and Quebec, where gyms, fitness facilities, and other indoor spaces re-opened but were still subject to some capacity limits.
Retail trade employment rose by 21,000 (+0.9%) in February 2022, offsetting losses from the previous month. Store capacity limits in place in January had been lifted in many jurisdictions by the February LFS reference week. Youth accounted for most of the employment bump, after bearing the brunt of January layoffs in the industry.
February employment increases in the services-producing sector included industries which were relatively unaffected by the tightening of public health measures in January, including professional, scientific and technical services (+47,000; +2.8%); health care and social assistance (+16,000; +0.6%), and finance, insurance, real estate and leasing (+13,000; +1.0%).
Construction added 37,000 (+2.5%) workers in February 2022, surpassing its February 2020 employment level for the first time. Employment in the industry has increased by 95,000 workers in the last three months, following an acceleration in economic activity in the industry, as the value of building permits reached an all-time high during the fourth quarter of 2021.
The employment increase in February was widespread across the country. The largest proportional increases were in Newfoundland and Labrador (+4.3%; +9,500) and Prince Edward Island (+4.1%; +3,300). Both Ontario (+2.6%; +194,000) and Quebec (+1.9%; +82,000) recorded strong growth, followed by Saskatchewan (+1.3%; +7,400), Manitoba (+1.0%; +6,400), British Columbia (+0.8%; +21,000) and Nova Scotia (+0.8%; +3,700). There was little employment change in New Brunswick and Alberta.
While international comparisons of labour markets are challenging due to differences in concepts, survey design and reference periods, comparisons between the labour market situation in Canada and in the United States can be made by adjusting Canadian data to US concepts. For more information, see "Measuring Employment and Unemployment in Canada and the United States – A comparison."
In recent weeks, as concerns about the impact of the Omicron variant have eased, a number of employers have resumed or accelerated their plans for a return to the office. For some workers this will mean transitioning to working entirely at locations other than home, while for others it will involve following a hybrid model, meaning that they work some days or hours at home and some at other locations.
The Labour Force Survey (LFS) estimates for February are for the week of February 13 to 19, 2022.
Employed, worked zero hours includes employees and self-employed who were absent from work all week, but excludes people who have been away for reasons such as 'vacation,' 'maternity,' 'seasonal business,' and 'labour dispute.'
Unless otherwise stated, this release presents seasonally adjusted estimates, which facilitate comparisons by removing the effects of seasonal variations. For more information on seasonal adjustment, see Seasonally adjusted data – Frequently asked questions.
The next release of the LFS will be on April 8, 2022. March data will reflect labour market conditions during the week of March 13 to 19, 2022.
More information about the concepts and use of the Labour Force Survey is available online in the Guide to the Labour Force Survey (Catalogue number71-543-G).
For more information, or to enquire about the concepts, methods or data quality of this release, contact us (toll-free 1-800-263-1136; 514-283-8300; infostats@statcan.gc.ca) or Media Relations (statcan.mediahotline-ligneinfomedias.statcan@statcan.gc.ca).
* All content is copyrighted by Industry Intelligence, or the original respective author or source. You may not recirculate, redistrubte or publish the analysis and presentation included in the service without Industry Intelligence's prior written consent. Please review our terms of use.
