North American transborder freight in January up 20.6% year-over-year to US$113.7B, with trucks moving US$69B of freight, up 12.9%, and railways moving $15.5B, up 11.8%; US-Canada freight went up 24.1% and US-Mexico up by 17.3%: US Dept. of Transportation

Sample article from our Logistic & Supply Chain

March 24, 2022 (press release) –

Trucking carries more than 60% of all January 2022 transborder trade value

Transborder freight between the U.S. and North American countries (Canada and Mexico) in January 2022:

  • Total transborder freight: $113.7 billion of transborder freight moved by all modes of transportation, up 20.6% compared to January 2021. January 2022 transborder freight was up 17.1% compared to $97.1 billion in January 2020.
  • Freight between the U.S. and Canada totaled $56.8B. Freight between the U.S. and Mexico totaled $56.9B.
  • Trucks moved $69.0 billion of freight, up 12.9% compared to January 2021.
  • Railways moved $15.5 billion of freight, up 11.8% compared to January 2021.


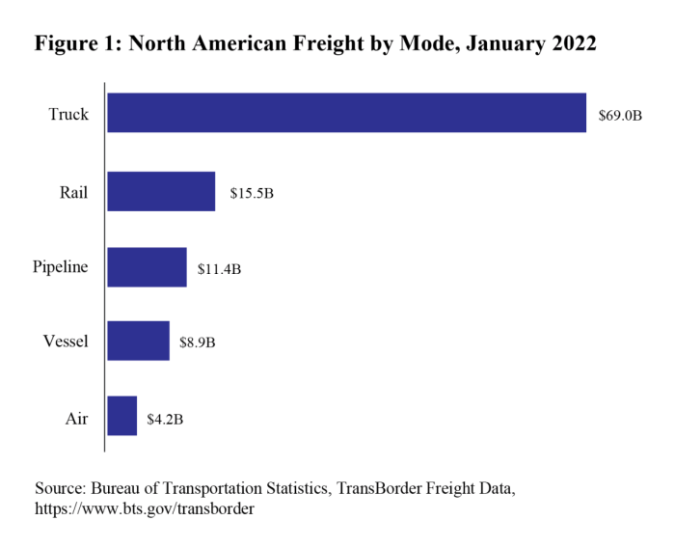
Total Transborder Freight by Border Compared to January 2021:

  • U.S.-Canada up 24.1%
  • U.S.-Mexico up 17.3%


Total Transborder Freight by Border and Mode:

U.S.-Canada (both directions)
(Dollars in Billions)
Truck:              $29.3
Rail:                 $8.4
Pipeline:           $10.6
Air:                   $2.7
Vessel:             $2.7   

U.S.-Mexico (both directions)
(Dollars in Billions)
Truck:              $39.7
Rail:                 $7.1
Vessel:             $6.2   
Air:                   $1.5
Pipeline:           $0.8               


Total Transborder Freight by Border and Commodity:

U.S.-Canada (both directions)
(Dollars in Billions)
Mineral fuels:                $14.2
Vehicles (not rail):         $5.9
Computers and parts:  $5.2   

U.S.-Mexico (both directions)
(Dollars in Billions)
Electrical machinery:           $9.7
Vehicles (not rail):                $9.7
Computers and parts:        $9.2   


Truck Freight: $69.0 billion (60.6% of all transborder freight)

  • U.S.-Canada: $29.3 billion (51.5% of all northern border freight)
  • U.S.-Mexico: $39.7 billion (69.7% of all southern border freight)


  • Top three busiest truck border ports (44.4% of total transborder truck freight)
    • Laredo, TX                                    $16.9 billion
    • Detroit, MI                                      $8.5 billion
    • Ysleta, TX                                        $5.3 billion


  • Top three truck commodities (46.0% of total transborder truck freight)
    • Computers and parts                      $12.6 billion
    • Electrical machinery                     $10.8 billion
    • Vehicles and parts                            $8.4 billion


Rail Freight: $15.5 billion (13.6% of all transborder freight)

  • U.S.-Canada: $8.4 billion (14.8% of all northern border freight)
  • U.S.-Mexico: $7.1 billion (12.5% of all southern border freight)


  • Top three busiest rail border ports (49.1% of total transborder rail freight)
    • Laredo, TX                                        $3.6 billion
    • Eagle Pass, TX                                    $2.0 billion
    • Detroit, MI                                          $2.0 billion


  • Top three rail commodities (52.3% of total transborder rail freight)
    • Vehicles and parts                             $5.6 billion
    • Plastics                                                $1.3 billion
    • Mineral fuels                                       $1.2 billion


Reporting Notes

Data in this Bureau of Transportation Statistics release are not seasonally adjusted and are not adjusted for inflation. For previous statistical releases and summary tables, see transborder releases. See transborder freight data for data from previous months, and for additional state, port, and commodity data. BTS has scheduled the release of February transborder numbers for April 19, 2022.
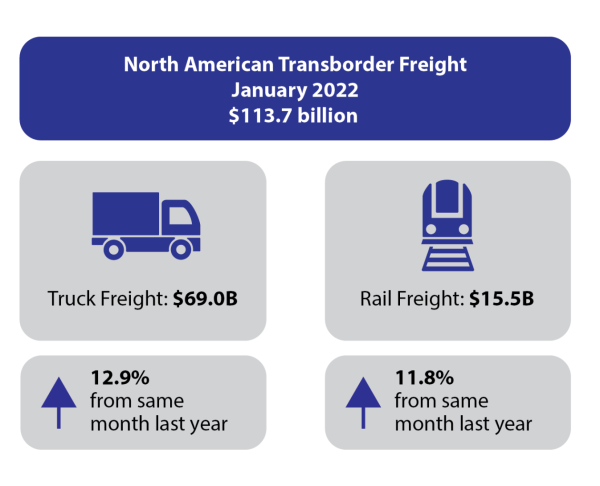


* All content is copyrighted by Industry Intelligence, or the original respective author or source. You may not recirculate, redistrubte or publish the analysis and presentation included in the service without Industry Intelligence's prior written consent. Please review our terms of use.

More from our Logistic & Supply Chain Coverage
See our dashboard in action - schedule an demo
Chelsey Quick
Chelsey Quick
- VP Client Success -

We offer built-to-order logistic & supply chain coverage for our clients. Contact us for a free consultation.

About Us

We deliver market news & information relevant to your business.

We monitor all your market drivers.

We aggregate, curate, filter and map your specific needs.

We deliver the right information to the right person at the right time.

Our Contacts

1990 S Bundy Dr. Suite #380,
Los Angeles, CA 90025

+1 (310) 553 0008

About Cookies On This Site

We collect data, including through use of cookies and similar technology ("cookies") that enchance the online experience. By clicking "I agree", you agree to our cookies, agree to bound by our Terms of Use, and acknowledge our Privacy Policy. For more information on our data practices and how to exercise your privacy rights, please see our Privacy Policy.