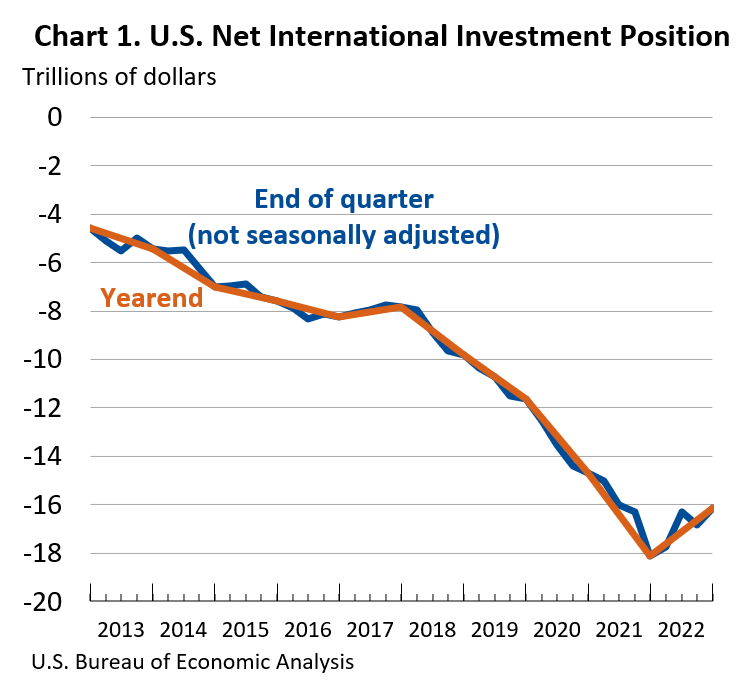
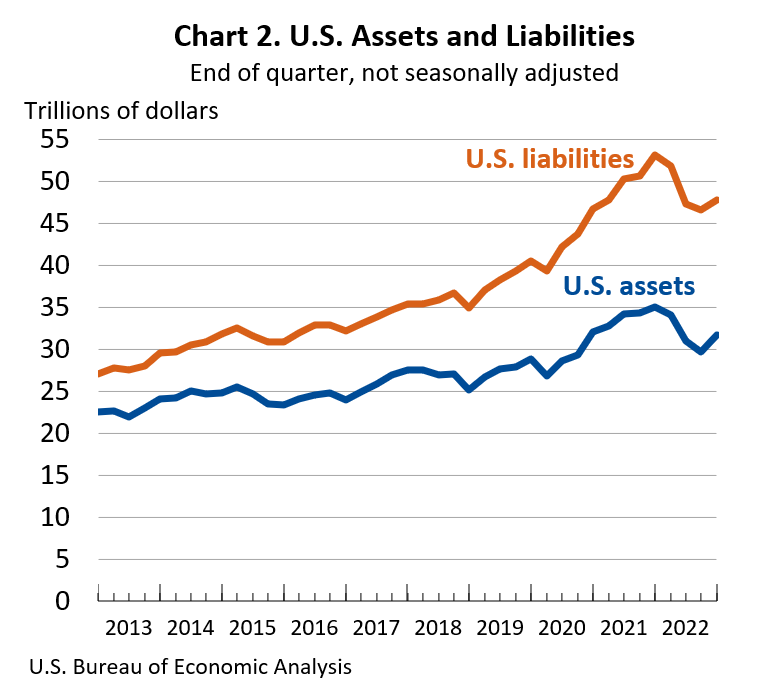
The U.S. net international investment position, the difference between U.S. residents’ foreign financial assets and liabilities, was –$16.12 trillion at the end of the fourth quarter of 2022, according to statistics released today by the U.S. Bureau of Economic Analysis. Assets totaled $31.68 trillion, and liabilities were $47.80 trillion. At the end of the third quarter, the net investment position was –$16.84 trillion (revised). The net investment position and components of assets and liabilities are presented in table 1 XLSX.
The $719.0 billion change in the net investment position from the third quarter to the fourth quarter came from net financial transactions of –$162.9 billion and net other changes in position, such as price and exchange-rate changes, of $881.9 billion. Net other changes mostly reflected global stock price increases and the appreciation of major foreign currencies against the U.S. dollar that raised the market value of U.S. assets more than U.S. liabilities, in dollar terms (table A).
Table A. Quarterly Change in the U.S. Net International Investment Position
[Billions of dollars, not seasonally adjusted]
| |
End of quarter position,
2022:Q3 |
Change in position in 2022:Q4 |
End of quarter position,
2022:Q4 |
| Total |
Attributable to: |
Financial
transactions |
Other changes
in position 1 |
| U.S. net international investment position |
–16,836.0 |
719.0 |
–162.9 |
881.9 |
–16,117.1 |
| Net position excluding financial derivatives |
–16,954.4 |
767.9 |
–156.0 |
923.9 |
–16,186.6 |
| Financial derivatives other than reserves, net |
118.4 |
–48.9 |
–6.9 |
–42.0 |
69.5 |
| U.S. assets |
29,729.9 |
1,950.2 |
(2) |
(2) |
31,680.1 |
| Assets excluding financial derivatives |
26,903.0 |
2,233.8 |
–302.6 |
2,536.4 |
29,136.8 |
| Financial derivatives other than reserves |
2,826.9 |
–283.6 |
(2) |
(2) |
2,543.3 |
| U.S. liabilities |
46,566.0 |
1,231.2 |
(2) |
(2) |
47,797.2 |
| Liabilities excluding financial derivatives |
43,857.4 |
1,465.9 |
–146.6 |
1,612.6 |
45,323.4 |
| Financial derivatives other than reserves |
2,708.5 |
–234.7 |
(2) |
(2) |
2,473.8 |
| 1. Disaggregation of other changes in position into price changes, exchange-rate changes, and other changes in volume and valuation is presented for annual statistics (see table C and table 2 in this release). 2. Financial transactions and other changes in financial derivatives positions are available on a net basis; they are not separately available for U.S. assets and U.S. liabilities. U.S. Bureau of Economic Analysis |
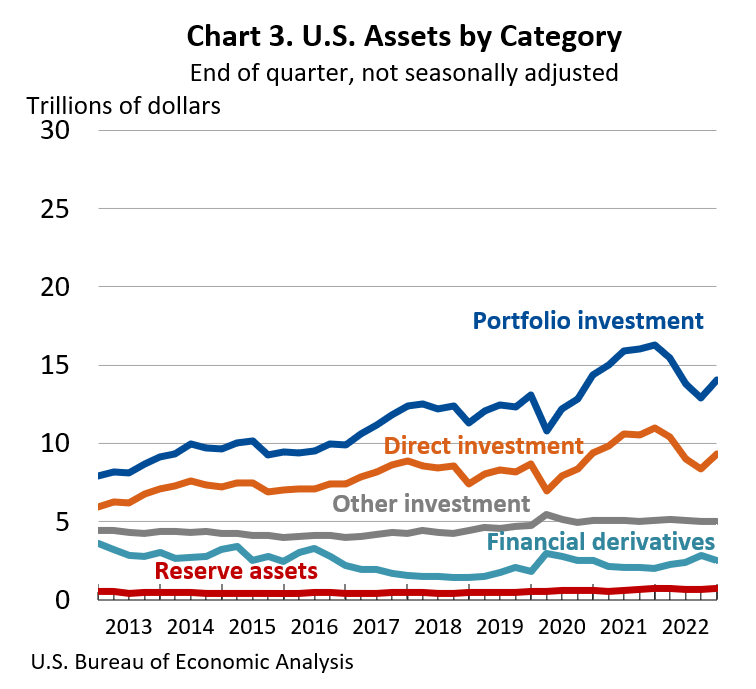
U.S. assets increased by $1.95 trillion to a total of $31.68 trillion at the end of the fourth quarter, reflecting increases in portfolio investment and direct investment assets that were partly offset by a decrease in financial derivatives.
Portfolio investment assets increased by $1.18 trillion to $14.07 trillion, and direct investment assets increased by $964.9 billion to $9.32 trillion, driven mainly by foreign stock price increases and by the appreciation of major foreign currencies against the U.S. dollar that raised the market value of these assets in dollar terms. Financial derivatives decreased by $283.6 billion to $2.54 trillion, driven mostly by decreases in foreign exchange contracts.
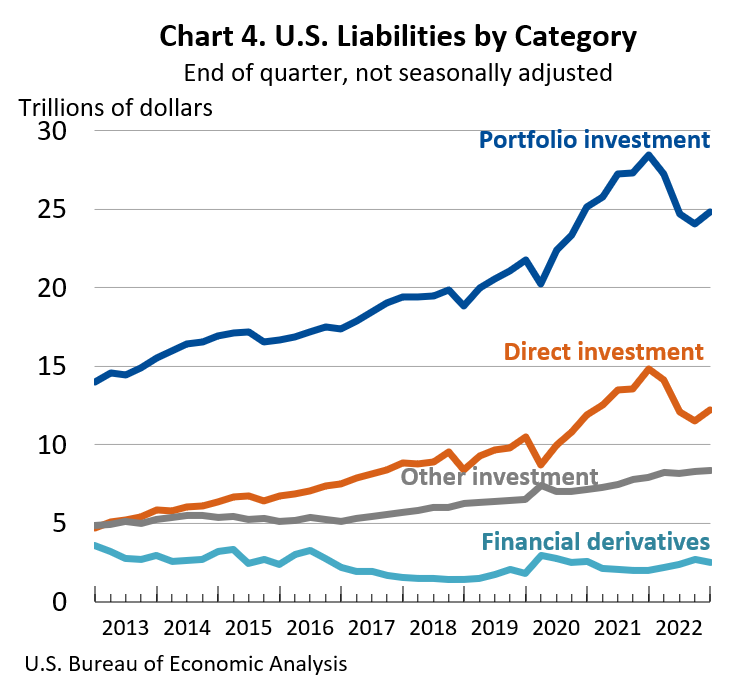
U.S. liabilities increased by $1.23 trillion to a total of $47.80 trillion at the end of the fourth quarter, reflecting increases in portfolio investment and direct investment liabilities that were partly offset by a decrease in financial derivatives.
Portfolio investment liabilities increased by $759.5 billion to $24.82 trillion, and direct investment liabilities increased by $662.9 billion to $12.19 trillion, driven mainly by U.S. stock price increases that raised the market value of these liabilities. Financial derivatives decreased by $234.7 billion to $2.47 trillion, driven mostly by decreases in foreign exchange contracts.
| Table B. Updates to Third-Quarter 2022 International Investment Position Aggregates [Trillions of dollars, not seasonally adjusted] |
| |
Preliminary estimates |
Revised estimates |
| U.S. net international investment position |
–16.71 |
–16.84 |
| U.S. assets |
29.73 |
29.73 |
| U.S. liabilities |
46.44 |
46.57 |
| U.S. Bureau of Economic Analysis |
Year 2022
The U.S. net international investment position was –$16.12 trillion at the end of 2022, compared to –$18.12 trillion at the end of 2021. The net investment position and components of assets and liabilities are presented in table 2 XLSX.
The $2.01 trillion change in the net investment position from the end of 2021 to the end of 2022 came from net financial transactions of –$677.1 billion and net other changes in position, such as price and exchange-rate changes, of $2.68 trillion (table C).
Price changes of $4.12 trillion mostly reflected U.S. stock and bond price decreases that exceeded foreign stock and bond price decreases, which lowered the market value of U.S. liabilities more than the market value of U.S. assets. Exchange-rate changes of –$1.16 trillion reflected the depreciation of major foreign currencies against the U.S. dollar, which lowered the value of foreign-currency-denominated U.S. assets in dollar terms.
Changes in volume and valuation n.i.e. (not included elsewhere) of –$411.4 billion mostly reflected a series break in portfolio investment that resulted from data revisions by respondents on the monthly Treasury International Capital SLT report for June 2022.
The revised position data for June and for prior periods will be incorporated into the international investment position statistics as part of the annual update in June 2023.
U.S. assets decreased by $3.39 trillion to a total of $31.68 trillion at the end of 2022, mostly reflecting decreases in portfolio investment and direct investment assets that were partly offset by an increase in financial derivatives.
Portfolio investment assets decreased by $2.24 trillion to $14.07 trillion, and direct investment assets decreased by $1.65 trillion to $9.32 trillion, driven mainly by foreign stock price decreases and by the depreciation of major foreign currencies against the U.S. dollar that lowered the market value of these assets in dollar terms. Foreign bond price decreases also contributed to the decrease in portfolio investment assets.
The impact of foreign stock and bond price decreases and foreign currency depreciation was partly offset by financial transactions, mostly increases in direct investment equity assets and U.S. purchases of foreign equity and long-term debt securities.
Financial derivatives increased $555.9 billion to $2.54 trillion, driven by increases in single-currency interest rate contracts and foreign exchange contracts.
Table C. Annual Change in the U.S. Net International Investment Position
[Billions of dollars ]
| |
Yearend position,
2021 |
Change in position in 2022 |
Yearend position,
2022 |
| Total |
Attributable to: |
Financial
transactions |
Other changes in position |
| Total |
Price
changes |
Exchange-
rate
changes |
Changes
in volume
and
valuation
n.i.e. |
| U.S. net investment position |
–18,124.3 |
2,007.2 |
–677.1 |
2,684.3 |
(1) |
(1) |
(1) |
–16,117.1 |
| Net position excl. derivatives |
–18,144.2 |
1,957.6 |
–596.0 |
2,553.6 |
4,120.7 |
–1,155.7 |
–411.4 |
–16,186.6 |
| Financial derivatives, net |
19.9 |
49.6 |
–81.0 |
130.7 |
(1) |
(1) |
(1) |
69.5 |
| U.S. assets |
35,065.5 |
–3,385.3 |
(2) |
(2) |
(2) |
(2) |
(2) |
31,680.1 |
| Assets excl. derivatives |
33,078.0 |
–3,941.2 |
919.8 |
–4,861.0 |
–3,501.6 |
–1,261.6 |
–97.8 |
29,136.8 |
| Financial derivatives |
1,987.5 |
555.9 |
(2) |
(2) |
(2) |
(2) |
(2) |
2,543.3 |
| U.S. liabilities |
53,189.7 |
–5,392.5 |
(2) |
(2) |
(2) |
(2) |
(2) |
47,797.2 |
| Liabilities excl. derivatives |
51,222.1 |
–5,898.8 |
1,515.8 |
–7,414.6 |
–7,622.3 |
–105.9 |
313.6 |
45,323.4 |
| Financial derivatives |
1,967.6 |
506.2 |
(2) |
(2) |
(2) |
(2) |
(2) |
2,473.8 |
| 1. Data are not separately available for price changes, exchange-rate changes, and changes in volume and valuation n.i.e. (not included elsewhere). 2. Financial transactions and other changes in financial derivatives positions are available on a net basis; they are not separately available for U.S. assets and U.S. liabilities. U.S. Bureau of Economic Analysis |
U.S. liabilities decreased by $5.39 trillion to a total of $47.80 trillion at the end of 2022, reflecting decreases in portfolio investment and direct investment liabilities that were partly offset by increases in financial derivatives and other investment liabilities.
Portfolio investment liabilities decreased by $3.66 trillion to $24.82 trillion, and direct investment liabilities decreased by $2.63 trillion to $12.19 trillion, driven mainly by U.S. stock price decreases that lowered the market value of these liabilities. U.S. bond price decreases also contributed to the decrease in portfolio investment liabilities.
The impact of U.S. stock and bond price decreases was partly offset by financial transactions, mostly foreign purchases of U.S. long-term debt securities and increases in direct investment equity liabilities.
Financial derivatives increased $506.2 billion to $2.47 trillion, driven by increases in single-currency interest rate contracts and foreign exchange contracts. Other investment liabilities increased $390.5 billion to $8.32 trillion, reflecting increased U.S. borrowing in the form of loans and deposits.
Next release: June 28, 2023, at 8:30 a.m. EDT
U.S. International Investment Position, 1st Quarter 2023 and Annual Update


