OTTAWA
,
October 28, 2022
(press release)
–
Real gross domestic product (GDP) edged up 0.1% in August, following a slight (+0.1%) increase in July. Growth in services-producing industries (+0.3%) was partially offset by a decline in goods-producing industries (-0.3%), as 14 of 20 industrial sectors increased in August. Chart 1: Real gross domestic product edges up in August Advance information indicates that real GDP increased 0.1% in September. Increases in the oil and gas extraction subsector, the manufacturing sector and the public sector were partially offset by declines in construction. Advance information for the third quarter indicates that real GDP increased 0.4%. Owing to their preliminary nature, these estimates will be updated on November 29 with the release of the official GDP data for September and the third quarter. Services-producing industries recapture momentum, while output of goods contracts Retail activity rebounds Sales at gasoline stations increased 6.9%, following three consecutive monthly declines. Gasoline prices fell 9.6% on a monthly basis in August, stemming mainly from higher global production by oil-producing countries. Food and beverage stores rose 1.3% in August, following two consecutive monthly declines. Broad-based growth was observed across three of the four store types in the subsector, with the supermarkets and other grocery (except convenience) stores along with beer, wine and liquor stores contributing the most to the subsector's growth. Sporting goods, hobby, book and music stores grew 5.4%, reaching their highest level of output since June 2021. The growth was mainly attributable to sustained strength in sales of sporting equipment, in part due to many team sporting leagues resuming full capacity activities over the summer. Wholesale trade grows following pull back Machinery, equipment and supplies wholesaling (+1.9%) contributed the most to the growth in August as three of four industries were up. Other machinery, equipment and supplies led the growth, as import levels have been elevated since the beginning of the year in support of the construction of a new liquefied natural gas terminal in British Columbia. Building material and supplies merchant wholesalers recorded a notable increase, rising 2.6% in August. The increase in August largely offset a significant contraction in July. Decreases in the farm product (-9.4%) and personal and household goods (-1.2%) merchant wholesalers subsectors tempered the overall growth in the wholesale trade sector. Public sector growth continues Public administration (+0.5%) contributed the most to the growth in August as most subsectors were up. Leading the growth was the federal government subsector (+0.8%), up for the seventh time in eight months. Agriculture grows, led by crop production Construction activity slows again on broad-based declines Similar to July, engineering and other construction activities (-0.9%) was the main driver behind the sector's decline in August, contracting for a second month in a row. Residential building construction was down for the fourth time in five months, contracting 0.7% in August, in large part due to lower activity in new construction of single-detached homes, row units and apartments. Nevertheless, the level of activity in August was more than 8% above the February 2020 pre-COVID-19 pandemic level, although it has fallen nearly 14% below the peak recorded in April 2021. Non-residential building construction decreased 0.5% in August, the third decrease in four months. Lower activity in new construction of commercial and public buildings more than offset an increase in new construction of industrial buildings. Repair construction (-0.4%) contracted for the third time in five months, as both residential and non-residential repair activities were down. Manufacturing continues to contract, led by decline in durable goods industries Durable goods manufacturing fell 1.4% in August, the largest decrease since September 2021 with 7 of 10 subsectors contracting. Miscellaneous manufacturing (-9.0%) posted a large decline, more than offsetting an increase recorded in July. Wood product manufacturing (-2.5%) and non-metallic mineral product manufacturing (-3.9%) also posted large declines. The price of softwood lumber fell 7.5% in August, continuing the downward trend that started in April as reduced North American housing market activity has put downward pressure on lumber prices. Non-durable goods manufacturing edged down 0.2% in August, as six of nine subsectors declined. Contributing the most to the decrease were paper (-4.1%), plastics and rubber products (-1.6%), and petroleum and coal products (-0.9%) manufacturing. Meanwhile, food product manufacturing (+1.5%), along with beverage and tobacco manufacturing (+2.4%), partially offset these declines. Mining, quarrying and oil and gas extraction is disrupted by maintenance activity Chart 2: Mining, quarrying, and oil and gas extraction decreases in August Oil and gas extraction contracted 2.0% in August, led by a decrease in oil sands extraction, following a large gain in July. Oil sands extraction decreased 2.9% in August as lower synthetic oil production in Alberta contributed the most to the decline. Production was interrupted by the commencement of maintenance activity at a synthetic crude upgrader. Oil and gas extraction (except oil sands) declined 0.8%, as both crude petroleum extraction and natural gas extraction decreased. Lower crude oil exports to the United States contributed to the decrease. Meanwhile, natural gas production and pipeline transportation were also down as export oriented pipeline maintenance constrained pipeline capacity in August, which in part led Canadian producers to curtail production in response. Support activities for mining, and oil and gas extraction grew 3.3% in August, mainly as a result of increased drilling activity. The mining and quarrying (except oil and gas) subsector contracted 0.8% in August as a result of a decrease in metal-ore mining. All metal-ore mining industries decreased, with the largest decline posted in copper, nickel, lead and zinc ore mining (-4.6%). Utilities rise Chart 3: Main industrial sectors' contribution to the percent change in gross domestic product in August Note to readers For the period starting in January 2019, data are derived by chaining a fixed-weight Laspeyres volume index to the previous period. The fixed weights are 2018 industry prices. This approach makes the monthly GDP by industry data more comparable with expenditure-based GDP data, which are chained quarterly. All data in this release are seasonally adjusted. For information on seasonal adjustment, see Seasonally adjusted data – Frequently asked questions. An advance estimate of industrial production for September 2022 is available upon request. For more information on GDP, see the video "What is Gross Domestic Product (GDP)?" Revisions Each month, newly available administrative and survey data from various industries in the economy are integrated, resulting in statistical revisions. Updated and revised administrative data (including taxation statistics), new information provided by respondents to industry surveys, data confrontation and reconciliation process and standard changes to seasonal adjustment calculations are incorporated with each release. Real-time table Next release Products The Methodological Guide: Canadian System of Macroeconomic Accounts (Catalogue number13-607-X) is also available. The Economic accounts statistics portal, accessible from the Subjects module of the Statistics Canada website, features an up-to-date portrait of national and provincial economies and their structure. Contact information Industry Intelligence Editor's Note: This press release omits select charts and/or marketing language for editorial clarity. Click here to view the full report.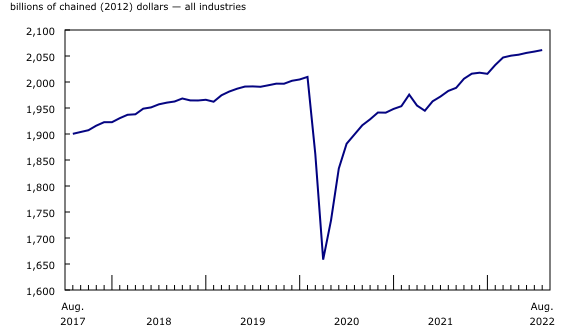
Services-producing industries regained momentum in August following the first contraction in six months in July. Meanwhile, goods-producing industries were down, led by declines in manufacturing, oil and gas extraction, and construction activity.
The retail trade sector rose 1.2% in August, as 10 of 12 subsectors increased. This was a notable rebound from July when output fell back to its December 2021 level.
Wholesale trade grew 0.9% in August, up for the second time in seven months, as five of nine subsectors increased.
The public sector (educational services, health care and social assistance, and public administration combined) expanded 0.3% in August, the fourth consecutive monthly increase, as all sectors were up.
The agriculture, forestry, fishing and hunting sector rose 3.9% in August, led by an increase in crop production. Crop production (except cannabis) expanded 7.4%, driven mainly by an increase in volumes of wheat and other grains as better growing conditions in Western Canada led to higher than expected yields.
The construction sector contracted for the fifth consecutive month, down 0.7% in August as all subsectors recorded decreases.
The manufacturing sector contracted 0.8% in August, the fourth decline in five months and the lowest output level since January 2022.
The mining, quarrying and oil and gas extraction sector contracted 1.0% in August, following a significant gain recorded the previous month.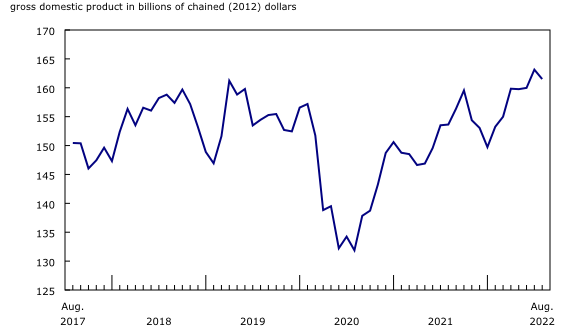
Utilities rose 1.5% in August, led by an increase in electric power generation, transmission and distribution (+1.6%), while natural gas distribution increased 2.1%, led by industrial sales.
Monthly data on gross domestic product (GDP) by industry at basic prices are chained volume estimates with 2012 as the reference year. This means that the data for each industry and each aggregate are obtained from a chained volume index multiplied by the industry's value added in 2012. The monthly data are benchmarked to annually chained Fisher volume indexes of GDP obtained from the constant-price supply and use tables (SUTs) up to the latest SUT year (2018).
With this release of monthly GDP by industry, revisions have been made back to January 2021.
Real-time table 36-10-0491-01 will be updated on November 7.
Data on GDP by industry for September will be released on November 29.
The User Guide: Canadian System of Macroeconomic Accounts (Catalogue number13-606-G) is available.
For more information, or to enquire about the concepts, methods or data quality of this release, contact us (toll-free 1-800-263-1136; 514-283-8300; infostats@statcan.gc.ca) or Media Relations (statcan.mediahotline-ligneinfomedias.statcan@statcan.gc.ca).
* All content is copyrighted by Industry Intelligence, or the original respective author or source. You may not recirculate, redistrubte or publish the analysis and presentation included in the service without Industry Intelligence's prior written consent. Please review our terms of use.


