OTTAWA
,
February 24, 2022
(press release)
–
The number of employees receiving pay or benefits from their employer—measured by the Survey of Employment, Payrolls and Hours (SEPH) as payroll employment—rose by 122,200 (+0.7%) in December, the seventh consecutive monthly increase. The gains in December brought payroll employment above its pre-pandemic level for the first time, surpassing the February 2020 level by 60,400 (+0.4%). The widespread emergence of the Omicron variant, and associated adjustments to public health measures, occurred later in December and were not observed in December payroll employment. Chart 1: Payroll employment increases for the seventh consecutive month in December Payroll employment increases in nine provinces, driven by the services-producing sector December payroll employment gains were concentrated in the services-producing sector (+108,100; +0.8%), with the largest increases in health care and social assistance (+25,600; +1.2%) and educational services (+23,100; +1.7%). Although payroll employment in the services-producing sector had surpassed pre-pandemic levels in December, not all sectors within the group have recovered at the same pace. In December, health care and social assistance (+121,800; +5.9%) was furthest above pre-COVID employment, while accommodation and food services (-170,500; -12.7%) was furthest below. In the goods-producing sector, payroll employment rose by 9,200 (+0.3%) in December, driven by gains in construction (+6,400; +0.6%). All goods-producing sectors had either returned to or surpassed their pre-COVID level, with the exception of manufacturing (-19,200; -1.2%). Chart 2: In December, health care and social assistance sector furthest above pre-COVID payroll employment Gains in health care and social assistance driven by employment growth in hospitals Outpatient care centres (+47,500; +43.6%), which includes mental health and substance abuse centres, was the industry furthest above its February 2020 payroll employment level in December. The Survey on COVID-19 and Mental Health indicated that there was a 4% increase in Canadians screening positive for symptoms of depression, anxiety or posttraumatic stress disorder in the spring of 2021 compared with the fall of 2020, potentially increasing the demand for mental health specialists during the pandemic. In contrast, in December, community care facilities for the elderly (-9,700; -7.0%) was the health care industry furthest below its pre-COVID employment level. Quebec (+14,500; +2.8%) and Ontario (+7,000; +0.9%) reported the largest payroll employment increases in December, bringing health care and social assistance to 5.9% above its February 2020 employment level. Quebec (+52,600; +10.8%) and British Columbia (+22,100; +7.7%) were furthest above their pre-COVID level, while Prince Edward Island was the lone province yet to recover to its pre-pandemic employment level in the sector (-400; -4.3%). Payroll employment in educational services surpasses pre-COVID level for the first time Nationally, elementary and secondary schools (+8,000; +1.0%) recorded the largest monthly payroll employment increase in December and was the industry furthest above its pre-COVID level (+12,100; +1.5%). Despite a 4.9% monthly payroll employment increase, community colleges and CEGEPs (-2,900; -2.2%) remained below its February 2020 level, as did other schools and instruction (-7,100; -8.9%), such as those primarily engaged in fine arts, athletics and sports, languages, and other types of training. Ontario leads payroll employment increase in finance and insurance In December, payroll employment in the finance and insurance sector was 30,200 (+4.0%) above its pre-COVID level. Payroll employment exceeded pre-pandemic levels in most industries in the sector. For instance, payroll employment in insurance carriers was 8,100 (+5.8%) higher than in February 2020. Average weekly earnings little changed in December, up 1.7% on a year-over-year basis Average weekly hours worked were up 0.6% from November to 33.6 hours in December 2021. Hourly paid employees worked on average 31.4 hours per week, while salaried employees worked 37.1 hours per week on average. Compared with February 2020, the average weekly hours for hourly paid employees were up 2.4%, while salaried employees' average weekly hours rose 0.7%. Job vacancies remain at elevated levels The increase in the total number of vacancies in December was led by the health care and social assistance and accommodation and food services sectors. In both construction and manufacturing, the number of vacancies fell in the month. The job vacancy rate, which measures the number of vacant positions as a proportion of all positions (vacant and filled), was 5.2% in December. In other words, for every 100 positions in December, employers were seeking to fill an average of 5.2 vacancies, up from 3.0 in the fourth quarter of 2019. This increase in vacancies occurred in the context of falling unemployment, as the Labour Force Survey unemployment rate (unadjusted for seasonality) was 5.4% in December 2021, the lowest since December 2019 (5.2%). Record high job vacancies in health care and social assistance Job vacancies increase in accommodation and food services Job vacancies down in construction and manufacturing, and virtually unchanged in retail trade In manufacturing, there were 73,900 vacant positions in December, down 9.7% (-7,900) from the previous month, but up 75.2% (+31,700) compared with the fourth quarter of 2019. There were 103,300 job vacancies in retail trade in December, virtually unchanged compared with November but 52.1% (+35,400) higher than in the fourth quarter of 2019. Job vacancies fall in transportation and warehousing Job vacancies increase in five provinces In both Quebec (242,600) and British Columbia (154,700), the number of job vacancies exceeded the number of unemployed persons (199,100 and 139,400, respectively). Looking ahead January 2022 data for SEPH and JVWS will be released on March 29, 2022, while JVWS data for the fourth quarter of 2021 will be released on March 22, 2022. Note to readers The key objective of the Survey of Employment, Payrolls and Hours (SEPH) is to provide a monthly portrait of the level of earnings, employment and hours worked, by detailed industry, at the national, provincial and territorial levels. Payroll employment, as measured by the SEPH, refers to the number of employees receiving pay or benefits (employment income) during a given month. The survey excludes the self-employed, owners and partners of unincorporated businesses and professional practices, and employees in the agricultural sector. SEPH estimates are produced by integrating information from three sources: a census of approximately 1 million payroll deduction records provided by the Canada Revenue Agency; the Business Payrolls Survey, which collects data from a sample of 15,000 establishments; and administrative records of federal, provincial and territorial public administration employment, provided by these levels of government. Estimates of average weekly earnings and hours worked are based on a sample and are therefore subject to sampling variability. This analysis focuses on differences between estimates that are statistically significant at the 68% confidence level. Payroll employment estimates are based on a census of administrative records and are not subject to sampling variability. With each release of SEPH data, data for the preceding month are revised. Users are encouraged to use the most up-to-date data available for each month. Statistics Canada also produces employment estimates from its Labour Force Survey (LFS). The LFS is a monthly household survey, the main objective of which is to divide the working-age population into three mutually exclusive groups: the employed (including the self-employed), the unemployed and those not in the labour force. This survey is the official source for the unemployment rate, and it collects data on the sociodemographic characteristics of all those in the labour market. As a result of conceptual and methodological differences, estimates of changes from the SEPH and the LFS differ occasionally. However, the trends in the data are similar. For a more in-depth discussion of the conceptual differences between employment measures from the LFS and the SEPH, refer to Section 8 of the Guide to the Survey of Employment, Payrolls and Hours (Catalogue number72-203-G). Unless otherwise stated, this release presents seasonally adjusted data, which facilitate comparisons because the effects of seasonal variations are removed. For more information on seasonal adjustment, see Seasonally adjusted data – Frequently asked questions. Non-farm payroll employment data are for all hourly and salaried employees and for the "other employees" category, which includes piece-rate and commission-only employees. Unless otherwise specified, average weekly hours data are for hourly and salaried employees only and exclude businesses that could not be classified to a NAICS code. All earnings data include overtime and exclude businesses that could not be classified to a NAICS code. Earnings data are based on gross taxable payroll before source deductions. Average weekly earnings are derived by dividing total weekly earnings by the number of employees. Job Vacancy and Wage Survey JVWS collection is done on a quarterly basis. The quarterly sample of business locations is allocated to the three collection months of the quarter, approximately balanced by province and by industrial sector across each of the three months. This allows both quarterly and monthly estimates to be produced. The JVWS also provides comprehensive quarterly data on job vacancies by industrial sector and detailed occupation for Canada and the provinces, territories and economic regions; offered hourly wages; and job vacancy characteristics. Quarterly data for the second and third quarters of 2020 are unavailable because survey operations were temporarily suspended during the COVID-19 pandemic. More information about the concepts and use of data from the JVWS is available in the Guide to the Job Vacancy and Wage Survey (Catalogue number75-514-G). Preliminary monthly estimates are produced for job vacancies, job vacancy rates and payroll employment using available responses from business locations sampled in the corresponding reference month. The reference period for the JVWS is the first day of the respective month. These preliminary monthly estimates are revised and finalized when the corresponding quarterly estimates are released or shortly thereafter. Users are encouraged to use the most up-to-date data available for each month. JVWS estimates are not seasonally adjusted. Therefore, month-to-month and quarter-to-quarter comparisons should be interpreted with caution as they may reflect seasonal movements. While JVWS employment is calibrated to the SEPH, SEPH payroll employment and JVWS preliminary monthly employment figures may differ because of calibration grouping and differences in scope and reference period. Real-time data tables Next release Products The product "Earnings and payroll employment in brief: Interactive app" (14-20-0001) is now available. This interactive data visualization application provides a comprehensive picture of the Canadian labour market using the most recent data from the Survey of Employment, Payrolls and Hours. The estimates are seasonally adjusted and available by province and largest industrial sector. Historical estimates going back 10 years are also included. The interactive application allows users to quickly and easily explore and personalize the information presented. Combine multiple provinces and industrial sectors to create your own labour market domains of interest. Contact information Industry Intelligence Editor's Note: This press release omits select charts and/or marketing language for editorial clarity. Click here to view the full report.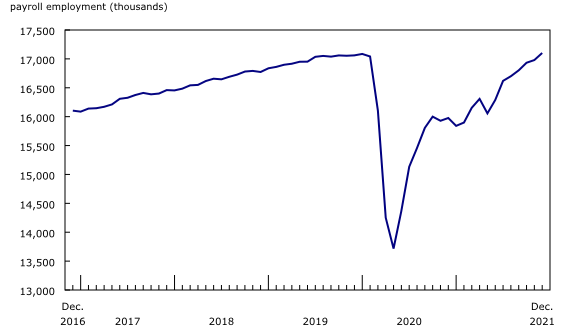
Payroll employment was up in nine provinces in December, while there was little change in Nova Scotia. Ontario (+70,100; +1.1%) and Quebec (+20,600; +0.5%) saw the largest increases in December. The only provinces where payroll employment had not yet reached pre-COVID levels in December were Alberta (-34,400; -1.7%), Ontario (-32,100; -0.5%) and Newfoundland and Labrador (-2,000; -0.9%).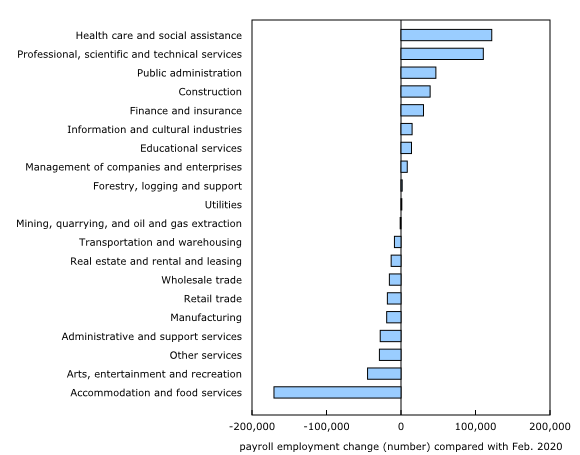
Payroll employment in health care and social assistance rose by 25,600 (+1.2%) in December, led by general medical and surgical hospitals (+7,400; +1.3%).
Payroll employment in educational services increased by 23,100 (+1.7%) in December, bringing it above its pre-COVID level (+14,100; +1.0%) for the first time. While most provinces recorded increases in the month, Ontario (+9,300; +1.8%) and Quebec (+5,800; +1.7%) reported the largest gains.
Payroll employment in finance and insurance rose by 8,800 (+1.1%) in December, led by gains in Ontario (+5,400; +1.5%). Nationally, gains were spread across most industries within the sector, with securities and commodity contracts intermediation and brokerage (+2,900; +5.9%) and insurance carriers (+2,000; +1.4%) reporting the largest monthly payroll employment increases.
Average weekly earnings were $1,135 in December, little changed when compared with November, but up 1.7% on a year-over-year basis. In contrast, in December 2020 weekly earnings were up 6.9% on a year-over-year basis, which was attributable, in part, to changes in the composition of employment which occurred earlier in the pandemic, particularly declines in lower-paid employment. Based on Labour Force Survey results, changes in the composition of employment have had less of an effect on the interpretation of wage growth trends in recent months.
There were 896,100 job vacancies in Canada at the start of December, 2.5% (+21,400) higher than at the beginning of November. While the number of vacancies remained below the recent peak of 988,300 observed in September 2021, there were 87.9% more vacancies in December 2021 than in December 2020. (Data from the Job Vacancy and Wage Survey [JVWS] are not seasonally adjusted).
The number of job vacancies in health care and social assistance reached a record high in December, with employers actively recruiting to fill 137,100 vacant positions. The job vacancy rate also peaked in December (5.9%), up 0.7 percentage points compared with November, and 2.9 percentage points higher than in the fourth quarter of 2019. While vacancies continued to increase in health care and social assistance in December, payroll employment in the sector was 6.5% (+134,900) higher than its pre-COVID level (data on employment are from SEPH and adjusted for seasonality).
There were 142,300 vacancies in accommodation and food services in December, more than any other sector and up 9.4% (+12,300) compared with November. The job vacancy rate was 10.9%, the highest monthly rate across all sectors for the eighth consecutive month. Although vacancies in the sector have increased, payroll employment in the sector remained below its pre-COVID level (-12.7%; -170,600).
As winter approached, job vacancies in construction fell to 61,800 in December, the third consecutive monthly decline from a record high (81,700) reached in September. While some of the decline observed in December may have been due to seasonal patterns, the number of job vacancies in construction was 88.2% (+29,000) higher than in the fourth quarter of 2019. The job vacancy rate was 5.2%, up from 2.9% in the fourth quarter of 2019.
The number of vacant positions in transportation and warehousing declined 6,600 (-12.8%) to 44,900 in December, after reaching an all-time high of 51,500 in November. The job vacancy rate (5.5%) remained above the all-industry average.
Compared with November, job vacancies were up in five provinces in December (not seasonally adjusted). Proportionally, the largest increases were in Saskatchewan (+3,500; +19.4%), New Brunswick (+2,300; +19.4%) and British Columbia (+20,300; +15.1%).
In response to the emergence of the Omicron variant and rising COVID-19 cases, new COVID-19 public health measures were implemented near the end of December 2021 and early January 2022 in many provinces. The impact of these measures on employment and job vacancies will be reflected in the January results.
Survey of Employment, Payrolls and Hours
With the March 29 release of January 2022 estimates, seasonally adjusted data will be revised based on the latest seasonal factors. Seasonally adjusted estimates will be revised historically back to 2001. In addition to the new seasonal factors, historical revisions will be made for a small number of industries (four-digit level of the North American Industry Classification System [NAICS]).
Beginning with the release of October 2020 data, preliminary monthly estimates from the Job Vacancy and Wage Survey (JVWS) are published on a monthly basis. These estimates provide more timely information on the number of job vacancies and the job vacancy rate by province and by industrial sector.
Real-time data tables 14-10-0357-01, 14-10-0358-01, 14-10-0331-01 and 14-10-0332-01 will be updated on March 14, 2022.
Data on payroll employment, earnings and hours, and job vacancies for January 2022 will be released on March 29, 2022.
More information about the concepts and use of the Survey of Employment, Payrolls and Hours is available in the Guide to the Survey of Employment, Payrolls and Hours (Catalogue number72-203-G).
For more information, or to enquire about the concepts, methods or data quality of this release, contact us (toll-free 1-800-263-1136; 514-283-8300; infostats@statcan.gc.ca) or Media Relations (statcan.mediahotline-ligneinfomedias.statcan@statcan.gc.ca).
* All content is copyrighted by Industry Intelligence, or the original respective author or source. You may not recirculate, redistrubte or publish the analysis and presentation included in the service without Industry Intelligence's prior written consent. Please review our terms of use.


