OTTAWA
,
April 12, 2022
(press release)
–
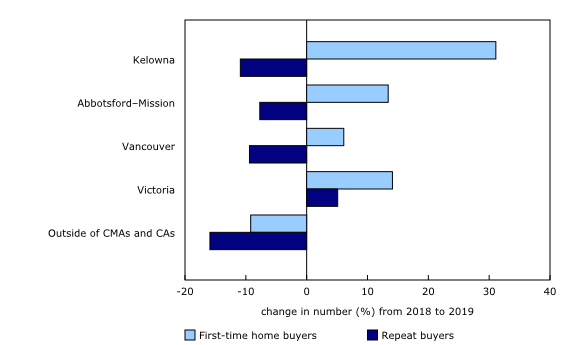
New data from the Canadian Housing Statistics Program (CHSP) show the extent of inequalities in housing: multiple-property owners possess nearly one-third of all residential properties and the top 10% wealthiest owners account for around one-quarter of residential housing value. Despite these inequalities, new data show an increase in the number of first-time home buyers from 2018 to 2019. The data tables accompanying this release have been updated for the 2020 reference year, and expanded to include owners in Newfoundland and Labrador, Yukon, the Northwest Territories, and Nunavut. A new table on home buyers has also been added, covering Nova Scotia, New Brunswick, British Columbia and Yukon. These data provide a snapshot of property owners and buyers in the period prior to the outbreak of the COVID-19 pandemic. Multiple-property owners own 31% of residential properties in Ontario Individual multiple-property owners hold a significant share of the residential property stock, despite accounting for a relatively small number of owners. In Nova Scotia, New Brunswick, Ontario, and British Columbia in 2020, these owners held between 29% (British Columbia) and 41% (Nova Scotia) of the property stock while accounting for 15% (British Columbia) to 22% (Nova Scotia) of owners. A previous release examined multiple-property owners in-depth. Among other things, it revealed that the majority owned two properties and that the most common combination was two single-detached houses. In 2020, the majority of multiple-property owners held all their properties within the same census metropolitan area (CMA) or census agglomeration (CA), and around 40% held all their properties in the same census subdivision in Ontario and British Columbia, consistent with owners who would want to remain close to their rental properties. Businesses, government, and other entities comprised between 1.6% (Ontario) and 2.1% (New Brunswick) of owners, and owned between 7.6% (Ontario) and 10.0% (British Columbia) of the property stock. Most of these properties were held by corporations. Individuals who own a single property, by contrast, made up a majority of owners: between 77% (Nova Scotia) and 83% (British Columbia) of all property owners. Single-property owners held around half the property stock in Nova Scotia and New Brunswick, and around 60% of the property stock in Ontario and British Columbia. Chart 1: Multiple-property owners own around 30% to 40% of the property stock Top 10% of owners earn more than the bottom 50% combined The income of the bottom half of owners was less than one-quarter of the total in each of these provinces, ranging from 20% in British Columbia to 23% in New Brunswick. In Ontario and British Columbia, owners in this group had yearly incomes below $55,000. The bottom 50% contained five times as many owners as the top 10%, yet received a lower share of total income. This is because the average income in the top 10% was at least five times the average in the bottom 50%. The distribution of housing wealth among owners followed a similar pattern. When ordering individual owners by the value of their real estate holdings, the top 10% owned between 24% (New Brunswick) and 29% (British Columbia) of the sum of all residential property values in each province. The bottom half of individual owners owned less than one-quarter in every province, ranging from 21% in Nova Scotia, to 24% in New Brunswick and Ontario. A smaller portion of housing wealth was owned by non-individual owners, such as businesses and government entities. The value held by such owners ranged from 8.8% in New Brunswick to 14.7% in Nova Scotia. The value of real estate holdings represents gross housing wealth and does not account for any unpaid amounts on mortgages, nor for any non-housing assets of the owners. Chart 2: Around one-quarter of housing wealth held by top 10% of owners More first-time home buyers in Nova Scotia, New Brunswick, and British Columbia Growth in the number of FTHBs between the 2018 and 2019 calendar years varied significantly across British Columbia. The Kelowna CMA had the largest increase with 31.1%; this compares with Abbotsford–Mission (+13.4%), Vancouver (+6.1%) and Victoria (+14.1%). Only the Victoria CMA had an overall increase in repeat buyers (+5.1%), while all other CMAs in the province saw a decline, with areas outside CMAs and CAs having the largest decrease (-15.9%). Median sale prices, changes in the age of buyers, and population growth rates may have contributed to these geographic differences. Kelowna, which had the lowest median sale price ($535,000) among the CMAs in the province, had a larger relative increase in FTHBs than did Abbotsford–Mission ($584,000 median sale price), Victoria ($642,000) and Vancouver ($700,000). Kelowna was also the only CMA in British Columbia which saw an increase in the number of buyers under the age of 35. Population growth from 2016 to 2021 reported in the 2021 Census reveals a similar pattern: Kelowna was the fastest growing large urban centre in Canada at 14.0%. The CMAs of Abbotsford–Mission (+8.4%), Victoria (+8.0%), and Vancouver (+7.3%) were more consistent with the provincial total for British Columbia (+7.6%). Chart 3: More first-time home buyers in 2019 than in 2018 Chart 4: Number of first-time home buyers increased in every census metropolitan area in British Columbia between 2018 and 2019 Urban homeowners have double the income of renters A similar pattern was observed across Canada. The median income of renters was $25,000 in the largest CMAs, while the median income of owners ranged from $50,000 in Moncton to $60,000 in Halifax and St. John's. Owners thus had fairly similar incomes across provinces, in spite of differing median assessment values in these CMAs, which ranged from $151,000 in Moncton and $229,000 in Halifax, to $866,000 in Vancouver. A similar inequality existed in the territories. Homeowners in the CAs of Whitehorse and Yellowknife had median incomes more than double those of renters, in spite of higher renter incomes in these cities. Chart 5: Homeowners have around double the income of renters in selected CMAs and CAs Note to readers Homeowners for the 2020 reference year and buyers from the 2019 reference period are linked to the tax data from the T1 Family File (T1FF) for the tax year 2019. Data in the T1FF include all individuals who filed an individual T1 tax return, combined with other administrative files received from the Canada Revenue Agency. A property may have more than one owner, and an owner may have more than one property; thus, the counts of owners and properties can differ. In this release, people who own multiple residential properties are those whose name is on the property title of more than one residential property within a given province or territory. For the purposes of this release, people who own one property in a given jurisdiction and a second property in another jurisdiction are not included among multiple-property owners at this time. Geographical boundaries Definitions For the purposes of this release, renters refers to tax filers with a positive reported income, who were not homeowners in the given geography in the linked reference year. It is thus a residual group of mostly adult resident tax filers who may or may not be paying rent. It excludes renters who did not file taxes for the 2019 tax year, and includes non-owners who live with owners. Owners include owners of vacant land and other properties which they may or may not be occupying. For the purposes of this release, residential property value refers to the assessed value of the property for the purpose of determining property taxes. In Ontario, assessment values for properties built since the last assessment year (2016) are suppressed. For the purposes of this release, property stock refers to all residential properties in a province or territory, including vacant land, within the target population of the CHSP. The largest census metropolitan area (CMA) refers to the most populated CMA in each province, based on the population from the 2016 Census. First-time home buyer (FTHB) refers to a person who purchased a residential property during the reference period and did not own a residential property previously. It includes buyers who claimed the Home Buyers' Amount and buyers whose spouse or common-law partner was a buyer in the same sale, and who claimed the amount. For the purposes of this release, repeat buyers is a residual category comprised of individuals who purchased a residential property during the reference period and were not first-time home buyers. Sale price of property refers to the dollar amount set forth during the sale of the property as per the contractual agreement. Products Contact information
In addition to their primary residences, multiple-property owners hold properties to receive rental income or for other investment purposes, or as a recreational property which may also provide rental income. Owners seeking additional properties contribute to increased competition in already tight real estate markets, making it more difficult for prospective homeowners to purchase a home. The overall impact of such holdings on housing prices and housing affordability, however, depends on a multitude of factors that are not fully assessed in this release.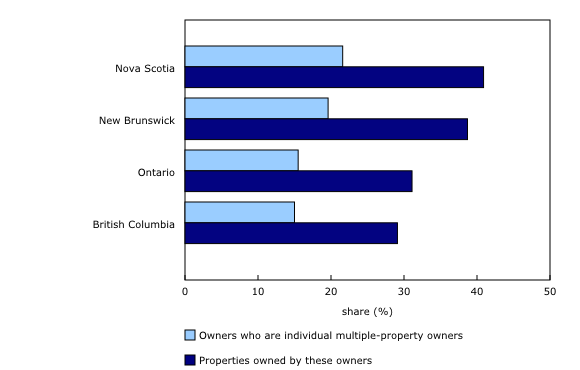
Both income and housing wealth are concentrated at the top, even among owners. When ordering individual owners by their yearly incomes, the top 10% of owners in Ontario and British Columbia each had yearly incomes above $125,000. In the provinces of Nova Scotia, New Brunswick, Ontario, and British Columbia, the top 10% declared incomes totalling 29% (New Brunswick) to 35% (British Columbia) of the total income declared by all owners in those provinces.
The number of first-time home buyers (FTHBs) increased in Nova Scotia, New Brunswick, and British Columbia between the 2018 and 2019 calendar years. The number of FTHBs increased at a faster rate than the number of repeat buyers—buyers who are or were previously owners. This difference was largest in British Columbia, where the number of FTHBs increased by 5.6%, while the number of repeat buyers decreased by 10.1%. The decrease in the number of repeat buyers in British Columbia came in the wake of provincial legislation implemented to cool the real estate market, which may have dissuaded existing owners from moving or from investing in further properties. In February 2018, the provincial government of British Columbia announced policies aimed at curbing housing demand (1.0 MB, in PDF version only). These included higher taxes on properties valued above $3 million, a new speculation and vacancy tax, and an increase and expansion of the foreign buyer tax. These measures covered at least part of every CMA in the province.
FTHBs require a combination of sufficient income and savings in order to enter the housing market. The median individual incomes of FTHBs matched those of the owner population in Moncton ($50,000 for FTHBs and for all owners) and in Halifax ($60,000 for FTHBs and for all owners). Meanwhile, in Vancouver, it was $65,000 for FTHBs vs. $55,000 for all owners. These incomes were double or more those of renters in the same CMAs—here defined as tax filers who were not homeowners.
Homeowners in the Canadian Housing Statistics Program (CHSP) data for the 2020 reference year are defined as owners of properties assessed for 2020 property taxes. The exact stock date varies between provinces. Buyers in the 2019 reference period are owners in the 2020 reference year who purchased a property during the 2019 calendar year.
The CHSP disseminates data based on the geographical boundaries from the Standard Geographical Classification 2016.
Total income includes income reported by tax filers from any of the following sources: employment income; dividends and interests; government transfers (including non-taxable income); private pensions; registered retirement savings plans; and other income such as net limited partnership income, rental net income, alimony, registered disability savings plans and other income (line 130 of the T1 form). It excludes veterans' disability and dependant pensioners' payments, war veterans' allowances, lottery winnings, and capital gains.
The latest issue of Housing Statistics in Canada (Catalogue number46280001) is now available. This issue contains the product "Development of a Composite Quality indicator for Statistical Products Derived from Administrative Sources."
For more information, or to enquire about the concepts, methods or data quality of this release, contact us (toll-free 1-800-263-1136; 514-283-8300; infostats@statcan.gc.ca) or Media Relations (statcan.mediahotline-ligneinfomedias.statcan@statcan.gc.ca).
* All content is copyrighted by Industry Intelligence, or the original respective author or source. You may not recirculate, redistrubte or publish the analysis and presentation included in the service without Industry Intelligence's prior written consent. Please review our terms of use.


