OTTAWA
,
February 8, 2022
(press release)
–
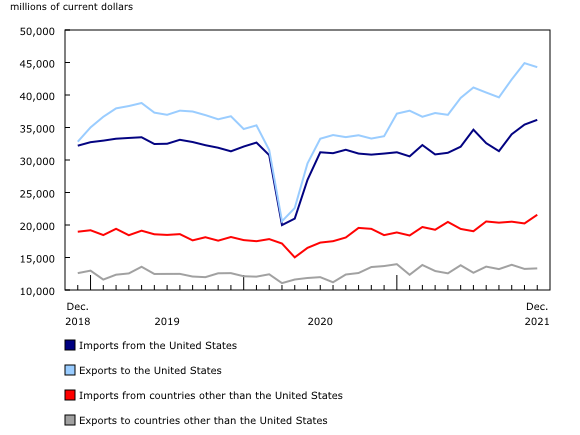
In December, Canada's merchandise imports rose 3.7%, while exports were down 0.9%. As a result, after posting six consecutive monthly surpluses, Canada's merchandise trade balance returned to a deficit position. It moved from a surplus of $2.5 billion in November to a deficit of $137 million in December, a position considered to be essentially balanced. Chart 1: Merchandise exports and imports Consult the "International trade monthly interactive dashboard" to explore the most recent results of Canada's international trade in an interactive format. Cellphone imports end 2021 with an increase after a year marked by instability Chart 2: Contribution to the monthly change in imports, by product, December 2021 Imports of electronic and electrical equipment and parts posted the largest increase in December, rising 16.2% to an all-time high of $7.0 billion. While all subcategories posted growth, imports of communication, and audio and video equipment (+52.1%) had the largest increase. This subcategory, which is largely composed of smartphones, experienced strong monthly variations in 2021, primarily because of disruptions in the global supply chain. This appeared to slow the growth of these imports throughout the year, and the increase in December partially offset this trend. Despite the gain in December, annual imports of communication, and audio and video equipment were down 5.4% in 2021 compared with 2019, the last year for which data are comparable for these products. Chart 3: Imports of communication, and audio and video equipment Imports of motor vehicles and parts rose 5.1% in December to $8.9 billion, their highest level since February 2020. The increase in imports of motor vehicle engines and parts (+15.6%) contributed the most to the monthly growth. In December, Canadian auto plants typically close temporarily for the holidays, leading to a significant decline in production month over month. In 2021, because of the supply issues that affected the industry, the decline in Canadian production from November to December was weaker than usual, resulting in higher imports of engines and parts on a seasonally adjusted basis (+15.6%), as well as an increase in exports of passenger cars and light trucks (+8.4%). Imports of basic and industrial chemical, plastic and rubber products rose 6.2% to a record $5.0 billion in December, a third consecutive monthly increase. Imports of fertilizers, pesticides and other chemical products (+36.8%) contributed the most to the monthly gain. As mentioned in the November 2021 release of the Industrial Product Price Index, a wide range of events affected this industry recently, including lower production in China and new quotas imposed on fertilizer exports in Russia. These events led to higher prices and atypical movements in Canadian imports. Although the prices of fertilizer imports have recently risen sharply, the increase in December was mainly attributable to higher volumes. First decline in energy product exports in eight months Chart 4: Contribution to the monthly change in exports, by product, December 2021 Exports of energy products fell 5.9% in December, the first monthly decline since April. Crude oil exports (-5.0%) contributed the most to the decrease, on a sharp decline in prices. Despite the value of crude oil exports falling, volumes were up for a second consecutive month, coinciding with an increase in pipeline capacity. Coal exports (-33.5%) also contributed to the decrease, falling for a second straight month. This drop coincided with recent disruptions in freight transportation in Western Canada because of flooding in British Columbia. Despite the monthly decline, exports of energy products rose 82.8% in 2021 compared with 2020, the largest annual increase among all product sections. Partly offsetting these declines was a 4.3% increase in exports of consumer goods in December, primarily on stronger exports of pharmaceutical products (+16.5%). In November, large shipments of medication for the treatment of COVID-19 arrived in Canada for packaging and labelling, and some of this medication was subsequently exported during the same month. These exports continued in December and largely accounted for the increase in foreign shipments of pharmaceutical products. Record deficit with countries other than the United States Chart 5: International merchandise trade balance Exports to countries other than the United States were up 0.6% in December. Higher exports to the United Kingdom (gold), France (aircraft and crude oil) and India (copper ore) were partly offset by lower exports to China (canola and coal). Canada's trade deficit with countries other than the United States widened from $7.0 billion in November to a record $8.2 billion in December. Following increases of 7.0% in October and 5.9% in November, exports to the United States fell 1.4% in December. Meanwhile, imports from the United States rose 2.1%, a third consecutive monthly increase. Canada's trade surplus with the United States narrowed from $9.5 billion in November to $8.1 billion in December. When the average exchange rates of November and December are compared, the Canadian dollar lost 1.4 US cents relative to the American dollar. Chart 6: Canada's international merchandise trade with the United States and with countries other than the United States Growth in quarterly imports and exports Imports rose 5.9% in the fourth quarter, a sixth consecutive increase. Imports of consumer goods (+9.2%) and motor vehicles and parts (+12.1%) contributed the most to the gain. Canada's quarterly merchandise trade surplus widened from $2.1 billion in the third quarter to $4.1 billion in the fourth quarter. In the fourth quarter, exports in constant dollars (using 2012 chained dollars) rose 2.6%, while imports in constant dollars increased 3.1%. Despite supply chain disruptions, total export and import values reach record highs in 2021 In 2021, Canada's annual merchandise exports rose 22.0% compared with 2020, when exports fell 12.3% because of restrictions in place during the first waves of the pandemic. Annual exports reached a record $637 billion, exceeding the previous record set in 2019 by 7.0%. The prices of exports played a key role in the annual increase in 2021. When the effect of prices is removed, exports in constant dollars rose 1.9% in 2021, but still remained 5.4% lower than in 2019. Imports reached a record $631 billion in 2021, up 12.2% from 2020, but 2.7% higher than in 2019. Despite increases observed in a large majority of product sections, some remained below 2019 levels. This was the case for imports of motor vehicles and parts (-17.6% compared with 2019) and energy products (-15.5% compared with 2019). Higher prices also had a positive impact on annual imports, but to a lesser extent than exports. In constant dollars, imports rose 8.3% in 2021. Strong export prices throughout the year enabled the merchandise trade balance to post surpluses for nine months in 2021. The annual trade surplus totalled $6.6 billion, the first such surplus since 2014, and the largest since 2008. Consult the "International Trade Explorer" to explore the annual results of Canada's international trade (on a customs basis) in an interactive format. Revisions to November merchandise export and import data Monthly trade in services When international trade in goods and international trade in services were combined, exports decreased 0.3% to $69.4 billion in December, while imports were up 3.5% to $70.0 billion. As a result, Canada went from a trade surplus with the world of $2.2 billion in November to a deficit of $613 million in December. Note to readers International trade data by commodity are available on both a BOP and a customs basis. International trade data by country are available on a customs basis for all countries and on a BOP basis for Canada's 27 principal trading partners (PTPs). The list of PTPs is based on their annual share of total merchandise trade—imports and exports—with Canada in 2012. BOP data are derived from customs data by adjusting for factors such as valuation, coverage, timing and residency. These adjustments are made to conform to the concepts and definitions of the Canadian System of National Accounts. For a conceptual analysis of BOP-based data versus customs-based data, see "Balance of Payments trade in goods at Statistics Canada: Expanding geographic detail to 27 principal trading partners." For more information on these and other macroeconomic concepts, see the Methodological Guide: Canadian System of Macroeconomic Accounts (Catalogue number13-607-X) and the User Guide: Canadian System of Macroeconomic Accounts (Catalogue number13-606-G). The data in this release are on a BOP basis and are seasonally adjusted. Unless otherwise stated, values are expressed in nominal terms, or current dollars. References to prices are based on aggregate Paasche (current-weighted) price indexes (2012=100). Movements within aggregate Paasche prices can be influenced by changes in the share of values traded for specific goods, with sudden shifts in trading patterns—as observed currently with the COVID-19 pandemic—sometimes resulting in large movements in Paasche price indexes. Volumes, or constant dollars, are calculated using the Laspeyres formula (2012=100), unless otherwise stated. For information on seasonal adjustment, see Seasonally adjusted data – Frequently asked questions. Revisions The previous year's customs-based data are revised with the release of data for the January and February reference months, and thereafter on a quarterly basis. The previous two years of customs-based data are revised annually, and revisions are released in February with the December reference month. The previous year's BOP-based data are revised with the release of data for the January, February, March and April reference months. To remain consistent with the Canadian System of Macroeconomic Accounts, revisions to BOP-based data for previous years are released annually in December with the October reference month. Factors influencing revisions include the late receipt of import and export documentation, incorrect information on customs forms, the replacement of estimates produced for the energy section with actual figures, changes in merchandise classification based on more current information, and changes to seasonal adjustment factors. The seasonal adjustment parameters are reviewed and updated annually, and applied with the October reference month release. For information on data revisions for exports of energy products, see Methodology for Exports of Energy Products within the International Merchandise Trade Program. Revised data are available in the appropriate tables. Real-time data table Next release Products The product "The International Trade Explorer" (Catalogue number71-607-X) is now available online. The Canadian International Merchandise Trade online database is no longer available. It has been replaced by the Canadian International Merchandise Trade Web Application (Catalogue number71-607-X), a modern tool that provides trade data users with a number of enhancements. The updated "Canada and the World Statistics Hub" (Catalogue number13-609-X) is now available online. This product illustrates the nature and extent of Canada's economic and financial relationship with the world using interactive charts and tables. It provides easy access to information on trade, investment, employment and travel between Canada and a number of countries, including the United States, the United Kingdom, Mexico, China, Japan, Belgium, Italy, the Netherlands and Spain. Contact information To enquire about the concepts, methods or data quality of this release, contact Benoît Carrière (statcan.mediahotline-ligneinfomedias.statcan@statcan.gc.ca), International Accounts and Trade Division. Industry Intelligence Editor's Note: This press release omits select charts and/or marketing language for editorial clarity. Click here to view the full report.
Total imports rose 3.7% in December to a record $57.7 billion. This was the third consecutive monthly increase, and gains were observed in 8 of the 11 product sections. In real (or volume) terms, total imports rose 3.1%.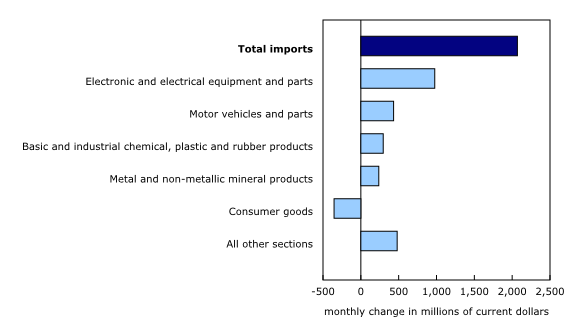

After posting a record high in November, total exports fell 0.9% in December to $57.6 billion, despite the fact that increases were observed in a majority of product sections. Non-energy exports were up 0.7% in December. Prices for total exports fell 0.7%, the second monthly decline in 2021.
Imports from countries other than the United States rose 6.6% in December. Imports from China (+9.3%) posted the largest increase, partly on imports of communication equipment and computers. Imports from Vietnam, Taiwan, South Korea and Mexico were also up.
Canada's merchandise exports rose 7.1% in the fourth quarter of 2021. Exports of energy products (+17.6%) were responsible for more than half of the quarterly increase. Exports of motor vehicles and parts (+15.5%) and consumer goods (+7.4%) also contributed to the gain.
Canada's international trade in 2021 was marked by global supply issues that created much uncertainty and disrupted production in many industries and countries. For example, problems with the supply of semiconductor chips limited manufacturing in Canada, especially motor vehicle manufacturing, and this had an impact on exports. These global issues also affected imports of a number of finished products, such as communication devices and clothing. It is within this context that Canadian merchandise imports and exports posted large monthly movements in 2021. Supply issues also drove the prices of raw materials up sharply, although this had a positive impact on Canada's export values.
Imports in November, originally reported at $55.4 billion in the previous release, were revised to $55.7 billion in the release for the current reference month. Exports in November, originally reported at $58.6 billion in the previous release, were revised to $58.2 billion in the current month's release.
In December, monthly service exports rose 0.4% to $11.8 billion. Service imports increased 2.3% to $12.2 billion.
Merchandise trade is one component of Canada's international balance of payments (BOP), which also includes trade in services, investment income, current transfers, and capital and financial flows.
In general, merchandise trade data are revised on an ongoing basis for each month of the current year. Current-year revisions are reflected in both the customs-based and the BOP-based data.
The real-time data table 12-10-0120-01 will be updated on February 21, 2022.
Data on Canadian international merchandise trade for January 2022 will be released on March 8, 2022.
The product "International trade monthly interactive dashboard" (Catalogue number71-607-X) is now available. This new interactive dashboard is a comprehensive analytical tool that presents monthly changes in Canada's international merchandise trade data on a balance-of-payments basis, fully supporting the information presented every month in the Daily release.
For more information, contact us (toll-free 1-800-263-1136; 514-283-8300; infostats@statcan.gc.ca).
* All content is copyrighted by Industry Intelligence, or the original respective author or source. You may not recirculate, redistrubte or publish the analysis and presentation included in the service without Industry Intelligence's prior written consent. Please review our terms of use.


