OTTAWA
,
May 16, 2022
(press release)
–
Manufacturing sales rose 2.5% to $70.2 billion in March, the sixth consecutive monthly increase. Sales rose in 16 of 21 industries, led by the petroleum and coal (+9.1%), primary metal (+6.5%), paper (+9.3%), and chemical (+3.3%) product industries. Meanwhile, the machinery industry posted the largest decline (-4.9%). On a quarterly basis, sales rose 6.5% in the first quarter of 2022, the seventh consecutive quarterly gain and the largest increase since the third quarter of 2020. Chart 1: Manufacturing sales Sales in constant dollars were unchanged in March, indicating that the entire increase in current dollar sales was driven by higher prices as the Industrial Product Price Index rose 4.0%. Quarterly sales in volume terms increased 1.4% in the first quarter of 2022. Petroleum sales continue to increase on higher prices Sales of primary metals reached a new record high, rising 6.5% to $5.8 billion in March. All primary metal industries posted higher sales, led by the alumina and aluminum production and processing (+47.9%) and iron and steel mills and ferro-alloy (+21.8%) industries. The gains were driven by higher prices of unwrought aluminum and aluminum alloys (+8.3%) and hot-rolled iron or steel products (+7.6%). The tight global supply of primary metals due to stricter measures in China related to the COVID-19 pandemic and sanctions against Russia due to its aggression in Ukraine led to increases in prices of many primary metals. Despite the month-over-month sales increase, sales on a quarterly basis were down 0.6% in the first quarter of 2022. Sales in real terms edged down 0.2% in March. Following a 2.1% decline in February, paper product sales increased 9.3% to $2.7 billion in March on higher prices and volume sold. In real terms, sales were up 6.7% in March. Some paper manufacturers were able to ship their products in March following several delays due to port congestion. Year over year, sales of paper products rose 14.9% in March, while on a quarterly basis sales increased 1.3% in the first quarter of 2022. Sales also increased in the chemical (+3.3%), motor vehicle (+4.7%) and motor vehicle parts (+6.4%) industries in March. Sales in the machinery industry decreased the most, falling 4.9% to $3.6 billion in March following five consecutive month-over-month increases. Despite the decline, sales were 6.9% higher on a year-over-year basis in March and rose 3.4% in the first quarter of 2022. Sales of other transportation equipment fell 41.0% to $227.8 million in March. The decline was attributed to seasonal changes in the production of recreational transportation equipment. Despite the decrease in March, sales in the other transportation equipment industry rose 15.9% in the first quarter of 2022. Production of aerospace products and parts (-8.6%) and sales of food products (-0.6%) were also down in March. Sales increase in all provinces, led by Ontario In Ontario, sales rose 2.4% to $30.1 billion in March following a 6.6% gain in February. Sales increased in 12 of 21 industries in March and were largest in the petroleum and coal (+10.3%), motor vehicle (+5.2%), and motor vehicle part (+6.8%) industries. Despite the ongoing global shortage of semiconductor parts, sales of motor vehicles in Ontario increased to their highest level since November 2020. Meanwhile, exports of motor vehicles and parts rose by 7.9% in March. On a quarterly basis, motor vehicle sales rose 6.9% in the first quarter of 2022, the third consecutive gain and the highest level since the fourth quarter of 2020. In Alberta, sales rose 4.1% to $8.8 billion in March, the sixth consecutive monthly increase, primarily on higher sales of petroleum and coal product (+11.4%) and fabricated metals (+24.7%). The gains were partially offset by a 17.9% decline in sales of machinery. Sales in Saskatchewan rose 11.1% to $2.2 billion in March, mainly on higher sales of chemicals, petroleum and coal product and primary metals industries. The gain in the chemical industry was driven by record high sales of pesticide and fertilizers. On a quarterly basis, total sales in Saskatchewan rose 9.4% in the first quarter of 2022. Sales increase in all selected census metropolitan areas except Winnipeg Manufacturing sales increased in 14 of the 15 CMAs in March, led by Edmonton, Québec, and Toronto. Only Winnipeg posted a decline. Sales in Edmonton increased 9.2% to $4.4 billion in March, the sixth consecutive month-over-month increase. The gain in March was almost entirely due to higher sales of petroleum and coal product (+16.0%). In Québec, sales increased 16.9% to $2.2 billion in March mainly on higher sales in the petroleum and coal industry. Year over year, sales in Québec were up 47.2% compared with March 2021. Sales in Toronto rose 2.5% to $11.7 billion in March, following a 6.4% increase in February on higher sales in 15 of 21 industries led by fabricated metals (+10.0%), petroleum and coal product (+30.6%), and food products (+2.1%). Year over year, total sales in Toronto rose 18.9% in March. Record-high inventory levels continue Chart 2: Inventory levels rise The inventory-to-sales ratio was unchanged at 1.58 in March. This ratio measures the time, in months, that would be required to exhaust inventories if sales were to remain at their current level. Chart 3: The inventory-to-sales ratio is unchanged Unfilled orders rise Chart 4: Unfilled orders rise The total value of new orders reached a new record high, rising 1.4% to $71.9 billion in March, driven mostly by higher new orders of ship and boat building, computer and electronics product, and petroleum and coal product industries. Capacity utilization rate increases on higher production Chart 5: The capacity utilization rate increases The capacity utilization rates increased in all 21 industries in March, but were more pronounced in the transportation equipment (+10.4 percentage points), food (+5.3 percentage points), paper (+5.5 percentage points) and beverage and tobacco (+7.2 percentage points) product industries. Higher production of motor vehicle and motor vehicle parts were responsible for the increase in capacity utilization of the transportation equipment industry. Note to readers Estimates of sales of goods manufactured, inventories and orders in tables 16-10-0047-01 and 16-10-0048-01 have been revised back to January 2018 for unadjusted data, and back to January 2016 for seasonally adjusted data. Real manufacturing sales, orders, inventory owned and inventory-to-sales ratio estimates in table 16-10-0013-01 have been revised back to January 2016. Unadjusted estimates of capacity utilization rates, in table 16-10-0012-01, have been revised back to January 2018. Monthly data in this release are seasonally adjusted and are expressed in current dollars, unless otherwise specified. Seasonally adjusted data are data that have been modified to eliminate the effect of seasonal and calendar influences to allow for more meaningful comparisons of economic conditions from period to period. For more information on seasonal adjustment, see Seasonally adjusted data – Frequently asked questions. Trend-cycle estimates are included in selected charts as a complement to the seasonally adjusted series. These data represent a smoothed version of the seasonally adjusted time series and provide information on longer-term movements, including changes in direction underlying the series. For information on trend-cycle data, see Trend-cycle estimates – Frequently asked questions. Both seasonally adjusted data and trend-cycle estimates are subject to revision as additional observations become available. These revisions could be large and could even lead to a reversal of movement, especially for reference months near the end of the series or during periods of economic disruption. Non-durable goods industries include food; beverage and tobacco products; textile mills; textile product mills; clothing; leather and allied products; paper; printing and related support activities; petroleum and coal products; chemicals; and plastics and rubber products. Durable goods industries include wood products; non-metallic mineral products; primary metals; fabricated metal products; machinery, computer and electronic products; electrical equipment; appliances and components; transportation equipment; furniture and related products; and miscellaneous manufacturing. Production-based industries For the aerospace and shipbuilding industries, the value of production is used instead of the value of sales of goods manufactured. The value of production is calculated by adjusting monthly sales of goods manufactured by the monthly change in inventories of goods in process and finished products manufactured. The value of production is used because of the extended period of time that it normally takes to manufacture products in these industries. Unfilled orders are a stock of orders that will contribute to future sales, assuming that the orders are not cancelled. New orders are those received, whether sold in the current month or not. New orders are measured as the sum of sales for the current month plus the change in unfilled orders from the previous month to the current month. Manufacturers reporting sales, inventories and unfilled orders in US dollars Some Canadian manufacturers report sales, inventories and unfilled orders in US dollars. These data are then converted to Canadian dollars as part of the data production cycle. For sales, based on the assumption that they occur throughout the month, the average monthly exchange rate for the reference month established by the Bank of Canada is used for the conversion. The monthly average exchange rate is available in table 33-10-0163-01. Inventories and unfilled orders are reported at the end of the reference period. For most respondents, the daily average exchange rate on the last working day of the month is used for the conversion of these variables. However, some manufacturers choose to report their data as of a day other than the last working day of the month. In these instances, the daily average exchange rate on the day selected by the respondent is used. Note that because of exchange rate fluctuations, the daily average exchange rate on the day selected by the respondent can differ from both the exchange rate on the last working day of the month and the monthly average exchange rate. Daily average exchange rate data are available in table 33-10-0036-01. Revision policy Each month, the Monthly Survey of Manufacturing releases preliminary data for the reference month and revised data for the previous three months. Revisions are made to reflect new information provided by respondents and updates to administrative data. Once a year, a revision project is undertaken to revise multiple years of data. Real-time data tables Real-time data tables 16-10-0118-01, 16-10-0119-01, 16-10-0014-01 and 16-10-0015-01 will be updated on May 23, 2022. Next release Data from the Monthly Survey of Manufacturing for April will be released on June 14, 2022. Contact information Industry Intelligence Editor's Note: This press release omits select charts and/or marketing language for editorial clarity. Click here to view the full report. 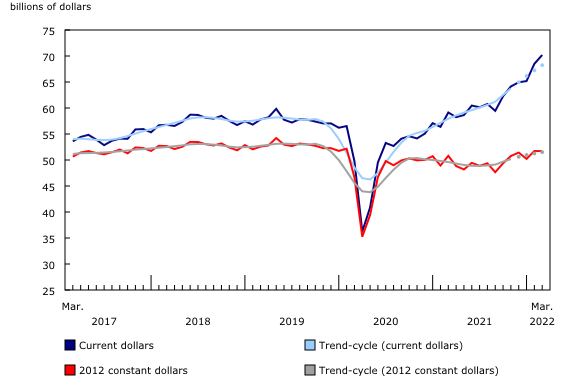
Sales in the petroleum and coal product industry increased 9.1% in March, entirely on higher prices as volumes sold declined 1.0%. Sales of petroleum and coal product rose 19.0% in the first quarter of 2022 compared with the fourth quarter of 2021. Higher demand due to the easing of COVID-19 restrictions as well as the uncertainty over energy supply due to the Russian invasion of Ukraine were responsible for the recent increase in prices of petroleum products. In March, prices of refined petroleum energy products (including liquid biofuels) rose 18.8%, while exports of refined energy products increased 25.9%.
Manufacturing sales increased in all provinces in March, led by Ontario, Alberta and Saskatchewan.
Starting with the release of manufacturing data for March, Statistics Canada now produces sales estimates for 3 new census metropolitan areas (CMAs)—Sherbrooke, Kitchener–Cambridge–Waterloo, and Windsor—along with estimates for the 12 CMAs for which estimates were already being produced prior to this release. Manufacturing sales on an unadjusted and seasonally adjusted basis have been compiled from January 2018 to March 2022 and are available in table 16-10-0011-01.
Total inventory levels marked another increase, rising 2.6% to $110.9 billion in March, on higher inventories of the primary metals (+6.8%), petroleum and coal product (+7.7%), and food (+4.3%) industries. The gains were driven by a higher value of raw materials which have been trending upward since January 2021 due to the supply chain disruptions and due to the Russian invasion of Ukraine. In March, total raw material inventories rose 2.8% from February, and were up 30.2% year over year.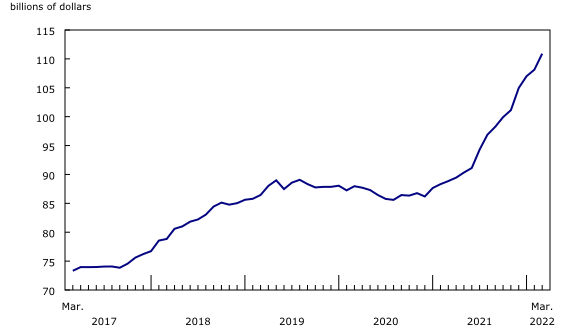

The total value of unfilled orders rose 1.7% to $100.7 billion in March, the highest level since May 2020, on higher unfilled orders in the ship and boat building (+59.6%) and computer and electronic products (+9.8%) industries. The gains were partially offset by a 1.1% decline in unfilled orders of aerospace products and parts.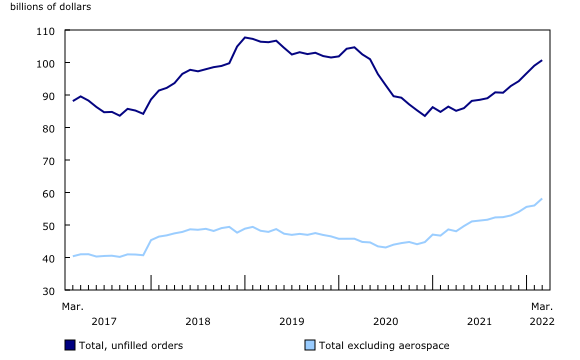
The capacity utilization rate (not seasonally adjusted) for the total manufacturing sector increased from 76.6% in February to 81.7% in March, the highest rate since May 2019.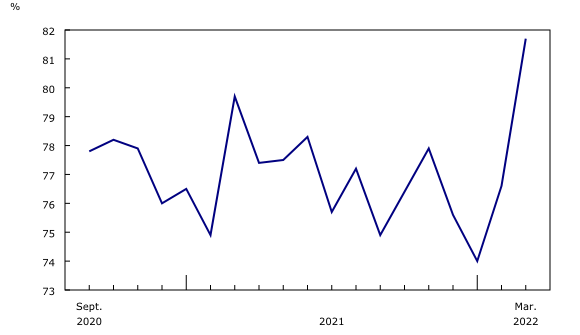
Starting with the May 2022 release of March data, seasonally adjusted sales estimates will be produced for 3 additional census metropolitan areas (CMAs)—Sherbrooke, Kitchener–Cambridge–Waterloo, and Windsor—as part of the Monthly Survey of Manufacturing, alongside the 12 CMAs for which estimates were already being produced prior to this release. Unadjusted and seasonally adjusted estimates of sales of goods manufactured have been compiled from January 2018 to March 2022 and are available in table 16-10-0011-01.
For more information, or to enquire about the concepts, methods or data quality of this release, contact us (toll-free 1-800-263-1136; 514-283-8300; infostats@statcan.gc.ca) or Media Relations (statcan.mediahotline-ligneinfomedias.statcan@statcan.gc.ca).
* All content is copyrighted by Industry Intelligence, or the original respective author or source. You may not recirculate, redistrubte or publish the analysis and presentation included in the service without Industry Intelligence's prior written consent. Please review our terms of use.


