OTTAWA
,
February 21, 2023
(press release)
–
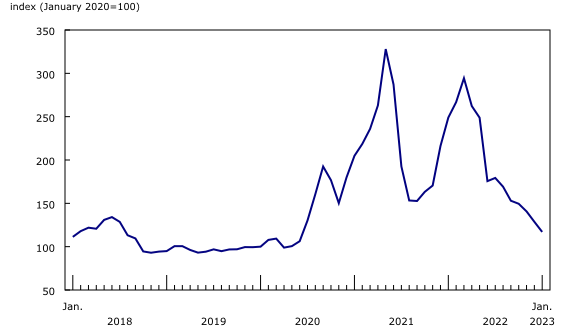
Industrial Product Price Index Chart 1: Prices for industrial products increase Prices for energy and petroleum products rose 0.4% month over month, following a 10.2% decline in December. Year over year, prices were 19.8% higher in January compared with January 2022. In January 2023, the price of finished motor gasoline was up 8.8% and jet fuel rose 14.1%, while diesel fuel fell 4.8%. The price of conventional crude oil, the raw material used to make refined petroleum products, rose by 1.3% in January. In late December, US refinery utilization dropped as a result of severe cold weather conditions, putting upward pressure on refined product prices. The 14.1% jet fuel price increase was the largest January month-over-month increase on record, and the sixth-largest month-over-month gain overall. Jet fuel prices rose partly due to higher global travel demand, as COVID-19 travel restrictions in China were lifted. According to data from Canadian Air Transport Authority, 3.9 million passengers travelled through Canada's eight largest airports in January, more than double the number from January 2022. Prices for primary non-ferrous metal products rose 2.0% in January 2023, a fourth consecutive monthly increase, and up 6.3% compared with the same month one year earlier. The price of unwrought gold and gold alloys (+4.4%) rose in January, with spot prices peaking at around USD 1950 per ounce in late January. The rally in gold was attributable in part to its traditional use as a safe haven investment due to recession concerns, as well as purchases of gold by central banks. Prices for unwrought aluminum and aluminum alloys rose 5.2% month-over-month in January. The increase was in part attributable to strong demand in the US where premiums, or the amount paid on top of benchmark global prices, rose in January. The price of unwrought copper and copper alloys rose 6.5% month over month in January and was 1.7% lower than in January 2022. Copper production in Peru, which provides about one-tenth of the global supply, was disrupted in December and January 2023 as a result of political instability and protests. Prices for electrical, electronic, audiovisual and telecommunication products rose 4.5% in January. The increase was mainly due to higher prices for electronic and electrical parts (+6.7%), as well as electrical components (+5.0%). Prices for motorized and recreational vehicles were up 0.6% in January, mainly on higher prices for passenger cars and light trucks (+1.3%). Prices for the meat, fish, and dairy products category fell 0.4% in January. The price of fresh and frozen pork fell 2.2% month-over-month in January, a third consecutive monthly decline. This coincided with a 4.6% decrease in the price of live hogs in the Raw Materials Price Index (RMPI). The decrease in pork and hog prices was partly due to low seasonal demand as well as ample supply. Year-over-year, the price of pork was down 0.5%. Exports of pork meat declined at the end of 2022. In the fourth quarter of 2022, the value of pork exports was down by 6.0% compared with the third quarter, and down 6.2% compared with the fourth quarter of 2021. The price of fresh and frozen beef and veal was up 6.2% month-over-month in January 2023 and up 2.0% year over year. Recent rising prices for beef were partly due to tightened supply, with a drop in both domestic and US cattle slaughter numbers in the fourth quarter of 2022, while demand was strong. The price of softwood lumber fell 9.1% in January, a sixth consecutive monthly decline. On a yearly basis, the price of softwood lumber was down 53.0%, the biggest year-over-year drop for the series on record. The downward trend occurred amidst a slowing housing market and ongoing high borrowing costs. The US Federal Reserve announced a further 25 basis-point rate hike in February, putting further downward pressure on US housing demand, the primary market for Canadian softwood lumber. In January, US housing starts fell 4.5%, while Canadian housing starts declined 13.3%. Chart 2: Softwood lumber (except tongue and groove and other edge worked lumber) Raw Materials Price Index Prices for crude energy products fell 1.4% on a monthly basis, mainly on lower prices for natural gas (-21.6%). Natural gas prices fell worldwide in January due to a warmer-than-expected winter in both the US and Europe. The US benchmark price of natural gas fell 40.5% in January, and the European price fell by 44.0%. The price of conventional crude oil rose 1.3% in January. Prices for metal ores, concentrates and scrap rose 2.3% month over month, led by higher prices for gold, silver, and platinum group metal ores and concentrates (+2.6%). Prices for lead and zinc ores and concentrates (+2.2%) and copper ores and concentrates (+7.4%) were also up in January. Chart 3: Prices for raw materials fall Note to readers With each release, data for the previous six months may have been revised. The indexes are not seasonally adjusted. The IPPI reflects the prices that producers in Canada receive as goods leave the plant gate. The IPPI does not reflect what the consumer pays. Unlike the Consumer Price Index, the IPPI excludes indirect taxes and all costs that occur between the time a good leaves the plant and the time the final user takes possession of the good. This includes transportation, wholesale and retail costs. Canadian producers export many goods. Canadian producers often indicate goods' prices in foreign currencies, especially in US dollars, which are then converted into Canadian dollars. This is particularly the case for motor vehicles, pulp and paper products, and wood products. Therefore, fluctuations in the value of the Canadian dollar against its US counterpart affect the IPPI. However, the conversion to Canadian dollars reflects only how respondents provide their prices. This is not a measure that takes into account the full effect of exchange rates. The conversion of prices received in US dollars is based on the average monthly exchange rate established by the Bank of Canada and available in Table 33-10-0163-01 (series v111666275). Monthly and annual variations in the exchange rate, as described in the release, are calculated according to the indirect quotation of the exchange rate (for example, CAN$1 = US$X). The RMPI reflects the prices paid by Canadian manufacturers for key raw materials. Many of those prices are set on the world market. However, as few prices are denominated in foreign currencies, their conversion into Canadian dollars has only a minor effect on the calculation of the RMPI. Products The video "Producer price indexes" is available on the Statistics Canada Training Institute webpage. It introduces Statistics Canada's producer price indexes—what they are, how they are made and what they are used for. Addition of a new table and additional data Next release Contact information Industry Intelligence Editor's Note: This press release omits select charts and/or marketing language for editorial clarity. Click here to view the full report.
In January 2023, the Industrial Product Price Index increased 0.4% month over month, following two consecutive months of declines, and rose 5.4% year over year.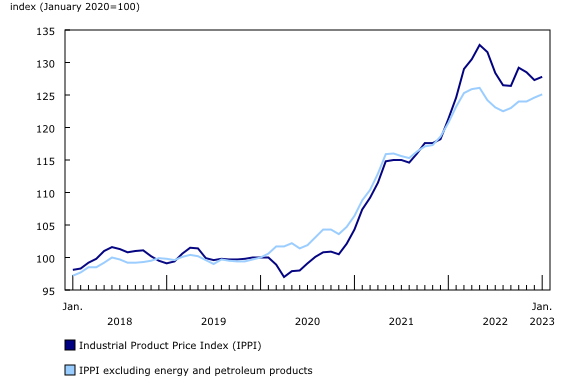
In January 2023, the RMPI edged down 0.1% month over month, a third consecutive monthly decline. Year over year, the index rose by 1.2%.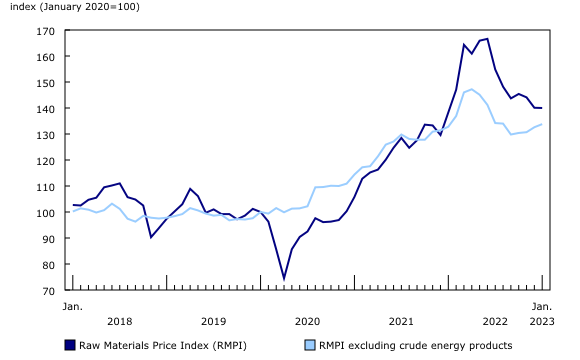
The Industrial Product Price Index (IPPI) and the Raw Materials Price Index (RMPI) are available at the Canadian level only. Selected commodity groups within the IPPI are also available by region.
Statistics Canada launched the Producer Price Indexes Portal as part of a suite of portals for prices and price indexes. This webpage provides Canadians with a single point of access to a variety of statistics and measures related to producer prices.
Effective February 28, 2022, table 18-10-0272-01 has been added to the Statistics Canada website featuring regional indexes for select refined petroleum products. In addition, tables 18-10-0266-01 and 18-10-0268-01 now contain data for select six- and seven-digit North American Product Classification System series.
The industrial product and raw materials price indexes for February 2023 will be released on March 17.
For more information, or to enquire about the concepts, methods or data quality of this release, contact us (toll-free 1-800-263-1136; 514-283-8300; infostats@statcan.gc.ca) or Media Relations (statcan.mediahotline-ligneinfomedias.statcan@statcan.gc.ca).
* All content is copyrighted by Industry Intelligence, or the original respective author or source. You may not recirculate, redistrubte or publish the analysis and presentation included in the service without Industry Intelligence's prior written consent. Please review our terms of use.


