March 2, 2022
(press release)
–
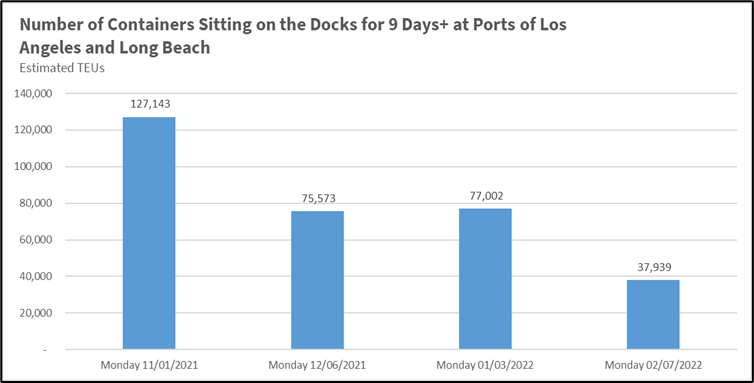
As a result of the strength of the recovery under President Biden, which helped create more than 6 million jobs, and the fastest quarter of economic growth since the mid-1980s, increases in cargo volume mean that our supply chains – particularly our ports, rail, and trucking that move goods throughout the country – have been stressed like never before. A shift from services to goods consumption as a result of the pandemic paired with both pandemic-induced supply and labor challenges and our aging infrastructure have caused disruptions across our supply chains. Over the course of the past year, as part of the President’s Supply Chain Disruptions Task Force, the Department of Transportation (USDOT), along with the Departments of Commerce and Agriculture, have been part of an administration-wide effort to improve the flow of goods, make our supply chains more resilient, and lower prices for Americans. Freight and logistics supply chains are largely operated by the private sector. To support greater transparency about the state of our transportation supply chains, last fall, the Task Force released a dashboard tracking real-time challenges and progress across four key metrics. Now, USDOT will continue to track those four metrics and expand it to include others to help build out a more complete picture of the logistics and transportation situation. USDOT’s Transportation Supply Chain Indicators Tracker (Tracker) will provide updates on key supply chain data -- including measures and indicators of intermodal throughput such as volumes of U.S. imports and exports, transportation labor numbers, the number of container ships anchored and loitering near U.S. ports, and more. The Tracker will give an in-depth look at how goods are moving through our supply chains, where there is progress, and where more work is needed. The release of the Tracker shows that imports reached record highs last year, as a result of surging demand, and despite record-high throughput, our supply chains faced challenges, including more containerships waiting to unload in the U.S. during the second half of the year. In part, as a result of the Administration’s efforts working with private sector and other stakeholders, there has been important progress: a 70% improvement in long-dwelling containers at key West-Coast ports, and in recent weeks, fewer containerships waiting to unload. USDOT and the Administration will continue to vigorously monitor our supply chains, and work toward continued improvements. The Tracker is a collaboration across many departments intended to provide information about critical supply chains to the public. it will be updated over time, including additions and adjustments as data and information are refined. USDOT and other members of the Biden-Harris Supply Chain Disruptions Task Force are working closely with private companies and public agencies to address supply chain disruptions and improve the movement of goods across the country. The following measures are provided in this update: Non-Transportation Supply Chain Measures Imports and Exports: Monitoring containerized imports and exports helps identify potential capacity constraints and stresses to U.S. supply chains. 1/ There has been a sustained increase in containerized imports to U.S. ports. Chart depicts the total volume of containerized imports and exports (measured as Twenty-foot Equivalent Units (TEUs)) moved through U.S. ports for each month in 2019, 2020, and 2021. 2/ Increased container import volume has been observed at many ports, compared to pre-pandemic levels. Chart depicts total volume of containerized imports (measured as Twenty-foot Equivalent Units (TEUs)) at select U.S. ports overall since January 2019. 3/ Since the middle of 2021, the number of container ships waiting for a dock at a U.S. port has more than doubled, though recently, has declined for some of the largest U.S. container ports. Chart depicts the total number of container ships waiting for an available dock at U.S. ports overall (solid line) and select major port complexes (dashed lines). 4/ In late October 2021, the Ports of Los Angeles and Long Beach, which account for around 37% of all U.S. containerized imports, announced intentions to levy fees on long dwelling containers. Since that time, nearly 90,000 fewer are dwelling more than 9 days on the ports—a 70% improvement. Chart depicts the total number of imported containers sitting at terminals at the Ports of Los Angeles and Long Beach for 9 days or more, (i.e. long-dwelling). The chart shows the approximate total of long dwelling containers reported on the first Monday of each month since November 2021. Estimated TEU measure is calculated using a standard practice of multiplying total units reported by the ports by a factor of 1.8. 5/ In 2021, job openings increased substantially, outpacing a slight increase in hiring, in the Transportation, Warehousing, and Utilities sector. Chart depicts job openings and labor turnover in the Transportation, Warehousing, and Utilities sector of the economy, by month. 6/ As of January 2022, the trucking industry has recovered 70,000 workers since one year earlier, and sits at around 30,000 higher than at start of the pandemic. Chart depicts the number of employees working in the truck transportation subsector of the economy, on a monthly basis, and includes the drivers, mechanics, managers, and laborers/movers involved in this sector. Self-employed drivers, known as owner-operators, are not included in this measure. 7/ Intermodal movements by freight rail have generally trended at or above pre-pandemic (2019) levels. Chart depicts how many shipping containers and truck trailers are moved on rail cars in a given week on U.S. Class I Railroads. Approximately half of all railroad carloads are intermodal. Non-Transportation Supply Chain Indicators 8/ Retail inventories excluding autos were more than 4 percent above pre-pandemic levels at the end of December. Higher frequency datafrom grocery and drug stores show that the share of products that were in stock was 88 percent compared to 91 percent on February 23, 2020. Chart depicts the inflation-adjusted value of the goods in retailers’ warehouses and on their shelves excluding motor vehicle and parts dealers
1. U.S. container imports & exports at ports, overall
2. U.S. container imports, at major ports
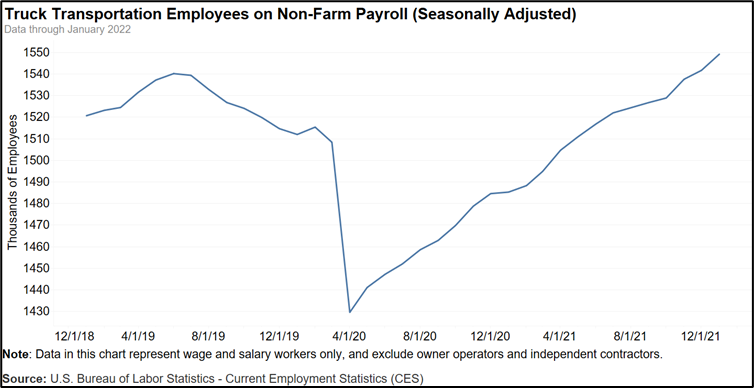
3. Container ships awaiting berths at U.S. Ports
4. Ports of Los Angeles and Long Beach container dwell time
5. Sector job openings, hires, and quits
6. Truck employment count
7. Rail intermodal volume
8. U.S. Retail Inventories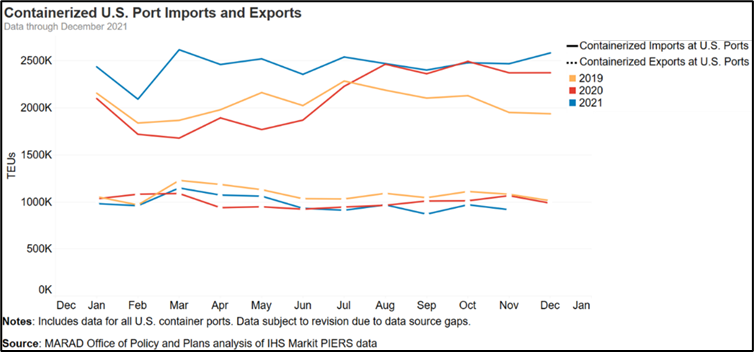

Ships and Containers: Monitoring the number of ships waiting for berths at U.S. ports, and the rate at which imported containers move inland from the ports, can help measure disruptions in supply chains, including at original port of call, port of destination, and inland modes. 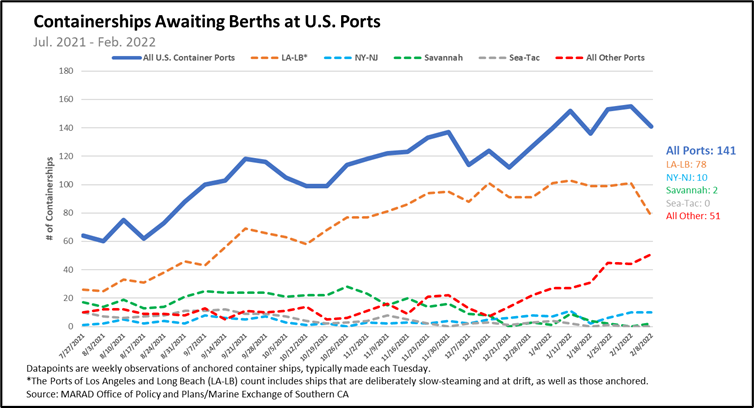
Workforce: Monitoring job openings and employment trends across the sector helps understand how labor capacity may impact supply chain fluidity. 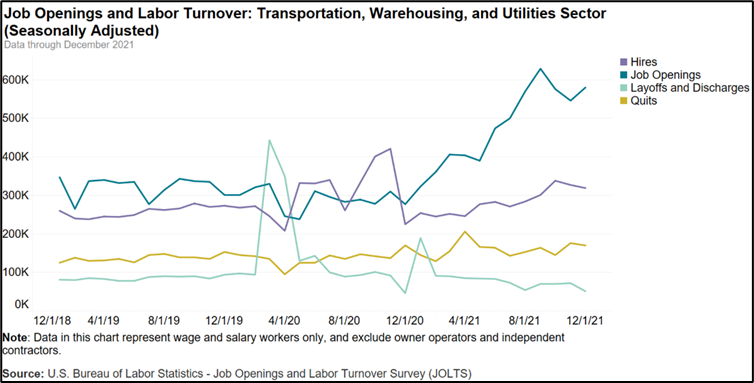
Rail: Measuring and monitoring intermodal units moved by rail helps identify capacity constraints on U.S. railroads and potential stresses to U.S. supply chains, overall.

* All content is copyrighted by Industry Intelligence, or the original respective author or source. You may not recirculate, redistrubte or publish the analysis and presentation included in the service without Industry Intelligence's prior written consent. Please review our terms of use.


