Coty reports fiscal Q3 net revenues grew 8% year-over-year, reflecting growth in both Prestige and Consumer Beauty across all regions and core categories; prestige fragrance revenues grew 7% on market share gains from Burberry, Marc Jacobs, Kylie launches
NEW YORK - May 6, 2024-- Coty Inc. (NYSE: COTY) ("Coty" or "the Company") today announced its results for the third quarter of fiscal year 2024, ended March 31, 2024. The Company's strong above-market sales growth, reported and adjusted operating income growth, and reported and adjusted gross and operating margin expansion in Q3 solidifies nearly four years of Coty reporting results in-line to ahead of expectations.
In 3Q24, Coty's net revenues grew 8% on a reported basis and 10% on a LFL basis, with reported and LFL results supported by growth in fragrances, color cosmetics, skin care and body care. These results trended above the Company's guidance of +6-8% LFL for the second half of FY24. On a year-to-date basis, net revenues grew 13% on both a reported and LFL basis. In 3Q24 and year-to-date, the Company continued to deliver balanced reported net revenue growth, including growth in both Prestige and Consumer Beauty, across all regions and in each of its core categories partially offset by a 2% headwind in Q3 from the divestiture of the Lacoste license. In Q3 and year-to-date, Coty delivered a healthy reported growth mix with low to mid-single-digit percentage volume growth and estimated high-single-digit percentage pricing contribution, with the estimated impact from mix & other slightly negative in Q3, but a positive low-single-digit contribution fiscal year-to-date.
In 3Q24, Prestige net revenues increased 8% on a reported basis and 13% on a LFL basis. On a year-to-date basis, Prestige net revenues grew a strong 17% on both a reported and LFL basis. In 3Q24 and year-to-date, reported net revenue growth in Prestige remained strong in fragrances, cosmetics and skin care, but Q3 included a 4% negative impact from the divestiture of the Lacoste license and a 1% negative impact from FX.
In 3Q24, Consumer Beauty net revenues increased 6% on a reported and LFL basis. On a year-to-date basis, Consumer Beauty revenues increased 8% on a reported basis and 7% on a LFL basis. In 3Q24 and year-to-date, Consumer Beauty's reported net revenues grew in color cosmetics, mass fragrances and mass skin & body care in most countries, offsetting the market weakness in U.S. mass cosmetics.
Strong reported net sales momentum in 3Q24 was supported by high-single-digit percentage growth in all regions, and on a year-to-date basis, all regions generated double-digit percentage reported net revenue growth. In Prestige, Coty gained market share in all three regions in Q3. Americas net revenues rose 8% on a reported basis and 11% on a LFL basis in Q3. Reported net revenue growth in Americas was driven by strong double-digit percentage growth in Latin America, Canada and the Travel Retail channel partially offset by a 2% negative impact from FX and a 1% headwind from the divestiture of the Lacoste license. In Q3, EMEA's net revenues increased 7% on a reported basis and 9% on a LFL basis. Reported net revenue growth in EMEA was driven by continued growth across most markets and the Travel Retail channel, coupled with a 2% FX benefit partially offset by a 4% headwind from the divestiture of the Lacoste license. In Q3, Asia Pacific sales grew 7% on a reported basis and 11% on a LFL basis. Reported net revenue growth in Asia Pacific was driven by double-digit percentage growth in Asia excluding China and the Travel Retail channel, and triple-digit percentage growth in Hainan, partially offset by a 3% negative impact from FX.
Coty delivered strong gross margin expansion in the quarter. 3Q24 reported and adjusted gross margin of 64.8% increased 190 basis points year-over-year. Coty's Q3 reported gross margin improvement was driven by the benefit from premiumization, carryover pricing and easing inflation, as well as supply chain productivity savings. Coty generated reported operating income of $77.8 million, up 79% year-over-year, supported by strong sales and gross profit, resulting in 220 basis points of reported operating margin expansion to 5.6%. Coty's Q3 adjusted operating income of $143.9 million grew 17% year-over-year resulting in 90 basis points of adjusted operating margin expansion to 10.4%. Q3 reported net income of $0.5 million with a breakeven reported net income margin decreased from net income of $105.1 million in the prior year. Adjusted net income of $43.8 million decreased from $168.1 million. The decline in both reported and adjusted net income was fully driven by mark-to-market gains from forward repurchase contracts in the prior period compared to mark-to-market losses in the current period, partially offset by higher operating income in the current period. Q3 adjusted EBITDA of $199.9 million grew 10% year-over-year, which drove an increase in adjusted EBITDA margin of 30 basis points to 14.4%.
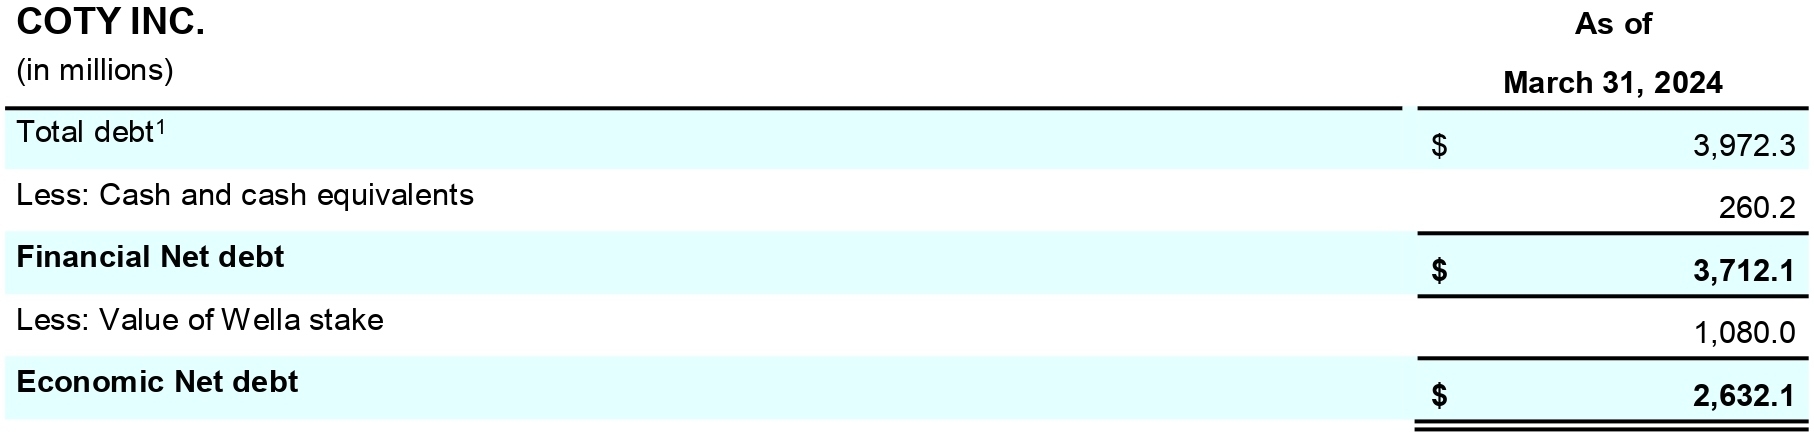
In Q3, cash flow from operating activities was $(170.0) million and free cash flow was $(234.3) million consistent with the Company's seasonally weaker cash flow period. The seasonally low Q3 cash from operating activities and free cash flow was further pressured by the payment of taxes for prior years and the timing of working capital payments, the latter of which is expected to reverse in the fourth quarter. On a year-to-date basis, cash flow from operating activities was $438.1 million and free cash flow was $252.7 million. Total debt at the end of the third quarter totaled $3,972.3 million, while financial net debt totaled $3,712.1 million. This drove the total debt to net income ratio to 16.5x and the financial leverage ratio (net debt to adjusted EBITDA) to 3.4x. Coty’s retained 25.8% Wella stake was valued at $1,080.0 million at quarter-end, supporting economic net debt of $2,632.1 million.
Updates on Strategic Pillars
The prestige fragrance market, whose growth accelerated sequentially to a mid-teens percentage in Q3, coupled with Coty’s market share gains, fueled strong prestige fragrances net revenue growth across multiple brands. Coty's prestige fragrance revenues grew approximately 7% as reported and 12% LFL in Q3, and approximately 18% as reported and LFL on a year-to-date basis, fueled by strength in existing icons coupled with the contribution from new launches. Burberry Goddess, Coty's biggest launch ever, continues to be a top global female fragrance launch, which coupled with strong growth in other Burberry franchises, drove over 50% expansion in Burberry's total net revenues in Q3. Building on this launch momentum, Marc Jacobs Daisy Wild and Cosmic Kylie Jenner are ranking as the Top 2 fragrance launches in the U.S. calendar year-to-date, reinforcing Coty's position as a fragrance leader. Coty's prestige cosmetics business saw very strong momentum with reported net revenue growth of over 25% in the quarter, led by its three prestige cosmetics brands, Burberry, Kylie and Gucci.
Coty's Consumer Beauty growth in the quarter mirrored the mid-single-digit percentage growth of the global mass beauty market. Strong momentum in mass fragrance, skin & body care, and mass color cosmetics in most countries offset softness in the mass color cosmetics category in the United States. Coty’s continues to make strong strides in its social media advocacy strategy to drive improvements in earned media value and propel viral Consumer Beauty launches including CoverGirl Simply Ageless Skin Perfector Essence, CoverGirl Outlast Lipstain and Rimmel Wonder’Bond mascara. As a result, both CoverGirl in the U.S. and Rimmel in the U.K. reached Top 4 rankings for earned media value in their respective core markets.
Coty’s prestige skincare business grew reported net revenues by a high-single-digit percentage in Q3 led by robust double-digit growth from Lancaster.
Coty e-commerce channel net revenue growth was nearly 20% in Q3, following over 20% growth in 1H24. As a result, year-to-date e-commerce penetration increased approximately 190 basis points year-over year to approximately 20%. In Prestige, double-digit percentage e-commerce channel growth was driven by new product launches during the quarter, including Cosmic Kylie Jenner and Marc Jacobs Daisy Wild, coupled with strong social media activations and collaboration with e-retail partners. In Consumer Beauty, e-commerce growth of approximately 30% was supported by nearly all regions, led by the U.S., LATAM and Europe. Coty gained e-commerce market share in both segments.
The Company maintained momentum in high growth markets and channels. Coty's global Travel Retail trends were robust in all three regions, fueling reported net revenue growth of roughly 20% in Q3. In China, Coty’s Prestige business generated reported net revenue growth in the mid-teens percentage. The Company's momentum in growth engine markets continued to be robust, with mid-to-high teens reported revenue growth and over 20% LFL growth in Q3 and year-to-date, led by strength in Brazil, the rest of LATAM, Southeast Asia, including India, and Africa.
Coty continued to make progress on its sustainability pillar during Q3, including improving several of its ESG ratings over the past year and transitioning additional supply chain sites, labs and offices to carbon neutral, bringing the total to eight carbon neutral1 locations.
"Our Q3 results reinforce Coty's established track record of delivering results ahead of the beauty market and ahead of expectations, and once again illustrate that we are executing on our imperative to drive balanced portfolio growth. In both Q3 and fiscal year-to-date, we delivered strong growth in both the Prestige and Consumer Beauty businesses, in each of our three regions, and in our core categories of fragrances, color cosmetics, skin care and body care, all supported by a broad range of our leading brands.
Coty's global and multi-category presence is proving to be a key area of strength and differentiation, as subdued trends in a very few markets and subcategories, such as U.S. mass cosmetics, are more than offset by continued strong momentum in the majority of our core business areas, including global prestige and mass fragrances, where our business grew by a low-double-digit percentage, and prestige cosmetics, where our sales grew over 20%. In fact, in Prestige fragrances, we've seen category growth trends accelerate over the course of the quarter, speaking to the continued appeal of fragrances to a broad set of consumers. And in this favorable backdrop, Coty is gaining prestige fragrance market share across regions.
Our execution in our core businesses remains top notch. Building on our track record of leading fragrance launches in FY22 and FY23, we are elevating our leadership further with the blockbuster launch last fall of Burberry Goddess, which continues to grow and exceed all prior Coty benchmarks, and now in the spring the very successful launches of Marc Jacobs Daisy Wild and Cosmic Kylie Jenner, which are the #1 and #2 fragrance launches in the U.S. calendar year-to-date, respectively.
In our color cosmetics business, first-to-market innovations like CoverGirl's Simply Ageless Skin Perfector Essence and Rimmel's Wonder’Bond mascara are resonating with consumers, while both brands are making strong strides in accelerating their advocacy across social media platforms. Both CoverGirl and Rimmel now rank in the Top 4 in terms of earned media value in their core markets of U.S. and U.K., respectively, which is a significant improvement from last year.
We are also complementing our core business momentum by unlocking white space opportunities. This quarter marked a major milestone, as we launched our Coty-branded Infiniment Coty Paris fragrance collection, revolutionizing the fragrance category once again through market-leading advances in the formula, packaging, artcycling and merchandising. As we build both Infiniment Coty Paris and our leading ultra premium fragrance collections, we look to capture a bigger slice of the booming ultra premium fragrance market.
Similarly, our skincare momentum also continues to build with acceleration in Lancaster across both Europe and China, top industry awards and growing productivity for Orveda, and strong momentum in philosophy's social media resonance.
Our growth is further reinforced by our strong e-commerce momentum with our online sales expanding approximately 20% in both Q3 and fiscal year-to-date and now accounting for one fifth of our business. I am particularly proud of our market share expansion in this critical channel, with share gains in both Prestige and Consumer Beauty.
We are unlocking geographic white spaces as well, as our high-single-digit growth in developed markets was complemented by over 20% LFL expansion in growth engine markets, including Brazil, the rest of LATAM, Southeast Asia, including India, and Africa.
We are achieving these strong results and milestones all while delivering robust profit growth and margin expansion. This is enabling us to raise the midpoint of our FY24 guidance for the third time this year. Our focus is to continue to fuel this flywheel, delivering steady margin expansion, cash flow improvement and deleveraging progress.
In sum, we continue to see a strong and dynamic beauty market, with our diversified portfolio and strong execution enabling Coty to once again outperform the underlying market. As we continue to reinforce our position as a beauty powerhouse, in our 120th anniversary year, we remain excited by the many opportunities ahead."
1 For Scope 1 and 2 emissions.
*Adjusted financial metrics used in this release are non-GAAP.
See reconciliations of GAAP results to Adjusted results in the accompanying tables.
* These measures, as well as “free cash flow,” “adjusted earnings before interest, taxes, depreciation and amortization (adjusted EBITDA),” “financial net debt,” and "economic net debt" are Non-GAAP Financial Measures. Refer to “Non-GAAP Financial Measures” for discussion of these measures. Reconciliations from reported to adjusted results can be found at the end of this release.
** Net income for Coty Inc. is net of the Convertible Series B Preferred Stock dividends.
Financial Highlights
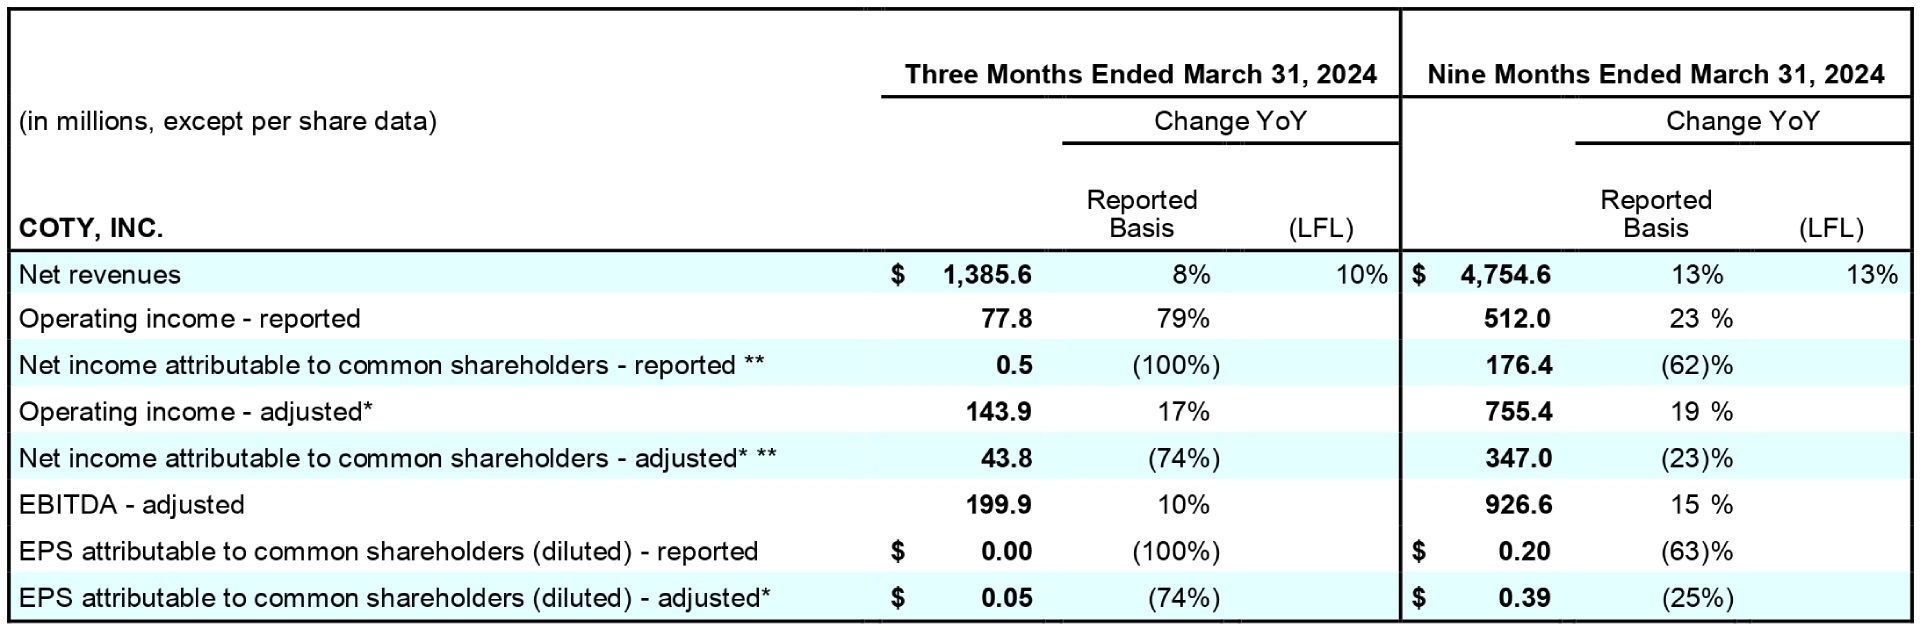
3Q24 net revenues increased 8% on a reported basis and 10% LFL driven by growth in Prestige net revenues of 8% reported and 13% LFL, an increase in Consumer Beauty net revenues of 6% reported and LFL and includes a 2% headwind from the divestiture of the Lacoste license. Year-to-date net revenues increased 13% on a reported basis fueled by a 17% increase in Prestige reported net revenues and an 8% increase in Consumer Beauty reported net revenues. Year-to-date net revenues increased 13% LFL.
3Q24 reported operating income grew 79% to $77.8 million with a reported operating margin of 5.6% reflecting 220 basis points of margin expansion. Year-to-date reported operated income increased 23% to $512.0 million with a reported operating margin of 10.8% reflecting 90 basis points of margin expansion.
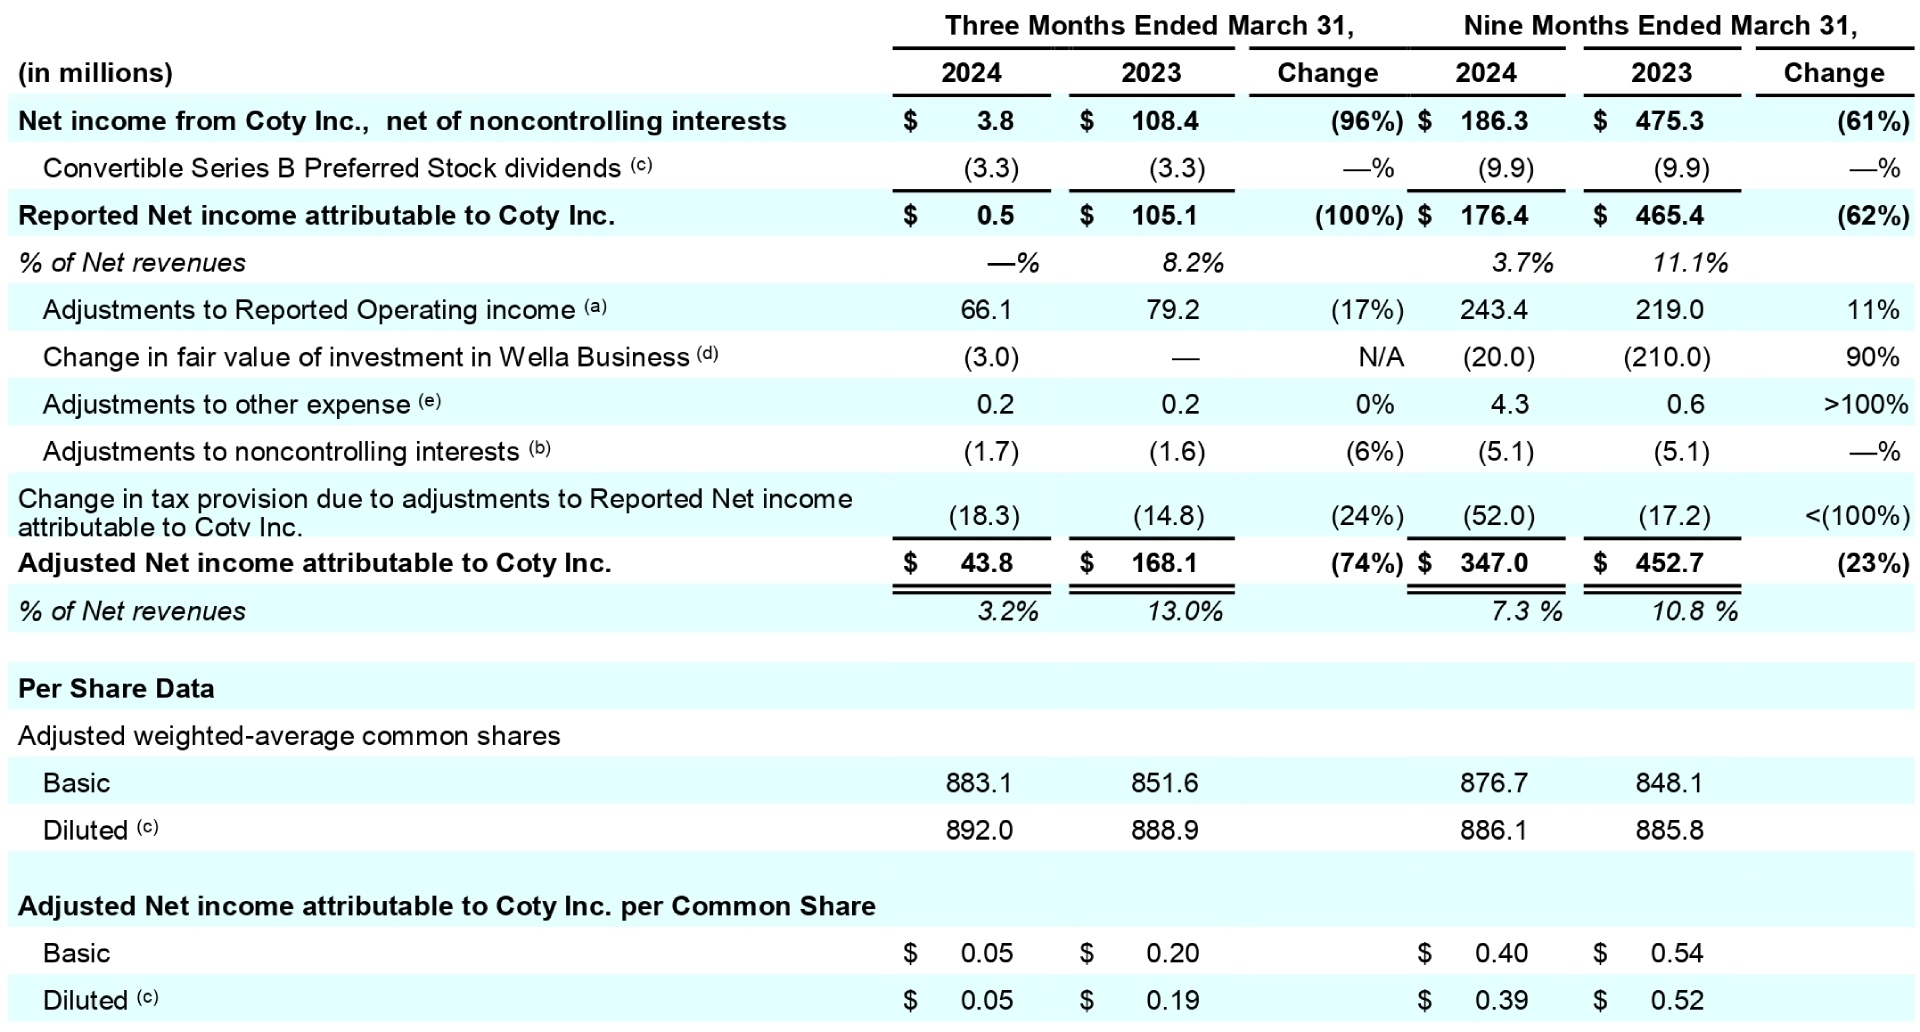
3Q24 reported net income of $0.5 million decreased from net income of $105.1 million in the prior year driven by a large benefit in the prior year from the mark-to-market on the equity swap. In 3Q24, reported net income margin was breakeven. Year-to-date reported net income of $176.4 million decreased from $465.4 million in the prior year and reported net income margin was 3.7%.
3Q24 reported EPS was $0.00 and year-to-date reported EPS was $0.20.
3Q24 adjusted operating income increased 17% to $143.9 million with an adjusted operating margin of 10.4% reflecting 90 basis points of margin expansion. On a year-to-date basis, adjusted operating income increased 19% to $755.4 million with an adjusted operating margin of 15.9% reflecting 80 basis points of margin expansion.
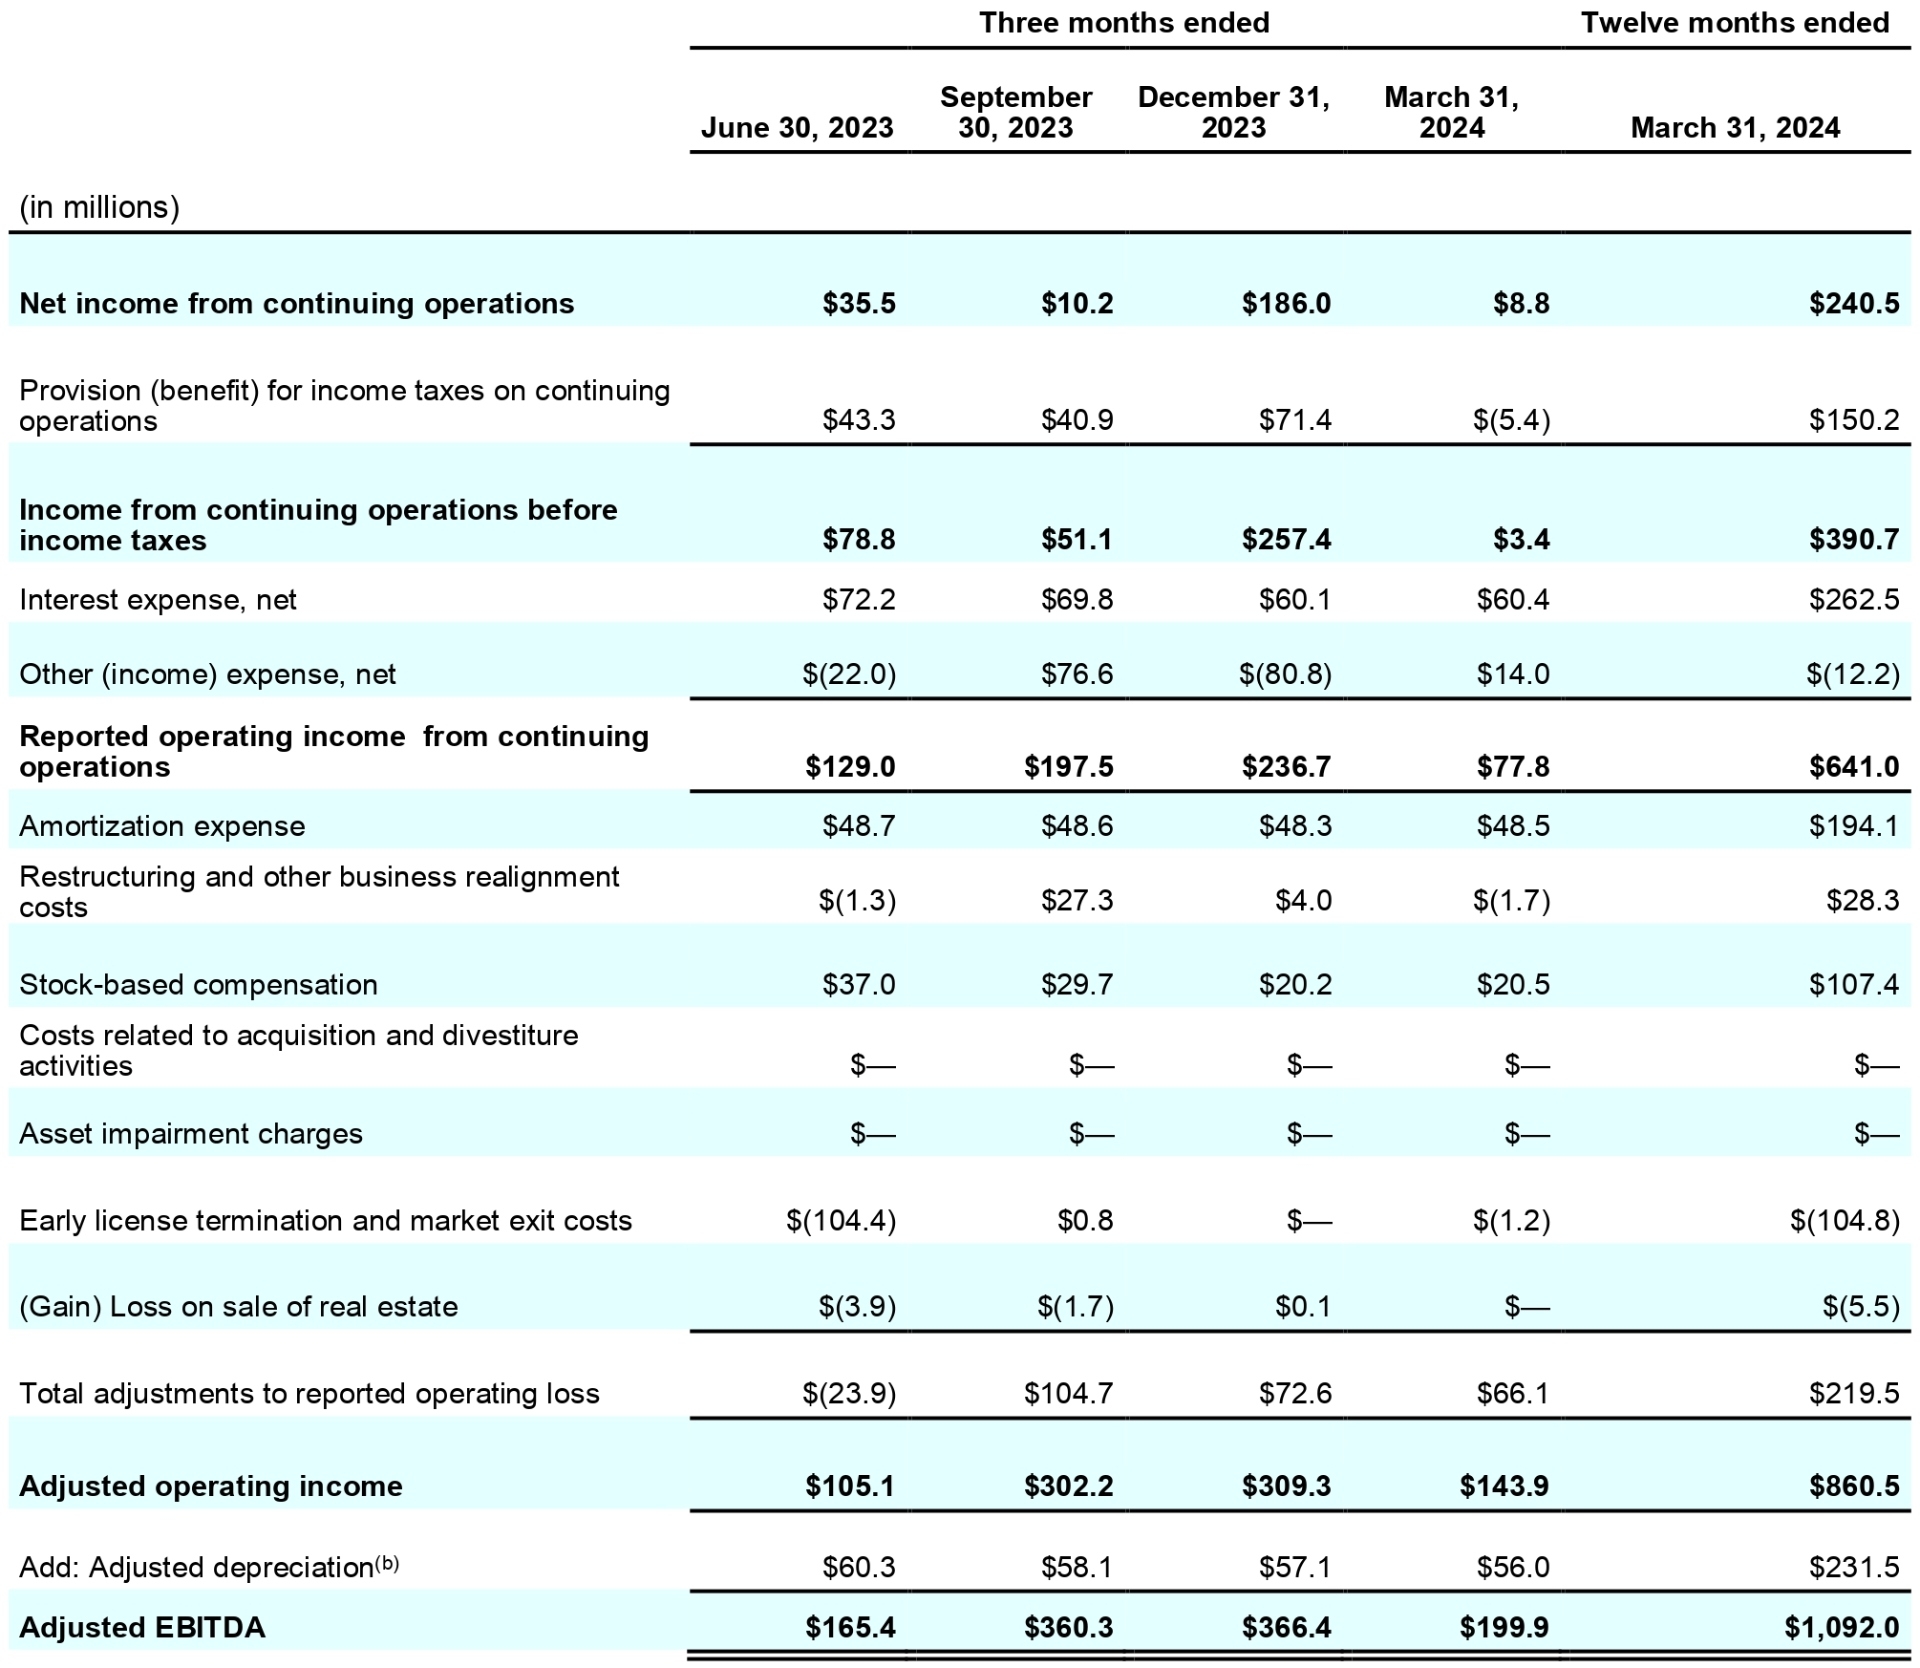
3Q24 adjusted EBITDA grew 10% to $199.9 million with an adjusted EBITDA margin of 14.4% reflecting 30 basis points of margin expansion. Year-to-date adjusted EBITDA grew 15% to $926.6 million driving a year-to-date adjusted EBITDA margin of 19.5%, up 30 basis points year-over-year.
3Q24 adjusted EPS totaled $0.05 and included a non-operating negative impact to EPS of $0.01 from the mark-to-market on the equity swap due to the stock price decline in Q3. The year-to-date adjusted EPS of $0.39 included a non-operating negative impact to EPS of $0.02 from the mark-to-market on the equity swap compared with a $0.14 benefit from the mark-to-market on the equity swap in the prior year.
Savings totaled approximately $25 million in Q3 and over $90 million year-to-date. Coty continues to expect savings of $110-120 million in FY24.
3Q24 cash flow from operating activities totaled $(170.0) million and free cash flow totaled $(234.3) million. On a year-to-date basis, cash flow from operating activities was $438.1 million and free cash flow totaled $252.7 million.
Total debt was $3,972.3 million, while financial net debt totaled $3,712.1 million resulting in total net debt to income ratio of 16.5x and a financial leverage ratio of 3.4x. The value of Coty's 25.8% Wella stake was stable at $1,080.0 million at quarter-end, supporting Coty's economic net debt of $2,632.1 million.
The Company repurchased 27 million shares on February 22, 2024 as part of the first tranche of its previously announced equity swap agreement.
Outlook
The global beauty market remains strong with demand for prestige fragrances continuing to grow at a double-digit percentage pace and above historical levels, while the mass beauty market is performing consistent with historical levels, growing at a mid-single-digit percentage. Coty continues to benefit from this attractive market dynamic with momentum across its core categories, strong launch results and early wins in key white spaces. The Company now expects FY24 LFL revenue growth to be at the high end of its prior guidance range of +9-11%, which includes expectations for low-to-mid single-digit percentage LFL revenue growth in Q4 reflecting an estimated mid-single-digit percentage headwind in its Prestige business from difficult prior year comparisons, when retailers restocked inventory as Coty's fragrance service levels recovered from earlier shortages. Reported revenues in Q4 are expected to include a 1-2% headwind from FX and an approximately 2% scope headwind from the divestiture of the Lacoste license. At the same time, the strong continued sell-out in Coty's business supports expected LFL revenue growth acceleration sequentially into first half FY25 from the levels expected in Q4.
Coty also expects FY24 adjusted EBITDA margin expansion to be at the upper of end of its previous guidance range of 10 to 30 basis points. At the same time, FX headwinds in Q4 are contributing to Coty's expectations for FY24 adjusted EBITDA to remain within its prior guidance range of $1,080 to $1,090 million based on current FX rates. In total, the Company continues to expect modest FY24 gross margin expansion year-over-year. Coty now expects FY24 adjusted EPS to be at the high end of the prior guidance range, excluding the equity swap, of $0.44 to $0.47, implying strong growth at the upper end of the +16-25% guidance range.
Factoring in the timing of certain deferred payments of taxes and working capital phasing, the Company continues to expect FY24 free cash flow of roughly $400 million, with expected free cash flow growth in FY25.
Having reached its leverage target of approximately 3x exiting CY23, Coty remains fully on track to drive its leverage towards approximately 2.5x exiting CY24 and towards approximately 2x exiting CY25 driven by its free cash flow generation and EBITDA expansion. Coty continues to target the divestiture of its Wella stake by end of CY25.
Financial Results*
Refer to “Non-GAAP Financial Measures” for discussion of the non-GAAP financial measures used in this release; reconciliations from reported to adjusted results can be found at the end of this release.
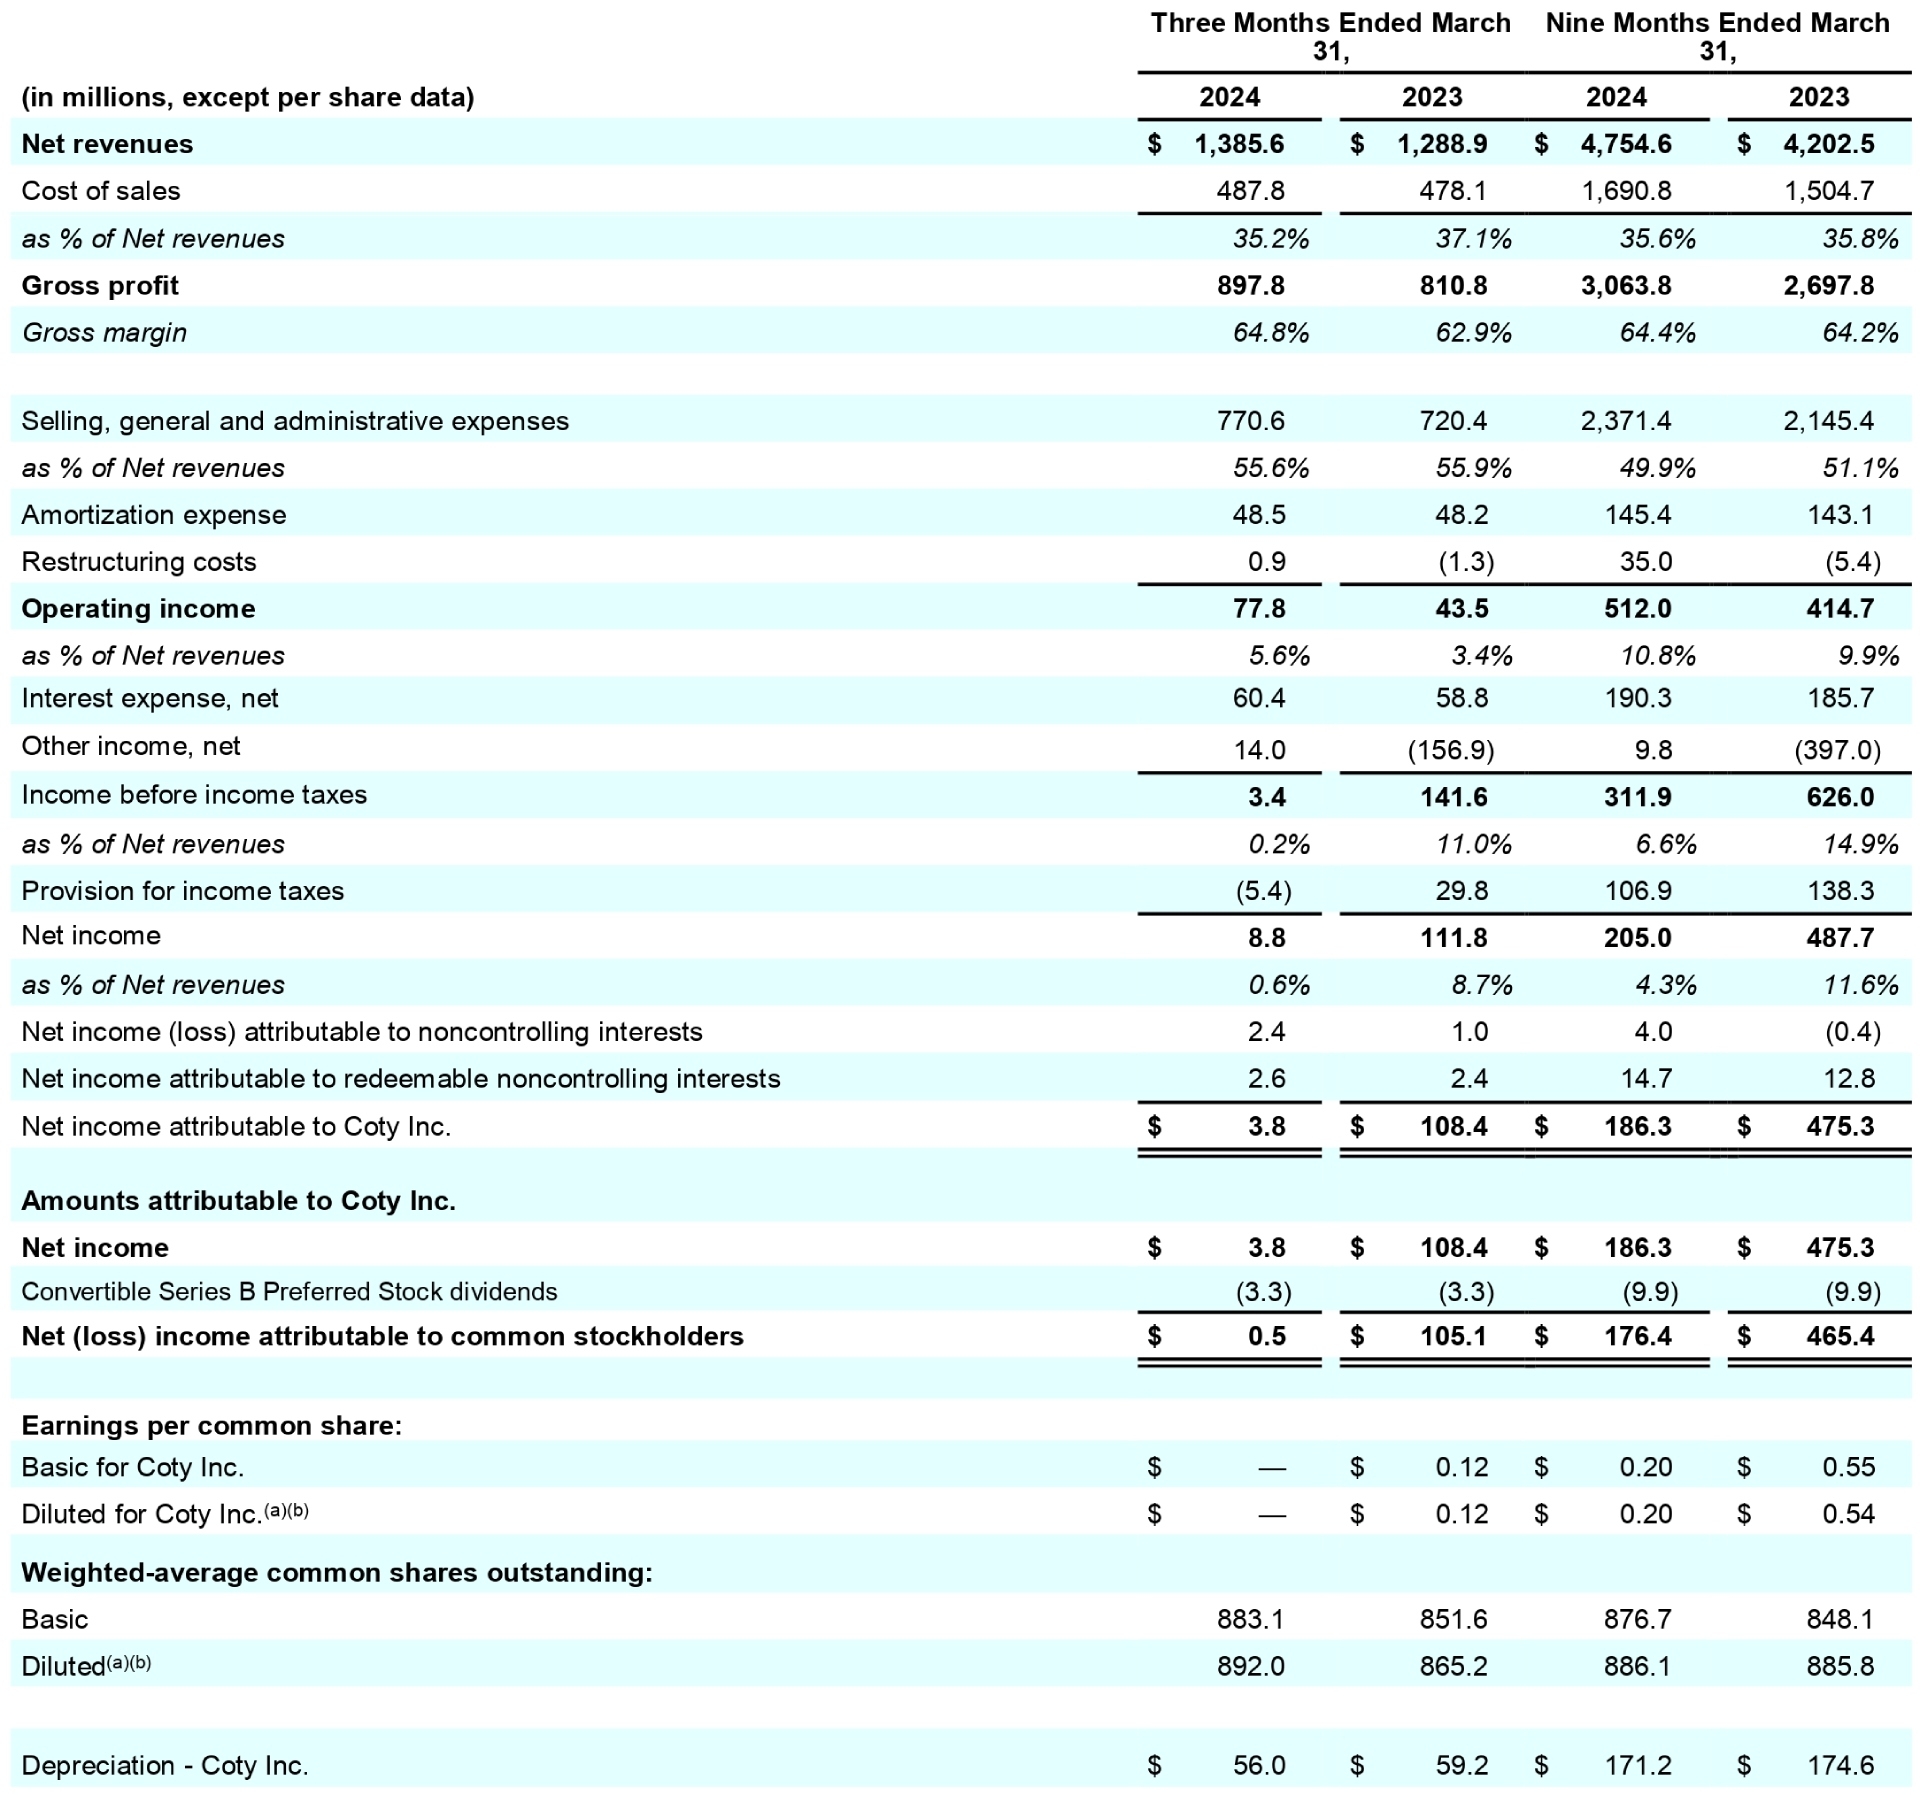
3Q24 reported net revenues of $1,385.6 increased 8% year-over-year driven by an 8% increase in Prestige reported net revenues, a 6% increase in Consumer Beauty reported net revenues and includes a 2% headwind from the divestiture of the Lacoste license. On a LFL basis, net revenues increased 10% driven by a 13% LFL increase in Prestige and a 6% LFL increase in Consumer Beauty net revenues.
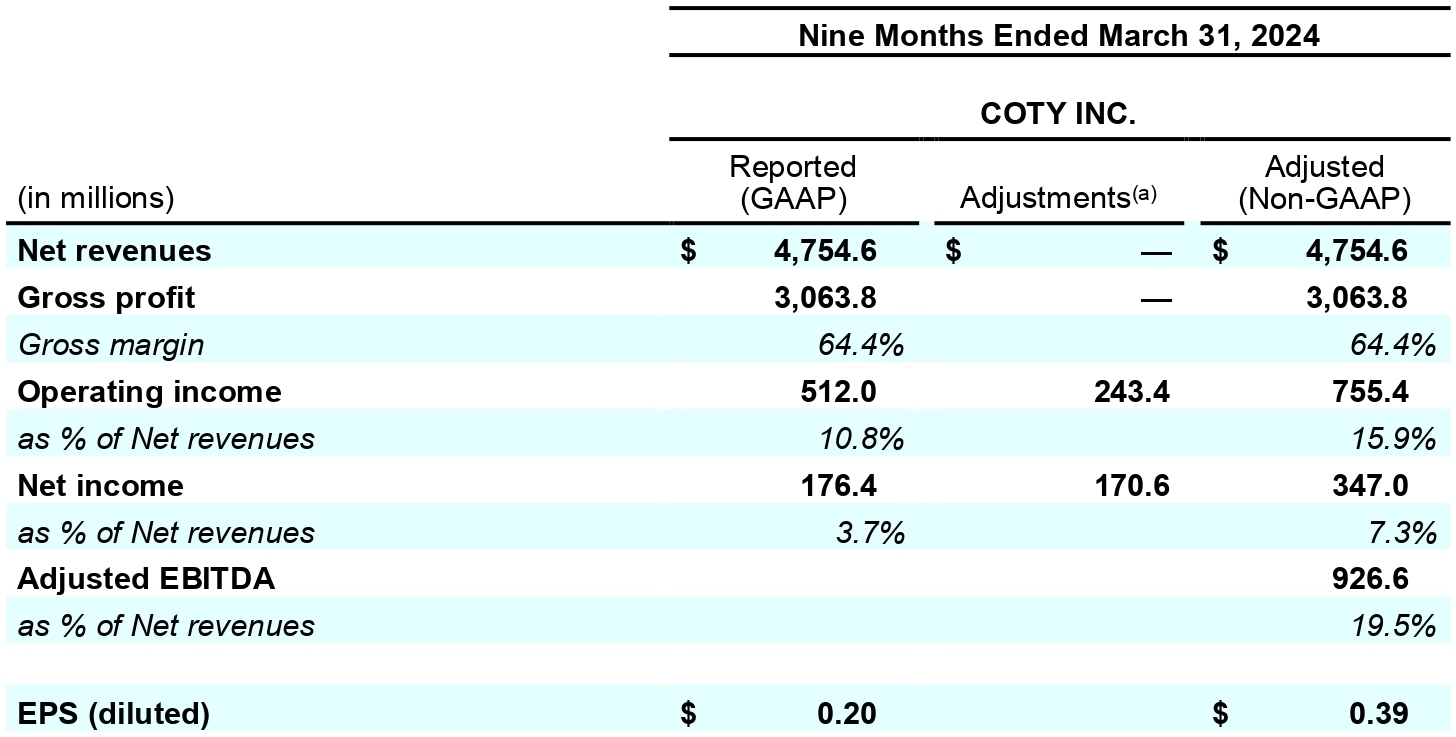
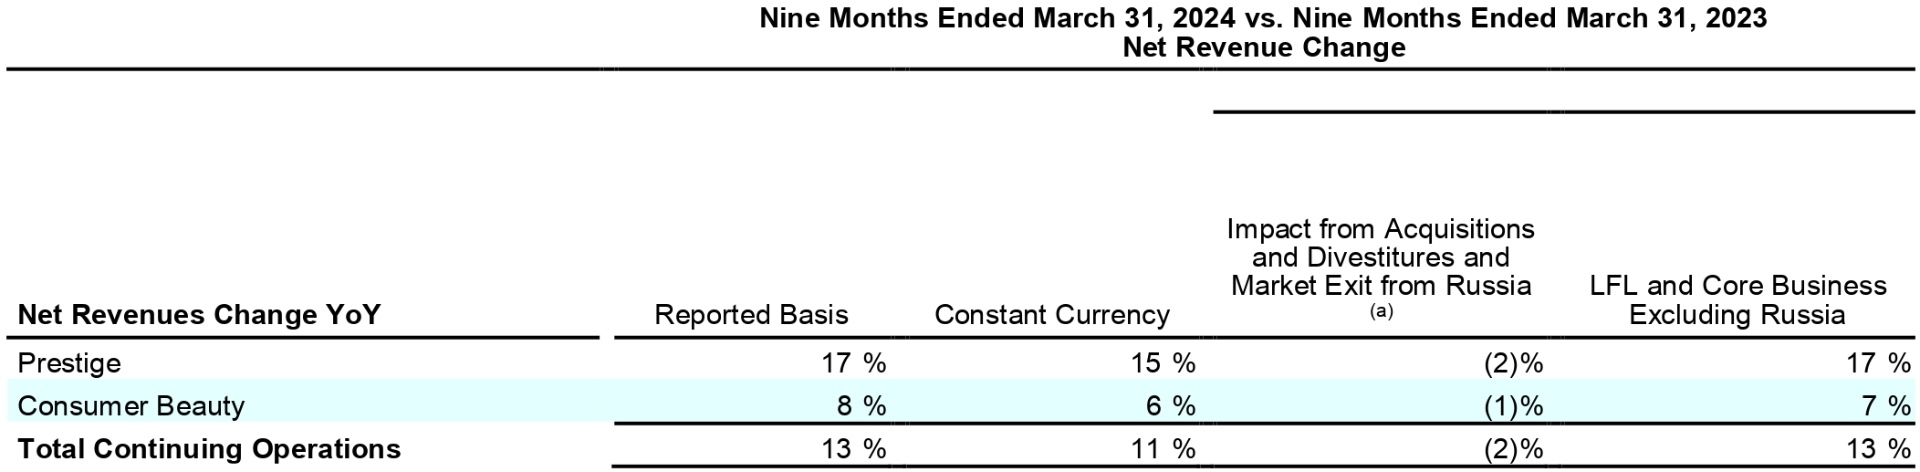
Year-to-date reported net revenues of $4,754.6 million increased 13% year-over-year driven by a 17% increase in Prestige reported net revenues and an 8% increase in Consumer Beauty reported net revenue. On a LFL basis, net revenues grew 13% driven by a 17% LFL increase in Prestige net revenues and a 7% LFL increase in Consumer Beauty net revenues.
Gross Margin:
3Q24 reported gross margin of 64.8% increased 190 basis points year-over-year. The improvement in reported gross margin was mainly driven by premiumization, carryover pricing, easing inflation, and supply chain productivity savings. 3Q24 adjusted gross margin of 64.8% increased by 190 basis points from 62.9% in the prior year.
Year-to-date reported gross margin of 64.4% increased 20 basis points year-over-year. The rise in reported gross margin reflected a positive impact from premiumization, pricing and supply chain productivity savings partially offset by a negative impact from higher excess & obsolescence, which continued to improve over the course of the year. Year-to-date adjusted gross margin of 64.4% increased from 64.2% in the prior year.
3Q24 reported operating income of $77.8 million increased by 79% from $43.5 million the prior year driven by higher sales and gross profit. 3Q24 reported operating margin was 5.6% reflecting 220 basis points of margin expansion year-over-year. The improvement in reported operating margin was driven by the strong gross margin expansion partially offset by higher A&CP and fixed costs as the Company reinvested in its strategic growth capabilities.
Year-to-date reported operating income of $512.0 million increased by 23% from $414.7 million in the prior year driven by higher sales and gross profit. Year-to-date reported operating margin was 10.8% reflecting 90 basis points of margin expansion year-over-year. The improvement in reported operating margin was driven by the strong gross margin expansion.
3Q24 reported net income of $0.5 million decreased from net income of $105.1 million in the prior year as the profit expansion was more than offset by a $133 million reversal in the benefit from the mark-to market on the equity swap. 3Q24 reported net income breakeven margin decreased 820 basis points year-over-year.
Year-to-date reported net income of $176.4 million decreased from $465.4 million in the prior year resulting in a reported net income margin of 3.7%, down 740 basis points year-over-year. This margin decline was driven by a higher fair value adjustment in the prior year period to Coty's investment in Wella, and a higher benefit in the prior year period from the mark-to-market on the equity swap.
3Q24 reported EPS of $0.00 decreased from $0.12 as profit expansion was more than offset by a $0.14 reversal in the benefit from the mark-to market on the equity swap.
Year-to-date reported EPS of $0.20 decreased from $0.54 in the prior year driven by a higher fair value adjustment for Coty's investment in Wella recorded in the prior year period and a higher benefit from the mark-to-market on the equity swap.
Adjusted Profit:
3Q24 adjusted operating income of $143.9 million rose 17% from $122.7 million in the prior year. 3Q24 adjusted operating margin was 10.4% reflecting 90 basis points of margin expansion. The improvement in adjusted operating margin was driven by the strong gross margin expansion partially offset by higher A&CP and fixed costs as the Company reinvested in its strategic growth capabilities.
Year-to-date adjusted operating income of $755.4 million increased by 19% from $633.7 million in the prior year. Year-to date adjusted operating margin was 15.9%, 80 basis points higher than the prior year. The improvement in adjusted operating margin was driven by the strong gross margin expansion.
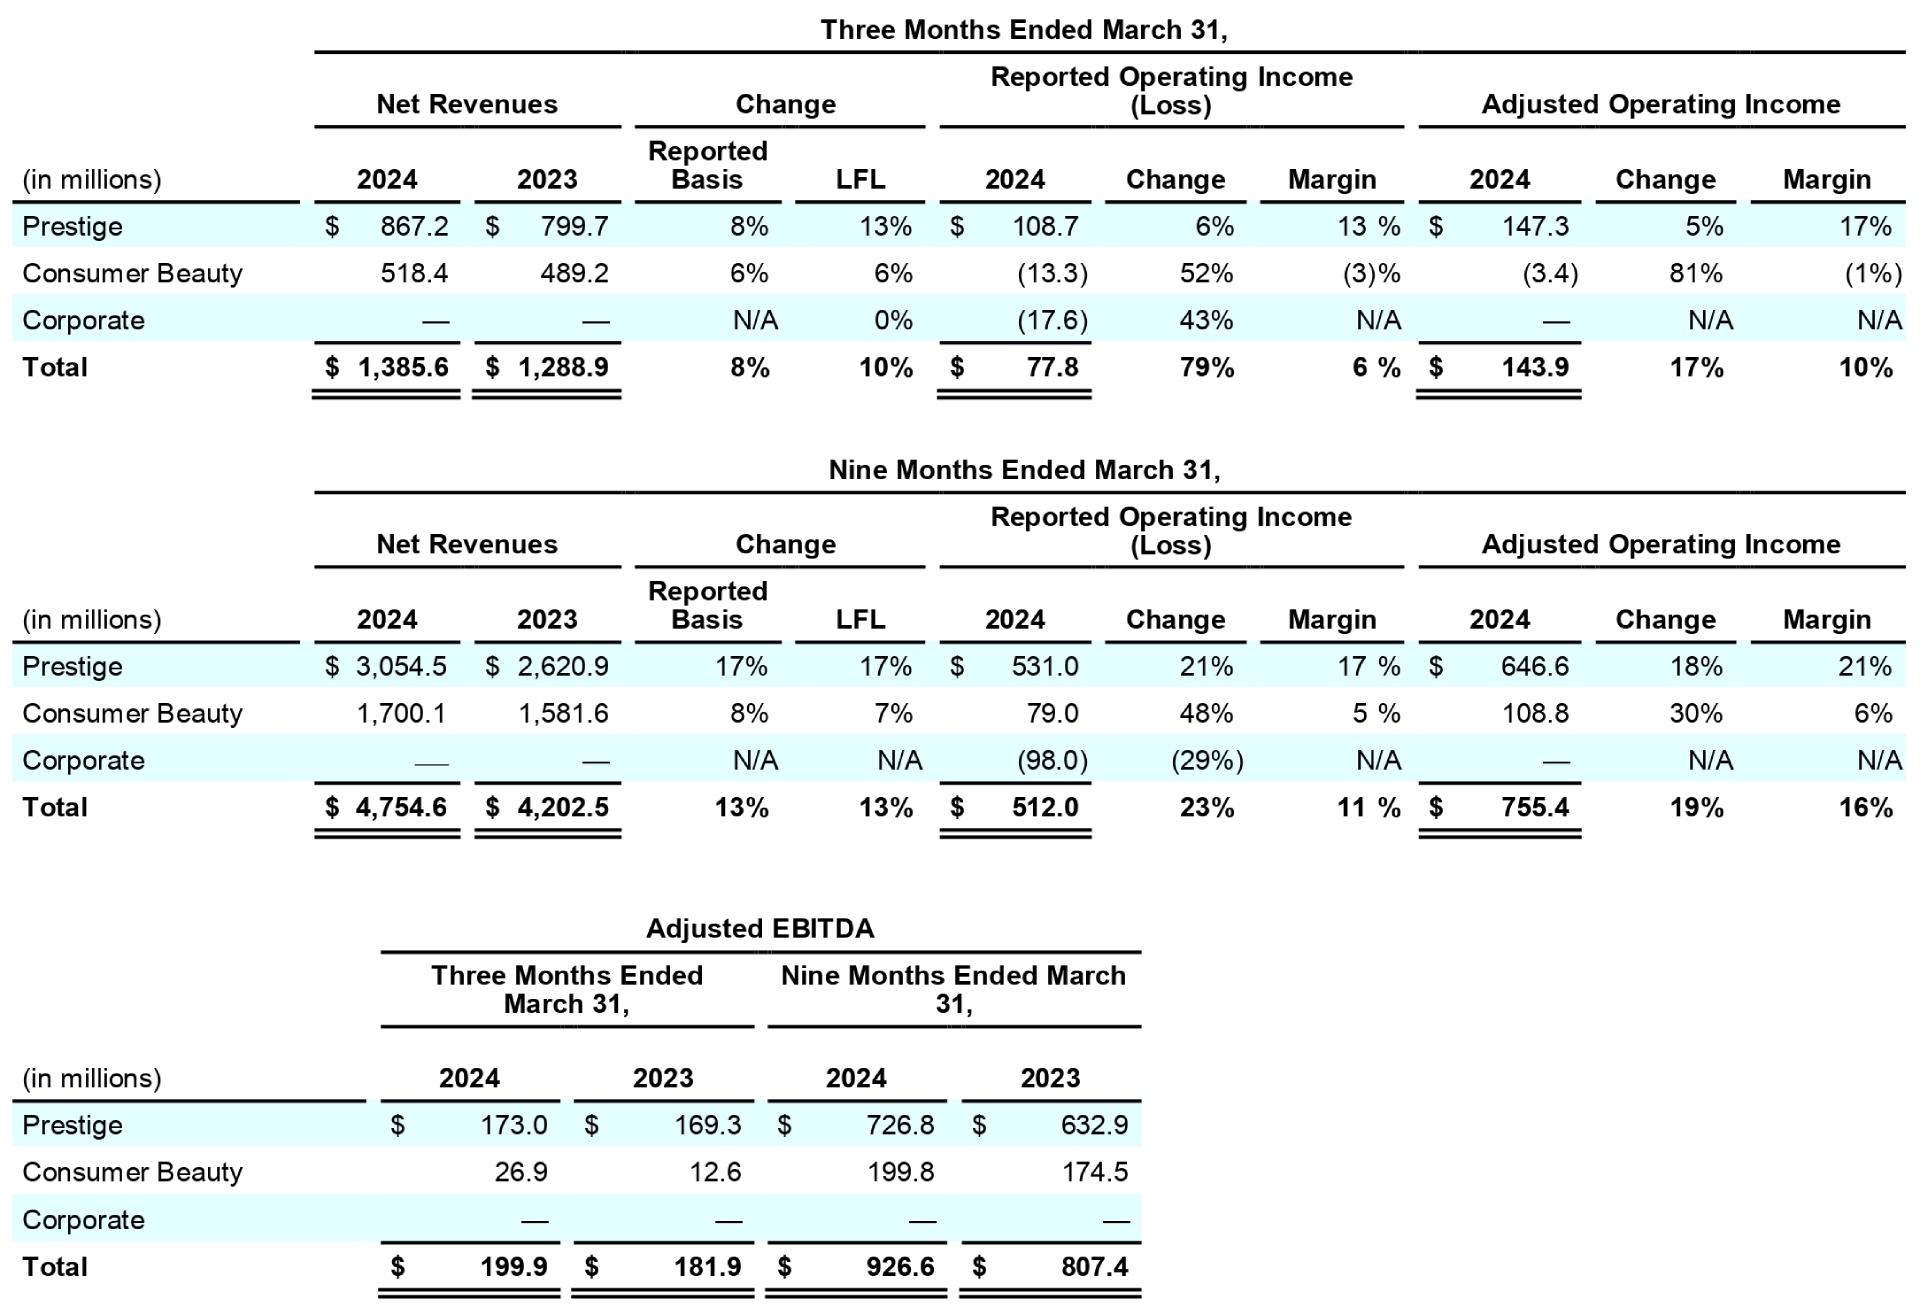
3Q24 adjusted EBITDA of $199.9 million grew 10% from $181.9 million in the prior year driven by higher sales and gross profit. Adjusted EBITDA margin of 14.4% increased by 30 basis points.
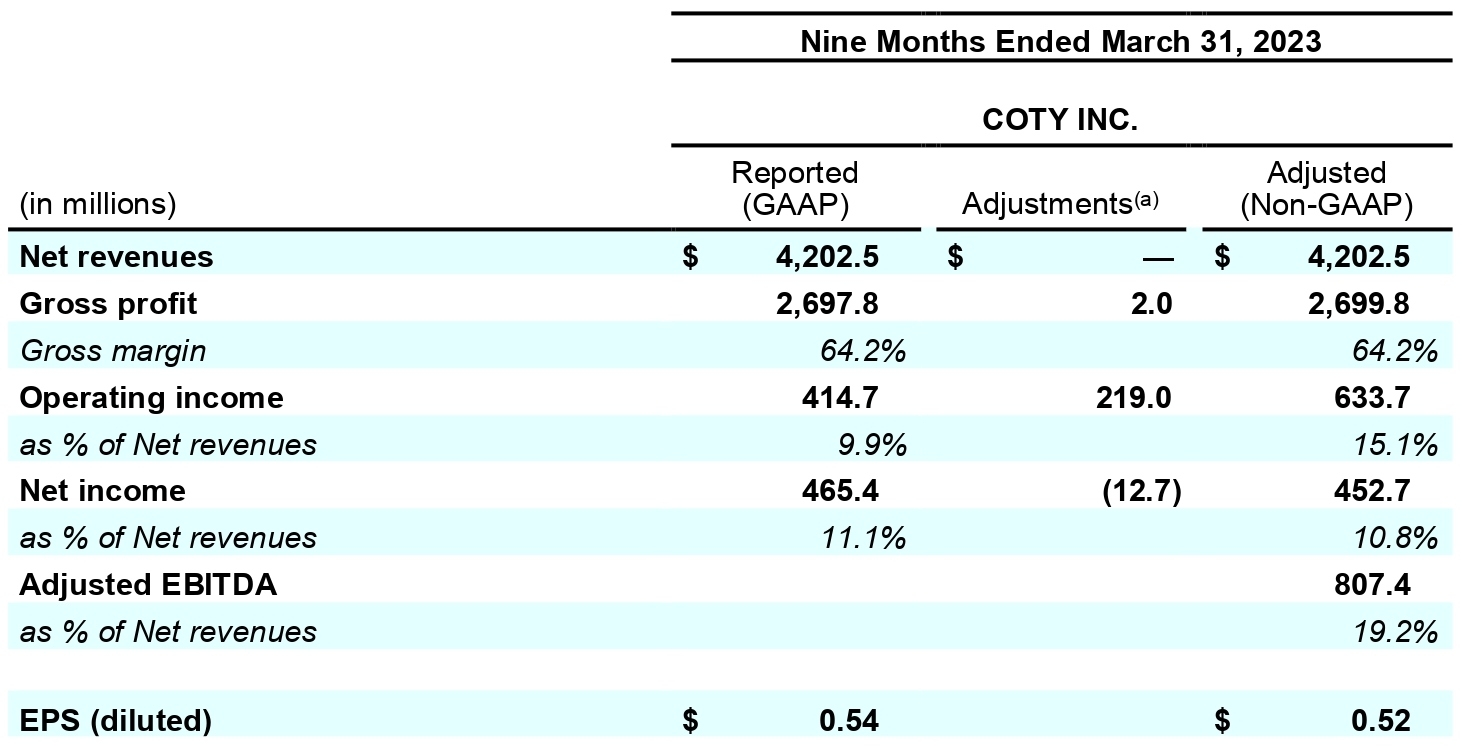
Year-to-date adjusted EBITDA of $926.6 million grew 15% from $807.4 million in the prior year, while adjusted EBITDA margin of 19.5% increased by 30 basis points supported by gross margin expansion.
3Q24 adjusted net income of $43.8 million decreased from $168.1 million in the prior year as profit expansion was more than offset by a $133 million reversal in the benefit from the equity swap mark-to-market. 3Q24 adjusted net income margin of 3.2% decreased from 13.0% in the prior year.
Year-to-date adjusted net income of $347.0 million decreased from $452.7 million in the prior year driven by a higher benefit from the mark-to-market on the equity swap in the prior year resulting in an adjusted net income margin of 7.3%, down 350 basis points year-over-year.
3Q24 adjusted EPS of $0.05 decreased from adjusted EPS of $0.19 in the prior year. 3Q24 adjusted EPS included a negative impact from the equity swap mark-to-market of $0.01, compared with a $0.13 benefit from the mark-to-market on the equity swap in the prior year.
The year-to-date adjusted EPS of $0.39, which includes a $0.02 EPS negative impact from the mark-to market on the equity swap, decreased from $0.52 as profit expansion was more than offset by a $0.16 reversal in the benefit from the mark-to market on the equity swap.
Operating Cash Flow:
3Q24 cash from operations totaling $(170.0) million decreased from $(124.6) million during the same period in the prior year driven by an increase of tax payments related to prior year tax liabilities and a change in the phasing of working capital.
3Q24 free cash flow of $(234.3) million decreased from free cash flow of $(178.5) million in the prior year driven by the $(45.4) million decrease in operating cash flow and a $(10.4) million increase in capex.
The seasonally low Q3 cash from operating activities and free cash flow was further pressured by the payment of taxes for prior years and the timing of working capital payments.
Year-to-date cash flow from operating activities was $438.1 million, while free cash flow totaled $252.7 million. This included a benefit of approximately $35 million from TSA exit in Brazil as Wella paid for working capital that Coty funded during TSA.
Financial Net Debt:
Total debt of $3,972.3 million on March 31, 2024 increased slightly from $3,716.8 million on December 31, 2023. This resulted in a total debt to net income ratio of 16.5x.
Financial net debt of $3,712.1 million on March 31, 2024 increased from $3,311.8 million on December 31, 2023 driven by the repurchase of 27 million shares on February 22, 2024 for approximately $200 million and the seasonally low Q3 cash from operating activities and free cash flow. This resulted in financial leverage of 3.4x.
The value of Coty's retained 25.8% Wella stake remained $1,080.0 million at quarter-end, supporting Coty's economic net debt of $2,632.1 million.
Third Quarter Business Review by Segment*
Prestige
In 3Q24, Prestige net revenues of $867.2 million or 63% of Coty sales, increased by 8% on a reported basis and increased by a strong 13% on a LFL basis. The growth on a reported basis was supported by continued strong momentum in prestige beauty demand, which led to strong growth in all regions with outperformance in APAC, EMEA and the Travel Retail channel, partially offset by a 4% negative impact from the divestiture of the Lacoste license. On a year-to date basis, Prestige net revenues grew a strong 17% on a reported basis driven by double-digit percentage growth in all regions and the Travel Retail channel. Year-to-date Prestige net revenues grew a robust 17% on a LFL basis.
During Q3, the Prestige fragrance category growth accelerated sequentially across North America and Europe, with all major markets expanding led by the U.S., Canada, Mexico, Germany, the U.K. and Italy. Coty's Prestige fragrance reported net revenues continued to grow strongly in Q3 and on a year-to-date basis, with many of Coty's leading Prestige fragrance brands growing reported net revenues by a double-digit percentage driven by continued global demand for beauty and fueled by existing icons and new launches. Global Travel Retail channel trends continued to be robust with reported net revenue growth of over 20% LFL in Q3 and very strong double-digit reported net revenue growth across all regions, propelled by the continued recovery of international travel and Coty's expansion in the Travel Retail channel. Reported net revenues for Coty’s Prestige cosmetics business grew by over 25% in the quarter led by its three prestige cosmetics brands, Burberry, Kylie and Gucci.
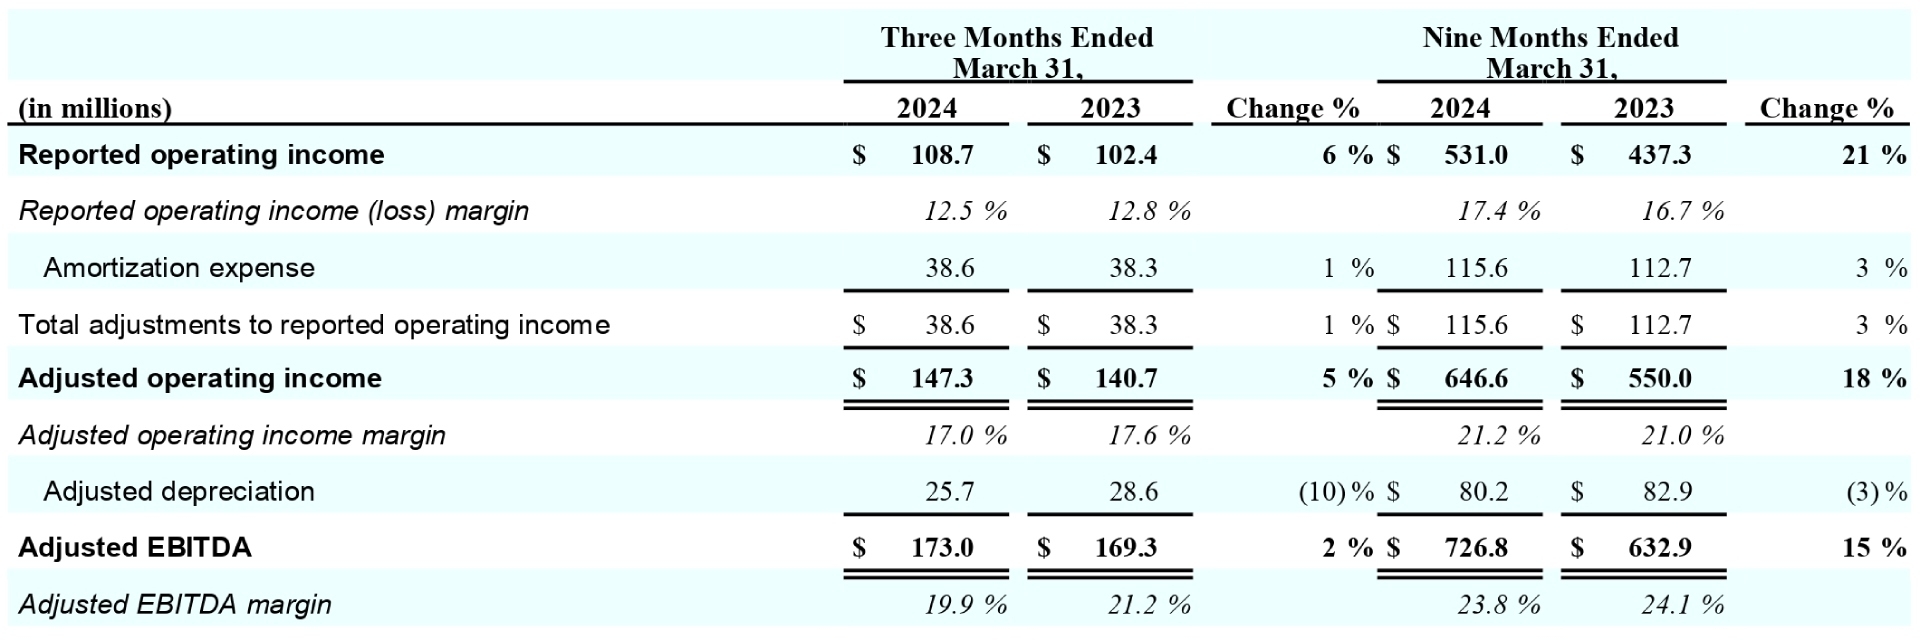
In 3Q24, the Prestige segment generated reported operating income of $108.7 million, compared to $102.4 million in the prior year, with a reported operating margin of 12.5%. 3Q24 adjusted operating income was $147.3 million, up from $140.7 million in the prior year, with an adjusted operating margin of 17.0%. Adjusted EBITDA rose to $173.0 million from $169.3 million in the prior year, with a margin of 19.9%. Year-to-date reported operating income of was $531.0 million, compared to $437.3 million in the prior year, with a reported operating margin of 17.4%, which increased 70 basis points year-over-year. The year-to-date adjusted operating income increased to $646.6 million from $550.0 million in the prior year, with an adjusted operating margin of 21.2%, up 20 basis points year-over-year. Adjusted EBITDA increased to $726.8 million from $632.9 million in the prior year, with a margin of 23.8%.
Consumer Beauty
In 3Q24, Consumer Beauty net revenues of $518.4 million, or 37% of Coty sales, increased by 6% as reported and LFL. Consumer Beauty growth on a reported basis was in line with the global mass beauty market, and supported by growth in mass fragrances, mass skin & body care and color cosmetics in most countries partially offset by weakness in the mass color cosmetics category in the United States. Consumer Beauty's Americas and EMEA regions delivered solid reported net revenue growth in the quarter, with strong double-digit percentage growth in Latin America and Canada. During the quarter, the Company's modest volume growth in Consumer Beauty included volume growth in its Brazil business and in mass fragrances, partially offset by moderate declines in the rest of the business.
Coty saw momentum in Q3 in many of its brands, with reported net revenue growth from Rimmel, Bruno Banani, Bourjois, Risque, Monange, Bozzano, Beckham and Paixao. Coty's color cosmetics brands, like CoverGirl and Rimmel, are harnessing the power of social media influencers and natural advocacy to support recent innovations with promising early results, like CoverGirl Simply Ageless Skin Perfector Essence and Rimmel Wonder’Bond mascara. The Consumer Beauty e-commerce channel sales growth on a reported basis was approximately 30% delivering market share gains in the channel.
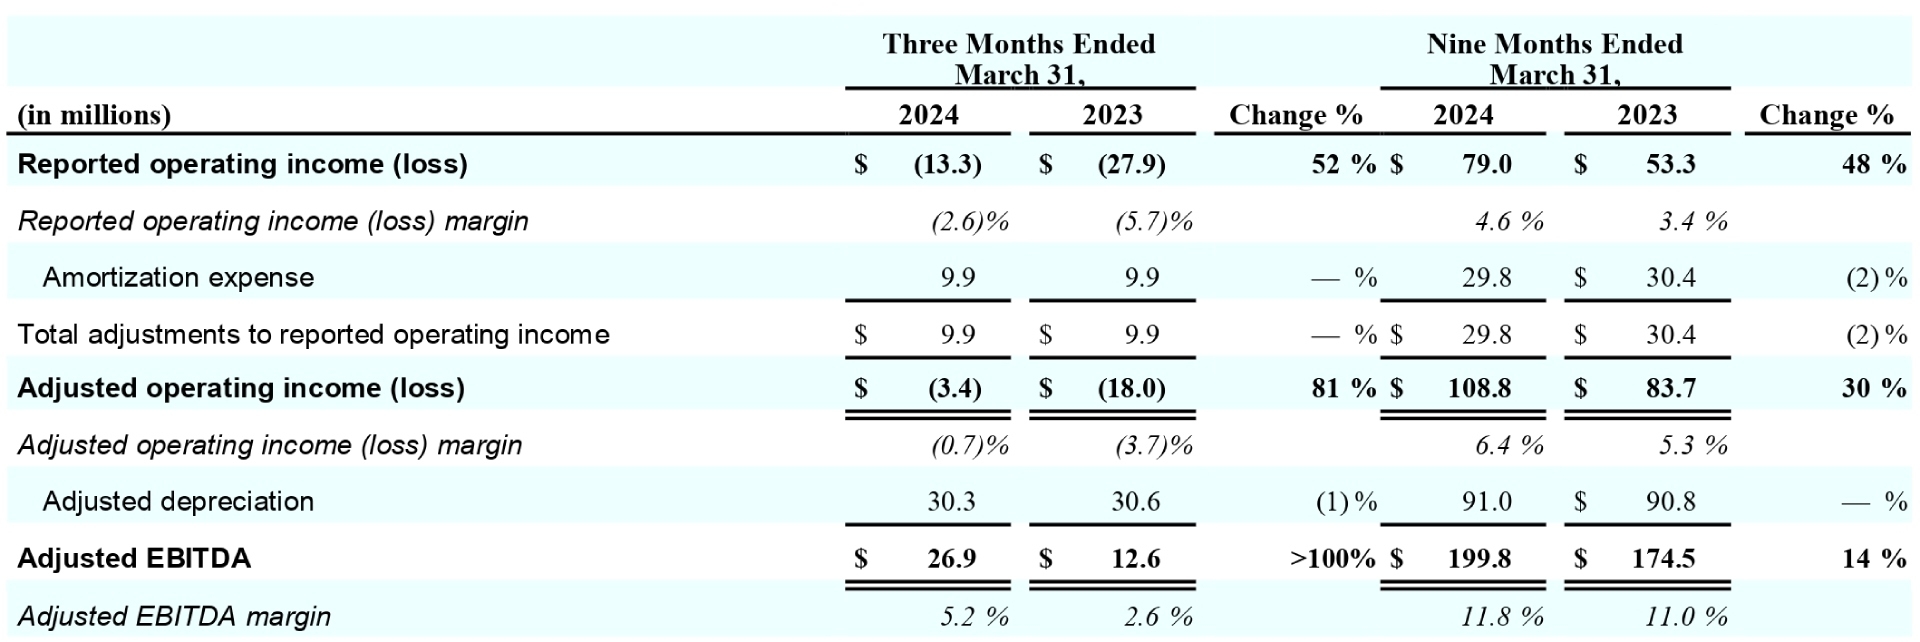
In 3Q24, the Consumer Beauty segment generated reported operating loss of $13.3 million compared to $27.9 million in the prior year, with a reported operating margin of (2.6)%, which improved from (5.7)% in the prior year. 3Q24 adjusted operating loss of $(3.4) million improved from $(18.0) million in the prior year, with an adjusted operating margin of (0.7)%, which improved from (3.7)%. 3Q24 adjusted EBITDA more than doubled to $26.9 million driving adjusted EBITDA margin to increase 260 basis points year-over-year to 5.2%. Year-to-date reported operating income was $79.0 million, compared to $53.3 million in the prior year, with reported operating margin of 4.6%, which increased by 120 basis points year-over-year. The year-to-date adjusted operating income increased to $108.8 million from $83.7 million in the prior year, with an adjusted operating margin of 6.4%, up 110 basis points year-over-year. Adjusted EBITDA increased to $199.8 million from $174.5 million in the prior year, with a margin of 11.8%, up 80 basis points.
Americas
In 3Q24, Americas net revenues of $589.0 million, or 43% of Coty sales, increased 8% on a reported basis driven by double-digit percentage reported growth in Consumer Beauty, mid-single-digit percentage reported growth in Prestige partially offset by a 2% negative impact from FX. On a LFL basis, Americas net revenues increased by 11% in the third quarter. The regional performance was supported by strong growth in nearly all markets with particularly robust double-digit percentage reported net revenue growth in Latin America, Canada and the regional Travel Retail channel.
EMEA
In 3Q24, EMEA net revenues of $628.0 million, or 45% of Coty sales, increased 7% on a reported basis driven by high-single-digit percentage reported growth in Prestige, mid-single-digit percentage reported growth in Consumer Beauty and a 2% FX benefit partially offset by a 4% headwind from the divestiture of the Lacoste license. On a LFL basis, EMEA net revenues increased by 9% in the third quarter. The regional performance was supported by most markets and the Travel Retail channel.
Asia Pacific
In 3Q24, Asia Pacific net revenues of $168.6 million, or 12% of Coty sales, increased 7% on a reported basis driven by double-digit percentage growth in Prestige partially offset by a 3% negative impact from FX. On a LFL basis, Asia Pacific net revenues increased 11% in the third quarter. Prestige reported net revenue growth in the region was driven by strong double-digit percentage reported growth in Asia excluding China and the regional Travel Retail channel. In China, Coty's Prestige reported revenues nearly tripled in Hainan, while Consumer Beauty reported revenues were lower as retailers worked down inventory levels.
Noteworthy Company Developments
Other noteworthy company developments include:
On February 20, 2024, Coty announced that it has signed a new license agreement with luxury Italian fashion house, Etro, to produce and distribute its signature fragrance lines and home scent collections beyond 2040. The Italian brand is known for its timeless designs and relentless focus on quality.
On February 22, 2024, the Company announced that it completed the repurchase of 27 million shares at an attractive price relative to current market price as part of its share buyback program, announced on June 10, 2022.
On February 28, 2024, Coty announced the launch of Infiniment Coty Paris, its Coty-branded ultra-premium fragrance brand. Infiniment Coty Paris is anchored in modernity, with a patent pending, Molecular Aura technology extending the fragrance’s signature up to 30 hours, and a collection of scents which are simultaneously luxurious, niche and wearable. As part of Coty's commitment to sustainability, Infiniment Coty Paris is the first globally-distributed full fragrance collection to be manufactured using 100% carbon-captured alcohol, and the bottles are refillable, stackable and reusable, as the brand has pioneered “artcycling” through specially designed bottles that can be stacked together to create new works of art.
On March 19, 2024, Coty won this year’s Euronext Best Listing Award in the Large Cap category, at the 12th edition of the Euronext Annual Conference held on March 19, 2024 in Paris. The award recognizes the success of Coty's global offering, the largest to date on Euronext Growth®. The secondary listing on Euronext Paris was a strong success for the company, raising €339.2 million, making it the 47th listing on Euronext in 2023 and the 11th international listing.
Conference Call
Coty Inc. will issue pre-recorded remarks on May 6, 2024 at approximately 4:45 PM (ET) / 10:45 PM (CET) and will hold a live question and answer session on May 7, 2024 beginning at 8:15 AM (ET) / 2:15 PM (CET). The pre-recorded remarks and live question and answer session will be available at http://investors.coty.com. The dial-in number for the live question and answer session is 1-800-225-9448 in the U.S. or 1- 203-518-9708 internationally (conference passcode number: COTY3Q24).
For more information:
Investor Relations
Olga Levinzon, +1 212 389-7733
olga_levinzon@cotyinc.com
Media
Antonia Werther, +31 621 394495
antonia_werther@cotyinc.com
About Coty Inc.
Founded in Paris in 1904, Coty is one of the world’s largest beauty companies with a portfolio of iconic brands across fragrance, color cosmetics, and skin and body care. Coty serves consumers around the world, selling prestige and mass market products in over 125 countries and territories. Coty and our brands empower people to express themselves freely, creating their own visions of beauty; and we are committed to protecting the planet. Learn more at coty.com or on LinkedIn and Instagram.
Forward Looking Statements
Certain statements in this Earnings Release are “forward-looking statements” within the meaning of the Private Securities Litigation Reform Act of 1995. These forward-looking statements reflect the Company's current views with respect to, among other things, strategic planning, targets and outlook for future reporting periods (including the extent and timing of revenue, expense and profit trends and changes in operating cash flows and cash flows from operating activities and investing activities), the Company’s future operations and strategy (including the expected implementation and related impact of its strategic priorities), ongoing and future cost efficiency, optimization and restructuring initiatives and programs, expectations of the impact of inflationary pressures and the timing, magnitude and impact of pricing actions to offset inflationary costs, strategic transactions (including their expected timing and impact), expectations and/or plans with respect to joint ventures (including Wella and the timing and size of any related divestiture, distribution or return of capital), the Company’s capital allocation strategy and payment of dividends (including suspension of dividend payments and the duration thereof and any plans to resume cash dividends on common stock or to continue to pay dividends in cash on preferred stock and expectations for stock repurchases), investments, licenses and portfolio changes, product launches, relaunches or rebranding (including the expected timing or impact thereof), synergies, savings, performance, cost, timing and integration of acquisitions, future cash flows, liquidity and borrowing capacity (including any refinancing or deleveraging activities), timing and size of cash outflows and debt deleveraging, the timing and extent of any future impairments, and synergies, savings, impact, cost, timing and implementation of the Company’s ongoing strategic transformation agenda (including operational and organizational structure changes, operational execution and simplification initiatives, fixed cost reductions, continued process improvements and supply chain changes), the impact, cost, timing and implementation of e-commerce and digital initiatives, the expected impact, cost, timing and implementation of sustainability initiatives (including progress, plans, goals and our ability to achieve sustainability targets), the wind down of the Company’s operations in Russia (including timing and expected impact), the impact of public health events, the expected impact of geopolitical risks including the ongoing war in Ukraine and/or the armed conflict in the Middle East (including the Red Sea conflict) on our business operations, sales outlook and strategy, the expected impact of global supply chain challenges and/or inflationary pressures (including as a result of the war in Ukraine and/or armed conflict in the Middle East including the Red Sea conflict) and expectations regarding future service levels and inventory levels, the impact of the dual-listing of the Company's Class A common stock on Euronext Paris, and the priorities of senior management. These forward-looking statements are generally identified by words or phrases, such as “anticipate”, “are going to”, “estimate”, “plan”, “project”, “expect”, “believe”, “intend”, “foresee”, “forecast”, “will”, “may”, “should”, “outlook”, “continue”, “temporary”, “target”, “aim”, “potential”, “goal” and similar words or phrases. These statements are based on certain assumptions and estimates that we consider reasonable, but are subject to a number of risks and uncertainties, many of which are beyond our control, which could cause actual events or results (including our financial condition, results of operations, cash flows and prospects) to differ materially from such statements, including risks and uncertainties relating to:
the Company’s ability to successfully implement its multi-year strategic transformation agenda and compete effectively in the beauty industry, achieve the benefits contemplated by its strategic initiatives (including revenue growth, cost control, gross margin growth and debt deleveraging) and successfully implement its strategic priorities (including stabilizing its consumer beauty brands through leading innovation and improved execution, accelerating its prestige fragrance brands and ongoing expansion into prestige cosmetics, building a comprehensive skincare portfolio, enhancing its e-commerce and direct-to-consumer capabilities, and expanding its presence in China through prestige products and select consumer beauty brands, and establishing Coty as an industry leader in sustainability) in each case within the expected time frame or at all;
the Company’s ability to anticipate, gauge and respond to market trends and consumer preferences, which may change rapidly, and the market acceptance of new products, including new products in the Company's skincare and prestige cosmetics portfolios, any relaunched or rebranded products and the anticipated costs and discounting associated with such relaunches and rebrands, and consumer receptiveness to the Company's current and future marketing philosophy and consumer engagement activities (including digital marketing and media) and the Company's ability to effectively manage its production and inventory levels in response to demand;
use of estimates and assumptions in preparing the Company’s financial statements, including with regard to revenue recognition, income taxes (including the expected timing and amount of the release of any tax valuation allowance), the assessment of goodwill, other intangible and long-lived assets for impairments, the market value of inventory, and the fair value of the equity investment;
the impact of any future impairments;
managerial, transformational, operational, regulatory, legal and financial risks, including diversion of management attention to and management of cash flows, expenses and costs associated with the Company's transformation agenda, its global business strategies, the integration and management of the Company's strategic partnerships, and future strategic initiatives, and, in particular, the Company's ability to manage and execute many initiatives simultaneously including any resulting complexity, employee attrition or diversion of resources;
the timing, costs and impacts of divestitures and the amount and use of proceeds from any such transactions;
future divestitures and the impact thereof on, and future acquisitions, new licenses and joint ventures and the integration thereof with, our business, operations, systems, financial data and culture and the ability to realize synergies, manage supply chain challenges and other business disruptions, reduce costs (including through the Company’s cash efficiency initiatives), avoid liabilities and realize potential efficiencies and benefits (including through our restructuring initiatives) at the levels and at the costs and within the time frames contemplated or at all;
increased competition, consolidation among retailers, shifts in consumers’ preferred distribution and marketing channels (including to digital and prestige channels), distribution and shelf-space resets or reductions, compression of go-to-market cycles, changes in product and marketing requirements by retailers, reductions in retailer inventory levels and order lead-times or changes in purchasing patterns, impact from COVID-19 or similar public health events on retail revenues, and other changes in the retail, e-commerce and wholesale environment in which the Company does business and sells its products and the Company’s ability to respond to such changes (including its ability to expand its digital, direct-to-consumer and e-commerce capabilities within contemplated timeframes or at all);
the Company and its joint ventures’, business partners’ and licensors’ abilities to obtain, maintain and protect the intellectual property used in its and their respective businesses, protect its and their respective reputations (including those of its and their executives or influencers), public goodwill, and defend claims by third parties for infringement of intellectual property rights;
any change to the Company’s capital allocation and/or cash management priorities, including any change in the Company’s dividend policy and any change in our stock repurchase plans;
any unanticipated problems, liabilities or integration or other challenges associated with a past or future acquired business, joint ventures or strategic partnerships which could result in increased risk or new, unanticipated or unknown liabilities, including with respect to environmental, competition and other regulatory, compliance or legal matters, and specifically in connection with the strategic partnerships with Kylie Jenner and Kim Kardashian, risks related to the entry into a new distribution channel, the potential for channel conflict, risks of retaining customers and key employees, difficulties of integration (or the risks associated with limiting integration) and management of the partnerships, the Company's relationships with Kylie Jenner and Kim Kardashian, the Company's ability to protect trademarks and brand names, litigation or investigations by governmental authorities, and changes in law, regulations and policies that affect King Kylie LLC ("King Kylie") and/or KKW Holdings, LLC’s (“KKW Holdings”) business or products, including risk that direct selling laws and regulations may be modified, interpreted or enforced in a manner that results in a negative impact to King Kylie and/or KKW Holdings’ business model, revenue, sales force or business;
the Company’s international operations and joint ventures, including enforceability and effectiveness of its joint venture agreements and reputational, compliance, regulatory, economic and foreign political risks, including difficulties and costs associated with maintaining compliance with a broad variety of complex local and international regulations;
the Company’s dependence on certain licenses (especially in the fragrance category) and the Company’s ability to renew expiring licenses on favorable terms or at all;
the Company’s dependence on entities performing outsourced functions, including outsourcing of distribution functions, and third-party manufacturers, logistics and supply chain suppliers, and other suppliers, including third-party software providers, web-hosting and e-commerce providers;
administrative, product development and other difficulties in meeting the expected timing of market expansions, product launches, re-launches and marketing efforts, including in connection with new products in the Company's skincare and prestige cosmetics portfolios;
changes in the demand for the Company’s products due to declining or depressed global or regional economic conditions, and declines in consumer confidence or spending, whether related to the economy (such as austerity measures, tax increases, high fuel costs, or higher unemployment), wars and other hostilities and armed conflicts, natural or other disasters, weather, pandemics, security concerns, terrorist attacks or other factors;
global political and/or economic uncertainties, disruptions or major regulatory or policy changes, and/or the enforcement thereof that affect the Company’s business, financial performance, operations or products, including the impact of the war in Ukraine and any escalation or expansion thereof, armed conflict in the Middle East, the current U.S. administration and future elections, changes in the U.S. tax code and/or other jurisdictions where the Company operates (including recent and pending implementation of the global minimum corporate tax (part of the “Pillar Two Model Rules”) that may impact the Company's tax liability in the European Union), and recent changes and future changes in tariffs, retaliatory or trade protection measures, trade policies and other international trade regulations in the U.S., the European Union and Asia and in other regions where the Company operates, potential regulatory limits on payment terms in the European Union, future changes in sanctions regulations, regulatory uncertainty impacting the wind-down of our business in Russia, recent and future changes in regulations impacting the beauty industry, including regulatory measures addressing products, formulations, raw materials and packaging, and recent and future regulatory measures restricting or otherwise impacting the use of web sites, mobile applications or social media platforms that the Company uses in connection with its digital marketing and e-commerce activities;
currency exchange rate volatility and currency devaluation and/or inflation;
our ability to implement and maintain pricing actions to effectively mitigate increased costs and inflationary pressures, and the reaction of customers or consumers to such pricing actions;
the number, type, outcomes (by judgment, order or settlement) and costs of current or future legal, compliance, tax, regulatory or administrative proceedings, investigations and/or litigation, including product liability cases (including asbestos and talc-related litigation for which indemnities and/or insurance may not be available), distributor or licensor litigation, and compliance, litigation or investigations relating to the Company's joint ventures or strategic partnerships;
the Company’s ability to manage seasonal factors and other variability and to anticipate future business trends and needs;
disruptions in the availability and distribution of raw materials and components needed to manufacture the Company's products, and the Company's ability to effectively manage its production and inventory levels in response to supply challenges;
disruptions in operations, sales and in other areas, including due to disruptions in our supply chain, restructurings and other business alignment activities, manufacturing or information technology systems, labor disputes, extreme weather and natural disasters, impact from public health events, the outbreak of war or hostilities (including the war in Ukraine and armed conflict in the Middle East (including the Red Sea conflict) and any escalation or expansion thereof), the impact of global supply chain challenges or other disruptions in the international flow of goods, and the impact of such disruptions on the Company’s ability to generate profits, stabilize or grow revenues or cash flows, comply with its contractual obligations and accurately forecast demand and supply needs and/or future results;
the Company's ability to adapt its business to address climate change concerns, including through the implementation of new or unproven technologies or processes, and to respond to increasing governmental and regulatory measures relating to environmental, social and governance matters, including expanding mandatory and voluntary reporting, diligence and disclosure, as well as new taxes (including on energy and plastic), new diligence requirements and the impact of such measures or processes on its costs, business operations and strategy;
restrictions imposed on the Company through its license agreements, credit facilities and senior unsecured bonds or other material contracts, its ability to generate cash flow to repay, refinance or recapitalize debt and otherwise comply with its debt instruments, and changes in the manner in which the Company finances its debt and future capital needs;
increasing dependency on information technology, including as a result of remote working practices, and the Company’s ability or the ability of any of the third-party service providers the Company uses to support its business, to protect against service interruptions, data corruption, cyber-based attacks or network security breaches, including ransomware attacks, costs and timing of implementation and effectiveness of any upgrades or other changes to information technology systems, and the cost of compliance or the Company’s failure to comply with any privacy or data security laws (including the European Union General Data Protection Regulation, the California Consumer Privacy Act and similar state laws, the Brazil General Data Protection Law, and the China Data Security Law and Personal Information Protection Law) or to protect against theft of customer, employee and corporate sensitive information;
the Company's ability to attract and retain key personnel and the impact of senior management transitions;
the distribution and sale by third parties of counterfeit and/or gray market versions of the Company’s products;
the impact of the Company's ongoing strategic transformation agenda and continued process improvements on the Company’s relationships with key customers and suppliers and certain material contracts;
the Company’s relationship with JAB Beauty B.V., as the Company’s majority stockholder, and its affiliates, and any related conflicts of interest or litigation;
the Company’s relationship with KKR, whose affiliate KKR Bidco is an investor in the Wella Business, and any related conflicts of interest or litigation;
future sales of a significant number of shares by the Company’s majority stockholder or the perception that such sales could occur; and
other factors described elsewhere in this document and in documents that the Company files with the SEC from time to time.
When used herein, the term “includes” and “including” means, unless the context otherwise indicates, “including without limitation”. More information about potential risks and uncertainties that could affect the Company’s business and financial results is included under the heading “Risk Factors” and “Management’s Discussion and Analysis of Financial Condition and Results of Operations” in the Company’s Annual Report on Form 10-K for the year ended June 30, 2023 and other periodic reports the Company has filed and may file with the SEC from time to time.
All forward-looking statements made in this release are qualified by these cautionary statements. These forward-looking statements are made only as of the date of this release, and the Company does not undertake any obligation, other than as may be required by applicable law, to update or revise any forward-looking or cautionary statements to reflect changes in assumptions, the occurrence of events, unanticipated or otherwise, or changes in future operating results over time or otherwise.
Comparisons of results for current and any prior periods are not intended to express any future trends or indications of future performance unless expressed as such, and should only be viewed as historical data.
The Company operates on a global basis, with the majority of net revenues generated outside of the U.S. Accordingly, fluctuations in foreign currency exchange rates can affect results of operations. Therefore, to supplement financial results presented in accordance with GAAP, certain financial information is presented excluding the impact of foreign currency exchange translations to provide a framework for assessing how the underlying businesses performed excluding the impact of foreign currency exchange translations (“constant currency”). Constant currency information compares results between periods as if exchange rates had remained constant period-over-period, with the current period’s results calculated at the prior-year period’s rates. The Company calculates constant currency information by translating current and prior-period results for entities reporting in currencies other than U.S. dollars into U.S. dollars using constant foreign currency exchange rates. The constant currency calculations do not adjust for the impact of revaluing specific transactions denominated in a currency that is different to the functional currency of that entity when exchange rates fluctuate. The constant currency information presented may not be comparable to similarly titled measures reported by other companies. The Company discloses the following constant currency financial measures: net revenues, organic like-for-like (LFL) net revenues, adjusted gross profit and adjusted operating income.
The Company presents period-over-period comparisons of net revenues on a constant currency basis as well as on an organic (LFL) basis. The Company believes that organic (LFL) better enables management and investors to analyze and compare the Company's net revenues performance from period to period. For the periods described in this release, the term “like-for-like” describes the Company's core operating performance, excluding the financial impact of (i) acquired brands or businesses in the current year period until we have twelve months of comparable financial results, (ii) the divested brands or businesses or early terminated brands, generally, in the prior year non-comparable periods, to maintain comparable financial results with the current fiscal year period and (iii) foreign currency exchange translations to the extent applicable. For a reconciliation of organic (LFL) period-over-period, see the table entitled “Reconciliation of Reported Net Revenues to Like-For-Like Net Revenues”.
The Company presents operating income, operating income margin, gross profit, gross margin, effective tax rate, net income, net income margin, net revenues, EBITDA, and EPS (diluted) on a non-GAAP basis and specifies that these measures are non-GAAP by using the term “adjusted” (collectively the Adjusted Performance Measures). The reconciliations of these non-GAAP financial measures to the most directly comparable financial measures calculated and presented in accordance with GAAP are shown in tables below. These non-GAAP financial measures should not be considered in isolation from, or as a substitute for or superior to, financial measures reported in accordance with GAAP. Moreover, these non-GAAP financial measures have limitations in that they do not reflect all the items associated with the operations of the business as determined in accordance with GAAP. Other companies, including companies in the beauty industry, may calculate similarly titled non-GAAP financial measures differently than we do, limiting the usefulness of those measures for comparative purposes.
Adjusted operating income/Adjusted EBITDA from Coty Inc., (as well as adjusted operating income margin and adjusted EBITDA margin, which are calculated by dividing Adjusted operating income from Coty Inc. and Adjusted EBITDA from Coty Inc., respectively, by net revenues) exclude restructuring costs and business structure realignment programs, amortization, acquisition- and divestiture-related costs and acquisition accounting impacts, stock-based compensation, and asset impairment charges and other adjustments as described below. For adjusted EBITDA and adjusted EBITDA margin, in addition to the preceding, we exclude the adjusted depreciation as defined below. We do not consider these items to be reflective of our core operating performance due to the variability of such items from period-to-period in terms of size, nature and significance. They are primarily incurred to realign our operating structure and integrate new acquisitions, and exclude divestitures, and fluctuate based on specific facts and circumstances. Additionally, Adjusted net income attributable to Coty Inc. and Adjusted net income attributable to Coty Inc. per common share are adjusted for certain interest and other (income) expense and deemed preferred stock dividends, as described below, and the related tax effects of each of the items used to derive Adjusted net income as such charges are not used by our management in assessing our operating performance period-to-period.
Adjusted Performance Measures reflect adjustments based on the following items:
Costs related to acquisition and divestiture activities: The Company has excluded acquisition- and divestiture-related costs and the accounting impacts such as those related to transaction costs and costs associated with the revaluation of acquired inventory in connection with business combinations because these costs are unique to each transaction. Additionally, for divestitures, the Company excludes write-offs of assets that are no longer recoverable and contract related costs due to the divestiture. The nature and amount of such costs vary significantly based on the size and timing of the acquisitions and divestitures, and the maturities of the businesses being acquired or divested. Also, the size, complexity and/or volume of past transactions, which often drives the magnitude of such expenses, may not be indicative of the size, complexity and/or volume of any future acquisitions or divestitures.
Restructuring and other business realignment costs: The Company has excluded the costs associated with restructuring and business structure realignment programs to allow for comparable financial results to historical operations and forward-looking guidance. In addition, the nature and amount of such charges vary significantly based on the size and timing of the programs. By excluding the referenced expenses from the non-GAAP financial measures, management is able to further evaluate the Company's ability to utilize existing assets and estimate their long-term value. Furthermore, our management believes that the adjustment of these items supplements the GAAP information with a measure that can be used to assess the sustainability of operating performance.
Asset impairment charges: The Company has excluded the impact of asset impairments as such non-cash amounts are inconsistent in amount and frequency and are significantly impacted by the timing and/or size of acquisitions. Our management believes that the adjustment of these items supplements the GAAP information with a measure that can be used to assess the sustainability of our operating performance.
Amortization expense: The Company has excluded the impact of amortization of finite-lived intangible assets, as such non-cash amounts are inconsistent in amount and frequency and are significantly impacted by the timing and/or size of acquisitions. Our management believes that the adjustment of these items supplements the GAAP information with a measure that can be used to assess the sustainability of our operating performance. Although we exclude amortization of intangible assets from our non-GAAP expenses, our management believes that it is important for investors to understand that such intangible assets contribute to revenue generation. Amortization of intangible assets that relate to past acquisitions will recur in future periods until such intangible assets have been fully amortized. Any future acquisitions may result in the amortization of additional intangible assets.
Gain on sale and early license termination: We have excluded the impact of gain on sale and early license termination as such amounts are inconsistent in amount and frequency and are significantly impacted by the size of the sale and early license termination.
Costs related to market exit: We have excluded the impact of direct incremental costs related to our decision to wind down our business operations in Russia. We believe that these direct and incremental costs are inconsistent and infrequent in nature. Consequently, our management believes that the adjustment of these items supplements the GAAP information with a measure that can be used to assess the sustainability of our operating performance.
Gains on sale of real estate: The Company has excluded the impact of Gains on sale of real estate as such amounts are inconsistent in amount and frequency and are significantly impacted by the size of the sale. Our management believes that the adjustment of these items supplements the GAAP information with a measure that can be used to assess the sustainability of our operating performance.
Stock-based compensation: Although stock-based compensation is a key incentive offered to our employees, we have excluded the effect of these expenses from the calculation of adjusted operating income and adjusted EBITDA. This is due to their primarily non-cash nature; in addition, the amount and timing of these expenses may be highly variable and unpredictable, which may negatively affect comparability between periods.
Depreciation and Adjusted depreciation: Our adjusted operating income excludes the impact of accelerated depreciation for certain restructuring projects that affect the expected useful lives of Property, Plant and Equipment, as such charges vary significantly based on the size and timing of the programs. Further, we have excluded adjusted depreciation, which represents depreciation expense net of accelerated depreciation charges, from our adjusted EBITDA. Our management believes that the adjustment of these items supplements the GAAP information with a measure that can be used to assess the sustainability of our operating performance.
Other (income) expense: We have excluded the impact of pension curtailment (gains) and losses and pension settlements as such events are triggered by our restructuring and other business realignment activities and the amount of such charges vary significantly based on the size and timing of the programs. Further, we have excluded the change in fair value of the investment in Wella, as well as expenses related to potential or actual sales transactions reducing equity investments, as our management believes these unrealized (gains) and losses do not reflect our underlying ongoing business, and the adjustment of such impact helps investors and others compare and analyze performance from period to period. We have excluded the gain on the exchange of Series B Preferred Stock. Such transactions do not reflect our operating results and we have excluded the impact as our management believes that the adjustment of these items supplements the GAAP information with a measure that can be used to assess the sustainability of our operating performance.
Noncontrolling interest: This adjustment represents the after-tax impact of the non-GAAP adjustments included in Net income attributable to noncontrolling interests based on the relevant noncontrolling interest percentage.
Tax: This adjustment represents the impact of the tax effect of the pretax items excluded from Adjusted net income. The tax impact of the non-GAAP adjustments is based on the tax rates related to the jurisdiction in which the adjusted items are received or incurred. Additionally, adjustments are made for the tax impact of any intra-entity transfer of assets and liabilities.
Deemed Preferred Stock Dividends: The Company has excluded preferred stock deemed dividends related to the First Exchange and the Second Exchange from our calculation of adjusted net income attributable to Coty Inc. These deemed dividends are non-monetary in nature, the transactions were entered into to simplify our capital structure and do not reflect our underlying ongoing business. Management believes that this adjustment helps investors and others compare and analyze our performance from period to period.
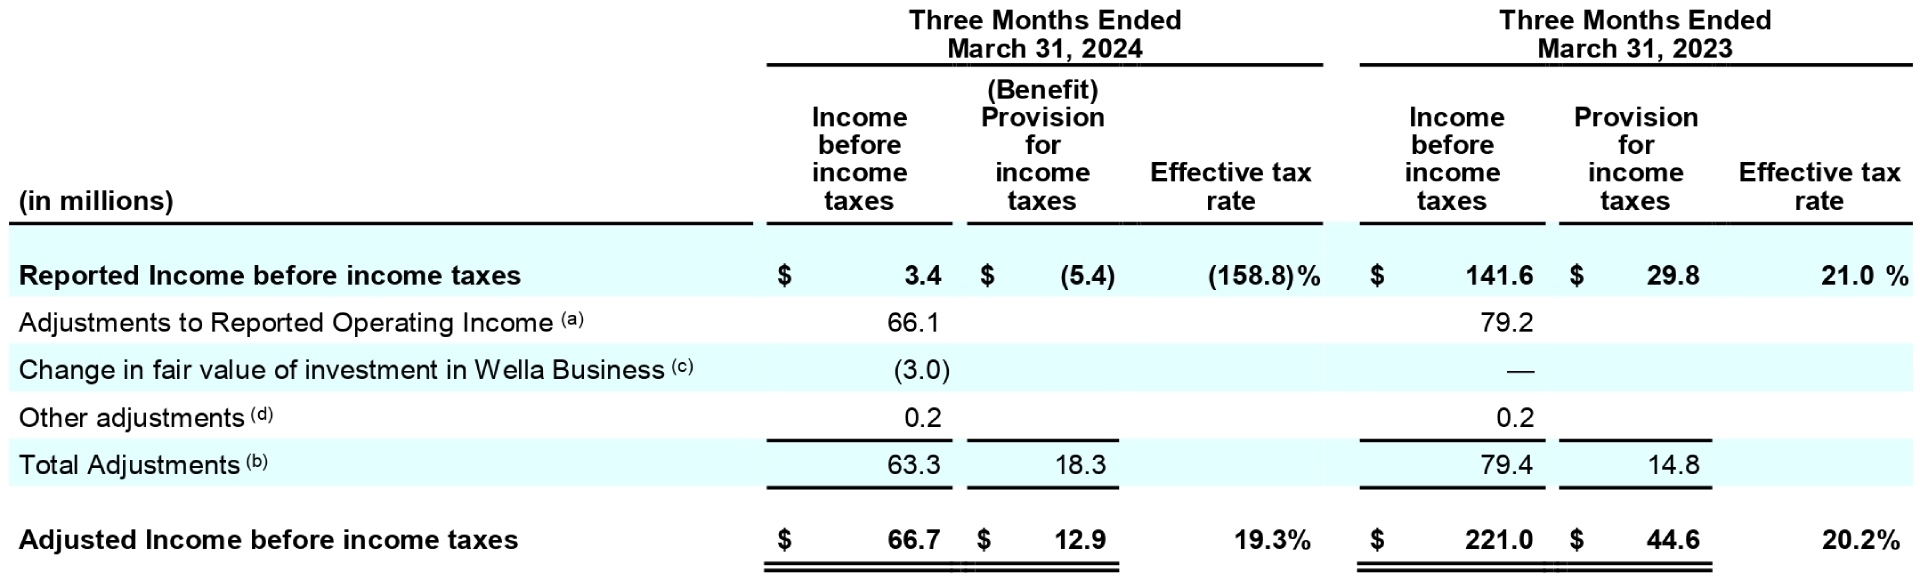
The Company has provided a quantitative reconciliation of the difference between the non-GAAP financial measures and the financial measures calculated and reported in accordance with GAAP. For a reconciliation of adjusted gross profit to gross profit, adjusted EPS (diluted) to EPS (diluted), and adjusted net revenues to net revenues, see the table entitled “Reconciliation of Reported to Adjusted Results for the Consolidated Statements of Operations.” For a reconciliation of adjusted operating income to operating income and adjusted operating income margin to operating income margin, see the tables entitled “Reconciliation of Reported Operating Income (Loss) to Adjusted Operating Income” and "Reconciliation of Reported Operating Income (Loss) to Adjusted Operating Income by Segment." For a reconciliation of adjusted effective tax rate to effective tax rate, see the table entitled “Reconciliation of Reported Income (Loss) Before Income Taxes and Effective Tax Rates to Adjusted Income Before Income Taxes and Adjusted Effective Tax Rates.” For a reconciliation of adjusted net income and adjusted net income margin to net income (loss), see the table entitled “Reconciliation of Reported Net Income (Loss) to Adjusted Net Income.”
The Company also presents free cash flow, adjusted earnings before interest, taxes, depreciation and amortization ("adjusted EBITDA"), Financial Net Debt and Economic Net Debt. Management believes that these measures are useful for investors because it provides them with an important perspective on the cash available for debt repayment and other strategic measures and provides them with the same measures that management uses as the basis for making resource allocation decisions. Free cash flow is defined as net cash provided by operating activities less capital expenditures; adjusted EBITDA is defined as adjusted operating income, excluding adjusted depreciation and non-cash stock-based compensation. Net debt or Financial Net Debt (which the Company referred to as "net debt" in prior reporting periods) is defined as total debt less cash and cash equivalents, and Economic Net Debt is defined as total debt less cash and cash equivalents less the value of the Wella Stake. For a reconciliation of Free Cash Flow, see the table entitled “Reconciliation of Net Cash Provided by Operating Activities to Free Cash Flow,” for adjusted EBITDA, see the table entitled “Reconciliation of Adjusted Operating Income to Adjusted EBITDA” and for Financial Net Debt and Economic Net Debt, see the tables entitled “Reconciliation of Total Debt to Financial Net Debt and Economic Net Debt.”
These non-GAAP measures should not be considered in isolation, or as a substitute for, or superior to, financial measures calculated in accordance with GAAP.
To the extent that the Company provides guidance, it does so only on a non-GAAP basis and does not provide reconciliations of such forward-looking non-GAAP measures to GAAP due to the inherent difficulty in forecasting and quantifying certain amounts that are necessary for such reconciliation, including adjustments that could be made for restructuring, integration and acquisition-related expenses, amortization expenses, non-cash stock-based compensation, adjustments to inventory, and other charges reflected in our reconciliation of historic numbers, the amount of which, based on historical experience, could be significant.
THIRD QUARTER BY SEGMENT (COTY INC)
THIRD QUARTER FISCAL 2024 BY REGION
Coty, Inc.
COTY INC. & SUBSIDIARIES
Adjusted Diluted EPS is adjusted by the effect of dilutive securities. For the three months ended March 31, 2024 and 2023, shares for the Forward Repurchase Contracts were excluded from the computation of adjusted diluted EPS as Coty is in the position to receive shares from the counterparties and as such their inclusion would be anti-dilutive. Accordingly, we did not reverse the impact of the fair market value losses/(gains) for contracts with the option to settle in shares or cash of $7.1 and $(93.9), respectively. For the three months ended March 31, 2024, convertible Series B Preferred Stock (23.7 million weighted average dilutive shares) were anti-dilutive. Accordingly, we excluded these shares from the diluted shares and did not adjust the earnings for the related dividend of $3.3. For the three months ended March 31, 2023, as the Convertible Series B Preferred Stock was dilutive, an adjustment to reverse the impact of the preferred stock dividends of $3.3 was required.
Adjusted Diluted EPS is adjusted by the effect of dilutive securities. For the nine months ended March 31, 2024 and 2023, shares for the Forward Repurchase Contracts were excluded from the computation of adjusted diluted EPS as Coty is in the position to receive shares from the counterparties and as such their inclusion would be anti-dilutive. Accordingly, we did not reverse the impact of the fair market value losses/(gains) for contracts with the option to settle in shares or cash of $6.9 and $(100.7), respectively. For the nine months ended March 31, 2024, convertible Series B Preferred Stock (23.7 million weighted average dilutive shares) were anti-dilutive. Accordingly, we excluded these shares from the diluted shares and did not adjust the earnings for the related dividend of $9.9. For the nine months ended March 31, 2023, as the Convertible Series B Preferred Stock was dilutive, an adjustment to reverse the impact of the preferred stock dividends of $9.9 was required.
RECONCILIATION OF REPORTED TO ADJUSTED RESULTS FOR THE CONSOLIDATED STATEMENTS OF OPERATIONS
These supplemental schedules provide adjusted Non-GAAP financial information and a quantitative reconciliation of the difference between the Non-GAAP financial measure and the financial measure calculated and reported in accordance with GAAP.
Adjusted diluted EPS includes $0.01 hurt related to the net impact of the Total Return Swaps in the three months ended March 31, 2024.
Adjusted diluted EPS includes $0.13 related to the net impact of the Total Return Swaps in the three months ended March 31, 2023.
See “Reconciliation of Reported Net Income, Adjusted Operating Income and Adjusted EBITDA for Coty Inc” and “Reconciliation of Reported Net Income to Adjusted Net Income” for a detailed description of adjusted items.
RECONCILIATION OF REPORTED TO ADJUSTED RESULTS FOR THE CONSOLIDATED STATEMENTS OF OPERATIONS
These supplemental schedules provide adjusted Non-GAAP financial information and a quantitative reconciliation of the difference between the Non-GAAP financial measure and the financial measure calculated and reported in accordance with GAAP.
Adjusted diluted EPS includes $0.02 hurt related to the net impact of the Total Return Swaps in the nine months ended March 31, 2024.
Adjusted diluted EPS includes $0.14 related to the net impact of the Total Return Swaps in the nine months ended March 31, 2023.
See “Reconciliation of Reported Net Income to Adjusted Operating Income, and Adjusted EBITDA” and “Reconciliation of Reported Net Income to Adjusted Net Income” for a detailed description of adjusted items.
RECONCILIATION OF REPORTED NET INCOME TO ADJUSTED OPERATING INCOME AND ADJUSTED EBITDA
In the three months ended March 31, 2024, amortization expense of $38.6 and $9.9 was reported in the Prestige and Consumer Beauty segments, respectively. In the three months ended March 31, 2023, amortization expense of $38.3 and $9.9 was reported in the Prestige and Consumer Beauty segments, respectively.In the nine months ended March 31, 2024, amortization expense of $115.6 and $29.8 was reported in the Prestige and Consumer Beauty segments, respectively. In the nine months ended March 31, 2023, amortization expense of $112.7 and $30.4 was reported in the Prestige and Consumer Beauty segments, respectively.
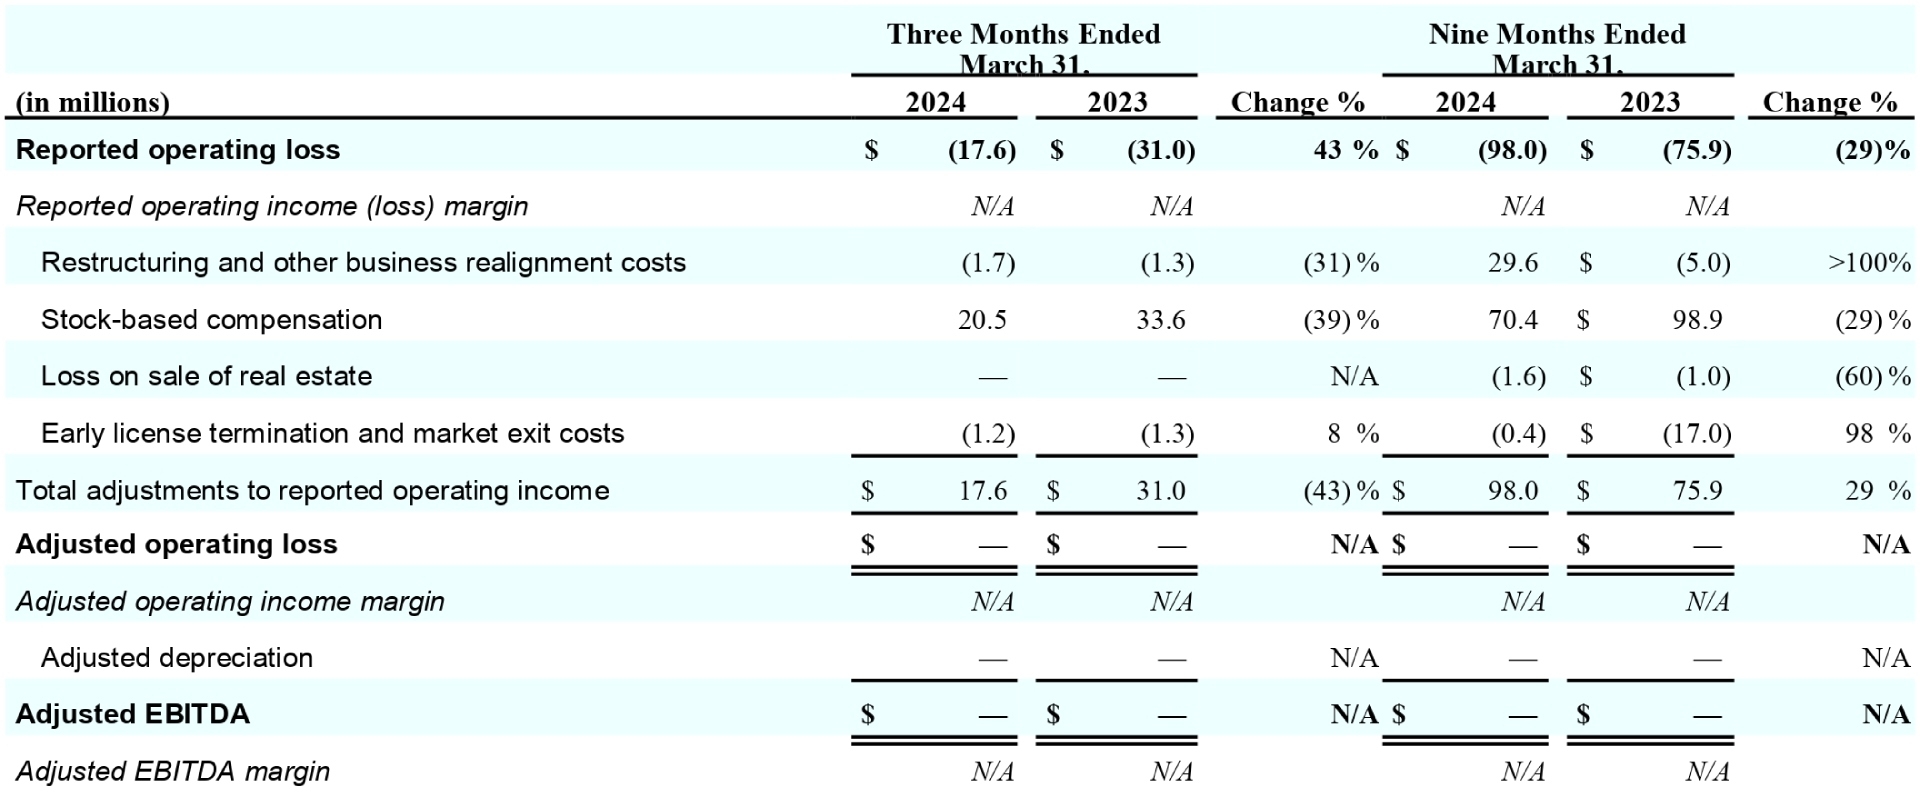
In the three months ended March 31, 2024, we incurred restructuring and other business structure realignment costs of $(1.7). We incurred restructuring costs of $0.9 primarily related to the restructuring actions, included in the Condensed Consolidated Statements of Operations; and a credit in business structure realignment costs of $(2.6). In the three months ended March 31, 2023, we incurred a credit in restructuring and other business structure realignment costs of $(1.3). We incurred a credit in restructuring costs of $(1.3) primarily related to the Transformation Plan, included in the Condensed Consolidated Statements of Operations, and zero business structure realignment costs.In the nine months ended March 31, 2024, we incurred restructuring and other business structure realignment costs of $29.6. We incurred restructuring costs of $35.0 primarily related to the restructuring actions, included in the Condensed Consolidated Statements of Operations; and a credit in business structure realignment costs of $(5.4). In the nine months ended March 31, 2023, we incurred a credit in restructuring and other business structure realignment costs of $(5.0). We incurred a credit in restructuring costs of $(5.4) primarily related to the Transformation Plan, included in the Condensed Consolidated Statements of Operations; and business structure realignment costs of $0.4 primarily related to the Transformation Plan and certain other programs.
In the three months ended March 31, 2024, adjusted depreciation expense of $25.7 and $30.3 was reported in the Prestige and Consumer Beauty segments, respectively. In the three months ended March 31, 2023, adjusted depreciation expense of $28.6 and $30.6 was reported in the Prestige and Consumer Beauty segments, respectively.In the nine months ended March 31, 2024, adjusted depreciation expense of $80.2 and $91.0 was reported in the Prestige and Consumer Beauty segments, respectively. In the nine months ended March 31, 2023, adjusted depreciation expense of $82.9 and $90.8 was reported in the Prestige and Consumer Beauty segments, respectively.
SEGMENT OPERATING INCOME (LOSS), SEGMENT ADJUSTED OPERATING INCOME (LOSS) AND SEGMENT ADJUSTED EBITDA
OPERATING INCOME, ADJUSTED OPERATING INCOME AND ADJUSTED EBITDA- PRESTIGE SEGMENT
OPERATING (LOSS) INCOME, ADJUSTED OPERATING (LOSS) INCOME AND ADJUSTED EBITDA- CONSUMER BEAUTY SEGMENT
OPERATING LOSS, ADJUSTED OPERATING LOSS AND ADJUSTED EBITDA- CORPORATE SEGMENT
RECONCILIATION OF REPORTED INCOME BEFORE INCOME TAXES AND EFFECTIVE TAX RATES TO ADJUSTED INCOME BEFORE INCOME TAXES AND ADJUSTED EFFECTIVE TAX RATES FOR COTY INC.
The adjusted effective tax rate was 19.3% for the three months ended March 31, 2024 compared to 20.2% for the three months ended March 31, 2023. The differences were primarily due to the resolution of foreign uncertain tax positions having a greater proportional effect in the current period.
The adjusted effective tax rate was 29.4% for the nine months ended March 31, 2024 compared to 24.5% for the nine months ended March 31, 2023. The differences were primarily due to an expense of $24.3 in the current period recognized on the revaluation of the Company's deferred tax liabilities due to a tax rate increase enacted in Switzerland.
See a description of adjustments under Reconciliation of Reported Net Income to Adjusted Operating Income and Adjusted EBITDA for Coty Inc.
The tax effects of each of the items included in adjusted income are calculated in a manner that results in a corresponding income tax expense/provision for adjusted income. In preparing the calculation, each adjustment to reported income is first analyzed to determine if the adjustment has an income tax consequence. The provision for taxes is then calculated based on the jurisdiction in which the adjusted items are incurred, multiplied by the respective statutory rates and offset by the increase or reversal of any valuation allowances commensurate with the non-GAAP measure of profitability.
The amount represents the realized and unrealized (gain) loss recognized for the change in the fair value of the investment in Wella.
For the three months ended March 31, 2024 and 2023, this primarily represents adjustments equity loss from KKW.
For the nine months ended March 31, 2024, this primarily this primarily represents divestiture-related costs related to our equity investments and loss from our equity investment in KKW. For the nine months ended March 31, 2023, this primarily represents adjustments for equity loss from KKW.
RECONCILIATION OF REPORTED NET INCOME TO ADJUSTED NET INCOME FOR COTY INC.
Adjusted diluted EPS includes $0.01 hurt related to the net impact of the Total Return Swaps in the three months ended March 31, 2024. Adjusted diluted EPS includes $0.02 hurt related to the net impact of the Total Return Swaps in the nine months ended March 31, 2024.
See a description of adjustments under “Adjusted Operating Income for Coty Inc.”
The amounts represent the after-tax impact of the non-GAAP adjustments included in Net income attributable to noncontrolling interest based on the relevant noncontrolling interest percentage in the Condensed Consolidated Statements of Operations.
Adjusted Diluted EPS is adjusted by the effect of dilutive securities. For the three months ended March 31, 2024 and 2023, shares for the Forward Repurchase Contracts were excluded from the computation of adjusted diluted EPS as Coty is in the position to receive shares from the counterparties and as such their inclusion would be anti-dilutive. Accordingly, we did not reverse the impact of the fair market value losses/(gains) for contracts with the option to settle in shares or cash of $7.1 and $(93.9), respectively. For the three months ended March 31, 2024, convertible Series B Preferred Stock (23.7 million weighted average dilutive shares) were anti-dilutive. Accordingly, we excluded these shares from the diluted shares and did not adjust the earnings for the related dividend of $3.3. For the three months ended March 31, 2023, as the Convertible Series B Preferred Stock was dilutive, an adjustment to reverse the impact of the preferred stock dividends of $3.3 was required.For the nine months ended March 31, 2024 and 2023, shares for the Forward Repurchase Contracts were excluded from the computation of adjusted diluted EPS as Coty is in the position to receive shares from the counterparties and as such their inclusion would be anti-dilutive. Accordingly, we did not reverse the impact of the fair market value losses/(gains) for contracts with the option to settle in shares or cash of $6.9 and $(100.7), respectively. For the nine months ended March 31, 2024, convertible Series B Preferred Stock (23.7 million weighted average dilutive shares) were anti-dilutive. Accordingly, we excluded these shares from the diluted shares and did not adjust the earnings for the related dividend of $9.9. For the nine months ended March 31, 2023, as the Convertible Series B Preferred Stock was dilutive, an adjustment to reverse the impact of the preferred stock dividends of $9.9 was required.
The amount represents the realized and unrealized (gain) loss recognized for the change in the fair value of the investment in Wella.
For the three months ended March 31, 2024 and 2023, this primarily represents loss from equity investment in KKW.
For the nine months ended March 31, 2024, this primarily represents divestiture-related costs related to our equity investments and loss from equity investment in KKW. For the nine months ended March 31, 2023, this primarily represents adjustments for equity loss from KKW.
RECONCILIATION OF NET CASH PROVIDED BY OPERATING ACTIVITIES TO FREE CASH FLOW
RECONCILIATION OF TOTAL DEBT TO ECONOMIC NET DEBT
RECONCILIATION OF TTM(a) NET INCOME TO TTM ADJUSTED EBITDA
Trailing twelve months (TTM) net income from continuing operations, reported operating income, adjusted operating income, and adjusted EBITDA represents the summation of each of these financial metrics for the quarters ended March 31, 2024, December 31, 2023, September 30, 2023, and June 30, 2023.
Adjusted depreciation for the twelve months ended March 31, 2024 represents depreciation expense for Coty Inc for the period, excluding accelerated depreciation.
COMPARISON OF TOTAL DEBT/NET INCOME FROM CONTINUING OPERATIONS TO FINANCIAL NET DEBT/ADJUSTED EBITDA
TTM adjusted operating income for the twelve months ended March 31, 2024 represents the summation of adjusted operating income for Coty Inc for each of the quarters ended March 31, 2024, December 31, 2023, September 30, 2023, and June 30, 2023. For a reconciliation of adjusted operating income to operating income for Coty Inc for each of those periods, see the table entitled "Reconciliation of TTM of Net Income to Adjusted Operating Income to Adjusted EBITDA" for each of those periods.
TTM Net income (loss) from continuing operations for the twelve months ended March 31, 2024 represents the summation of the Net income (loss) from continuing operations for each of the quarters ended March 31, 2024, December 31, 2023, September 30, 2023 and June 30, 2023.
Financial Net Debt equals Total Debt minus Cash and cash equivalents as of March 31, 2024.
Not relevant.
RECONCILIATION OF REPORTED NET REVENUES TO LIKE-FOR-LIKE NET REVENUES
The Company ceased commercial activities in Russia at the end of the second quarter of fiscal 2023. As a result, there are no revenues from Russia after the second quarter of fiscal 2023. The Company also had an early license termination with Lacoste and concluded the sell-off period at the end of the second quarter of fiscal 2024. In calculating the QTD YoY LFL revenue change, to maintain comparability, we have excluded the third quarter of fiscal 2023 Lacoste contribution. In calculating the YTD YoY LFL revenue change, to maintain comparability, we have excluded the first and second quarter of fiscal 2023 financial contribution of our Russian subsidiary and the third quarter of fiscal 2023 Lacoste financial contribution.
COTY INC. SUBSIDIARIES
CONDENSED CONSOLIDATED BALANCE SHEETS
COTY INC. & SUBSIDIARIES
CONDENSED CONSOLIDATED STATEMENTS OF CASH FLOWS
* All content is copyrighted by Industry Intelligence, or the original respective author or source. You may not recirculate, redistrubte or publish the analysis and presentation included in the service without Industry Intelligence's prior written consent. Please review our terms of use.
More from our Consumer packaged goods (CPG) Coverage
This website stores cookies on your computer. These cookies are used to improve your website experience and provide more personalized services to you, both on this website and through other media. To find out more about the cookies we use, see our Privacy Policy. We won't track your information when you visit our site. But in order to comply with your preferences, we'll have to use just one tiny cookie so that you're not asked to make this choice again.